TidesDB (TideSQL 4) & RocksDB in MariaDB 12.2.2 Sysbench Analysis

published on March 21st, 2026
In this article I will be comparing the performance of TidesDB (TideSQL) and RocksDB (MyRocks) in MariaDB 12.2.2 using sysbench.
I use TideSQL v4.0.0 and it is running latest TidesDB v8.9.4 and RocksDB (@@rocksdb_git_hash=79f08d7ffa6d34d9ca3357777bcb335884a56cfb) which seems to be RocksDB 6.29.5.
The MariaDB configs used can be found here (my.cnf):
https://github.com/tidesdb/mariadb-bench-cnf
The specs for the environment are:
- Intel Core i7-11700K (8 cores, 16 threads) @ 4.9GHz
- 48GB DDR4
- Western Digital 500GB WD Blue 3D NAND Internal PC SSD (SATA)
- Ubuntu 23.04 x86_64 6.2.0-39-generic
- GCC (glibc)
For the benchmark I wrote a shell script in which run’s 5 workloads , you can find the script here (9d61af31cd493d6cd079d1cbd9fbf2b0ba00d74328171067ca00bc6a4ec9758c).
/tidesdb_rocksdb_sysbench.sh -s 500000 -T 8 -d 120 -W oltp_read_write,oltp_read_only,oltp_write_only,oltp_update_non_index,oltp_deleteEach workload ran for 120 seconds with 8 threads against 4 tables of 500,000 rows each. A 60-second settle period after prepare gave background threads a window to finish before the run started. Errors from deadlocks (1213) and lock wait timeouts (1180) were ignored by sysbench for both engines.
Average Latency
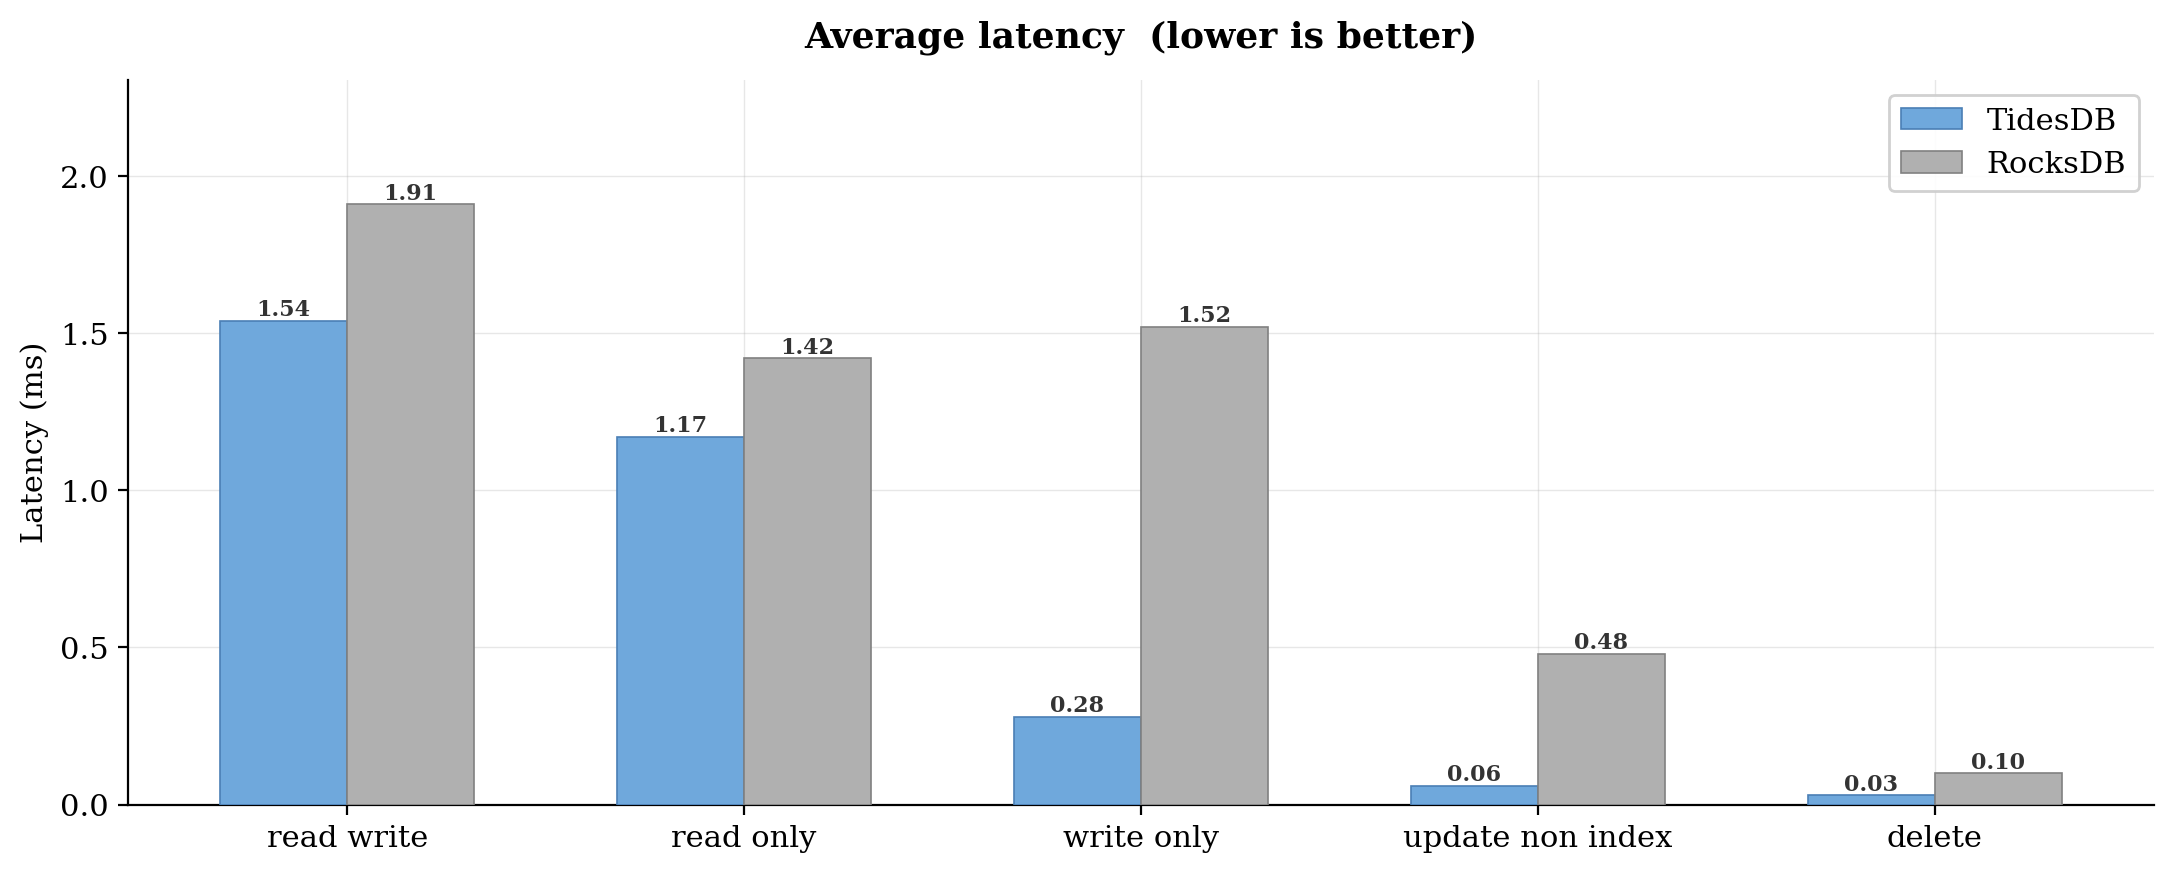
TidesDB had lower average latency across all five workloads. The gap was modest for read-heavy tests. Read-write landed at 1.54 ms versus 1.91 ms. Read-only was 1.17 ms versus 1.42 ms. That is roughly 1.2x in both cases.
The write-only workload is where things spread out. TidesDB averaged 0.28 ms per transaction versus 1.52 ms for RocksDB, which is about 5.4x lower. Update non-index was even wider at 0.06 ms versus 0.48 ms. Delete was 0.03 ms versus 0.10 ms.
Maximum Latency
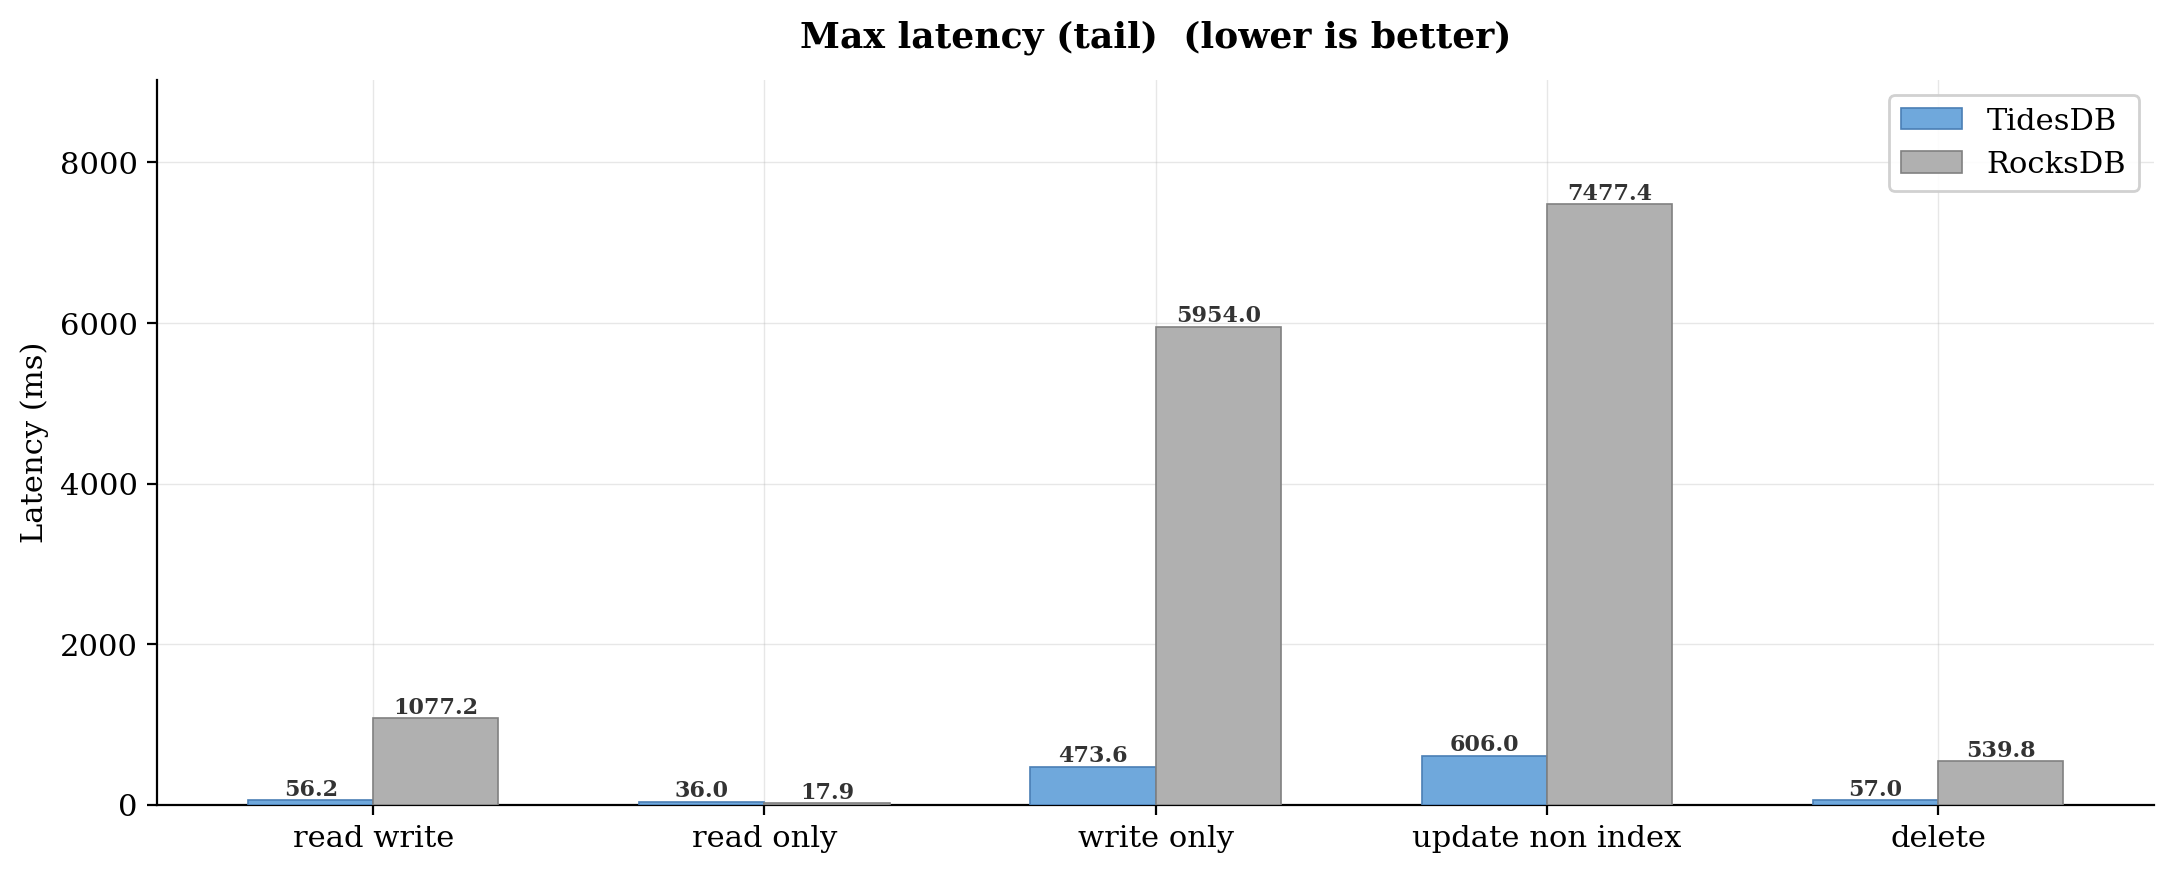
Max latency tells you about the worst thing that happened during the entire run. It is one transaction out of millions, but it matters if you have SLAs.
RocksDB hit 1,077 ms in read-write. That is over a full second for a single OLTP transaction. Write-only was worse at 5,954 ms. Update non-index peaked at 7,477 ms.
TidesDB stayed much, much tighter. Read-write max was 56 ms. Write-only hit 474 ms. Update non-index was 606 ms. Still not perfect, but an order of magnitude better in every write-heavy case. One thing worth noting. On read-only, RocksDB actually had a lower max latency. 17.94 ms versus 35.96 ms for TidesDB.
P95 Latency
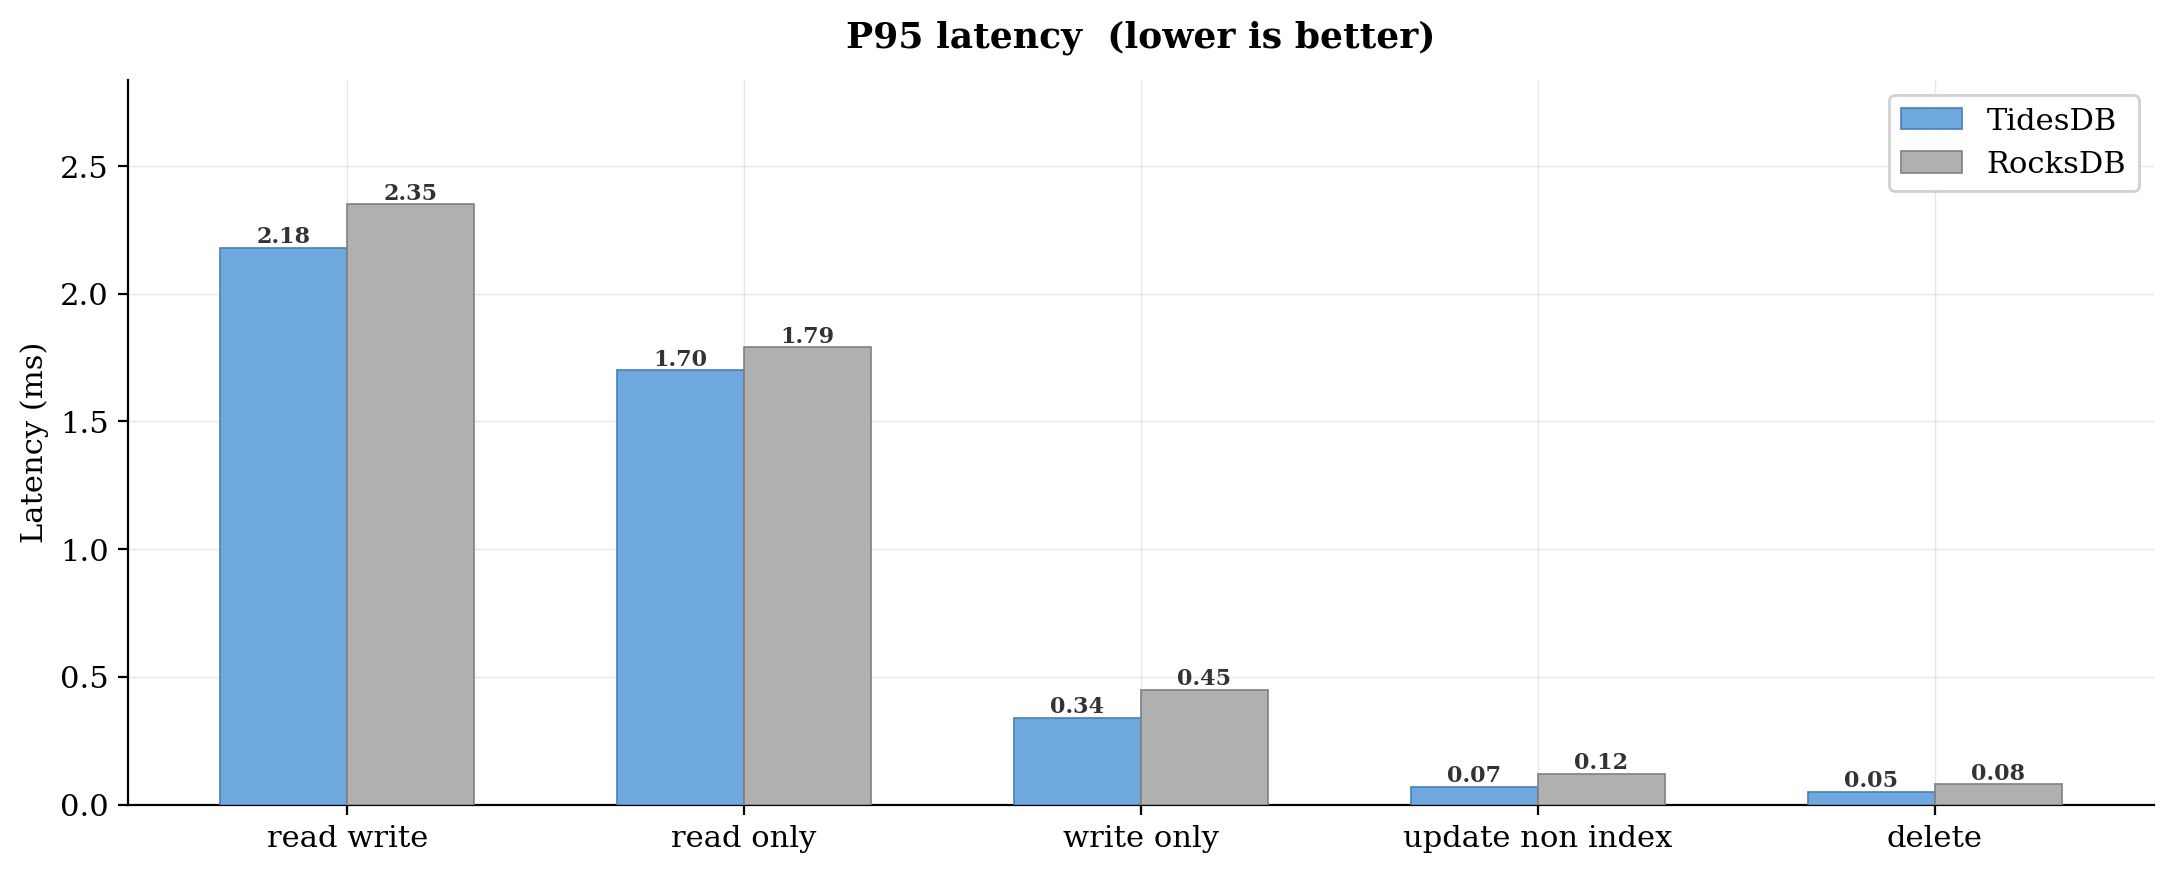
P95 is the latency that 95% of transactions completed within. It filters out the worst outliers but still captures the experience of the slow tail.
Both engines were close on read workloads. Read-write was 2.18 ms versus 2.35 ms. Read-only was 1.70 ms versus 1.79 ms. Not enough to matter in practice.
The write-heavy workloads showed more separation. Write-only P95 was 0.34 ms for TidesDB versus 0.45 ms for RocksDB. Update non-index was 0.07 ms versus 0.12 ms. Delete was 0.05 ms versus 0.08 ms.
These are all sub-millisecond, which is good. But TidesDB was consistently lower.
Prepare Time
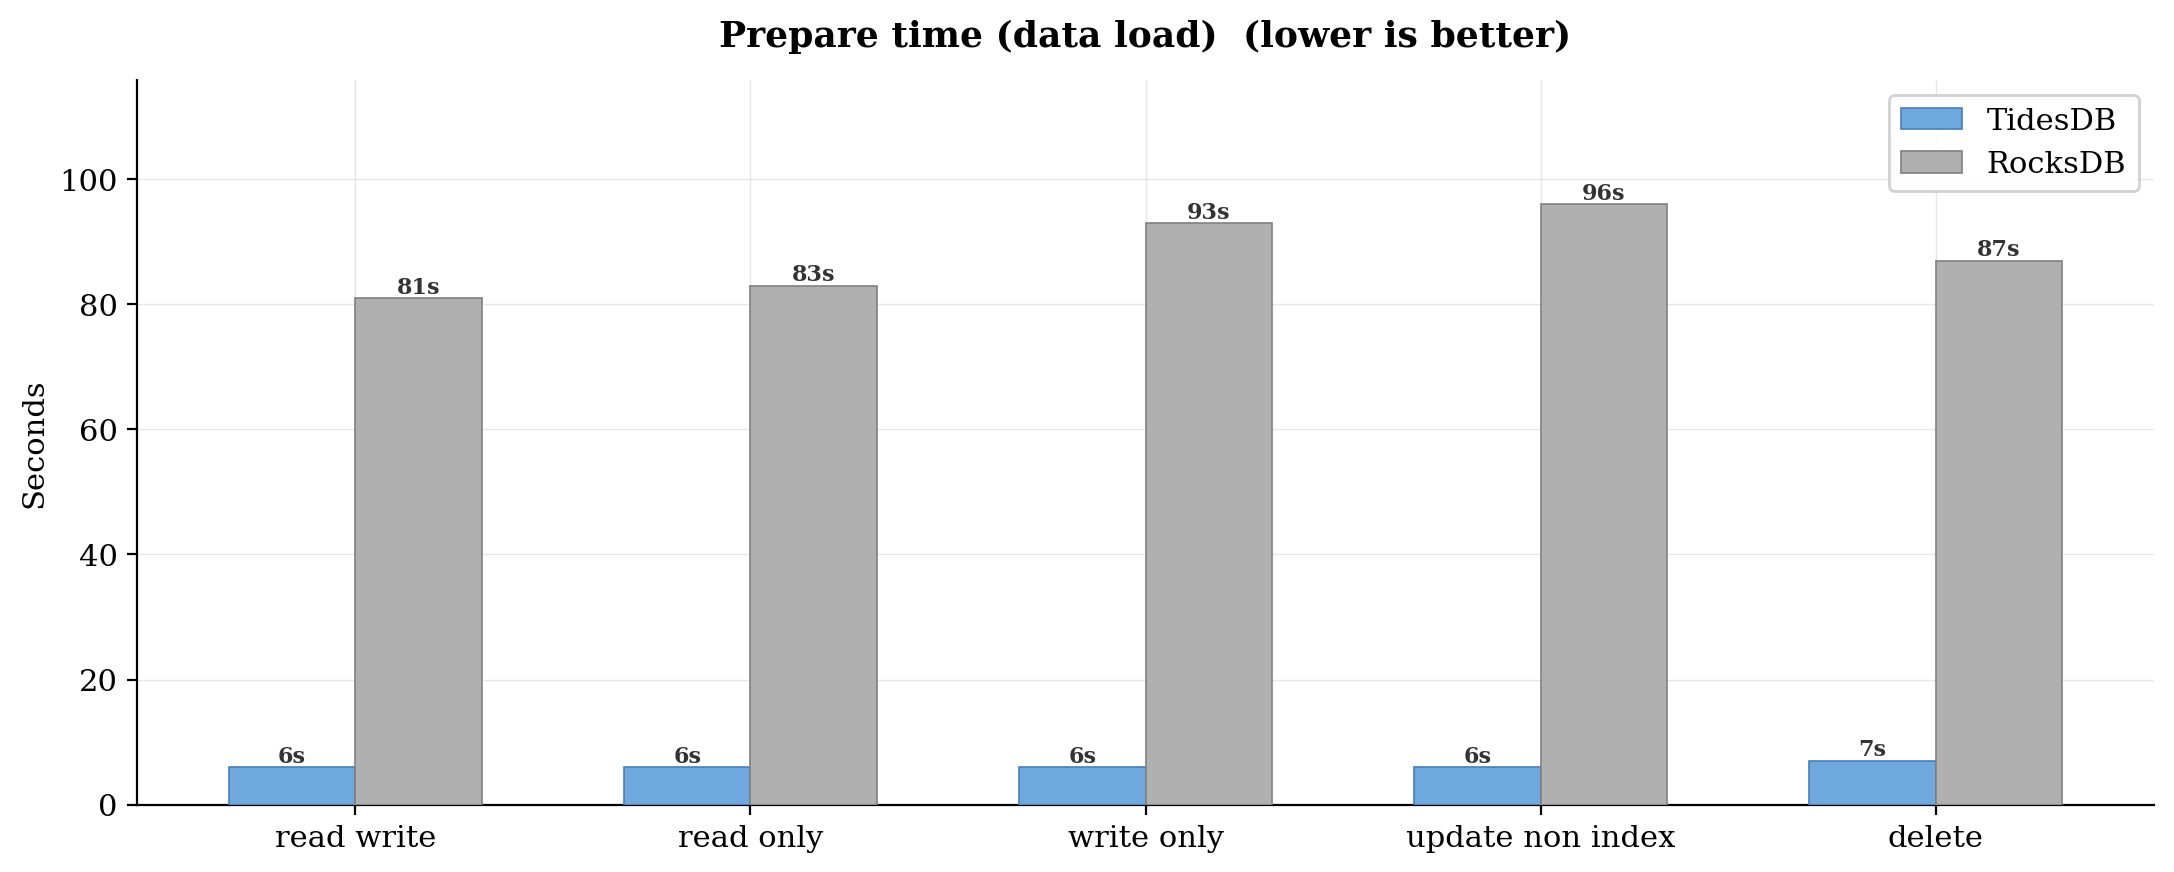
Prepare time is how long sysbench takes to bulk-load the test tables before the run starts. This is a pure sequential insert workload.
TidesDB loaded all 2 million rows (4 tables x 500k) in 6 to 7 seconds across every workload.
RocksDB took 81 to 96 seconds. That is roughly 13x to 16x slower.
QPS
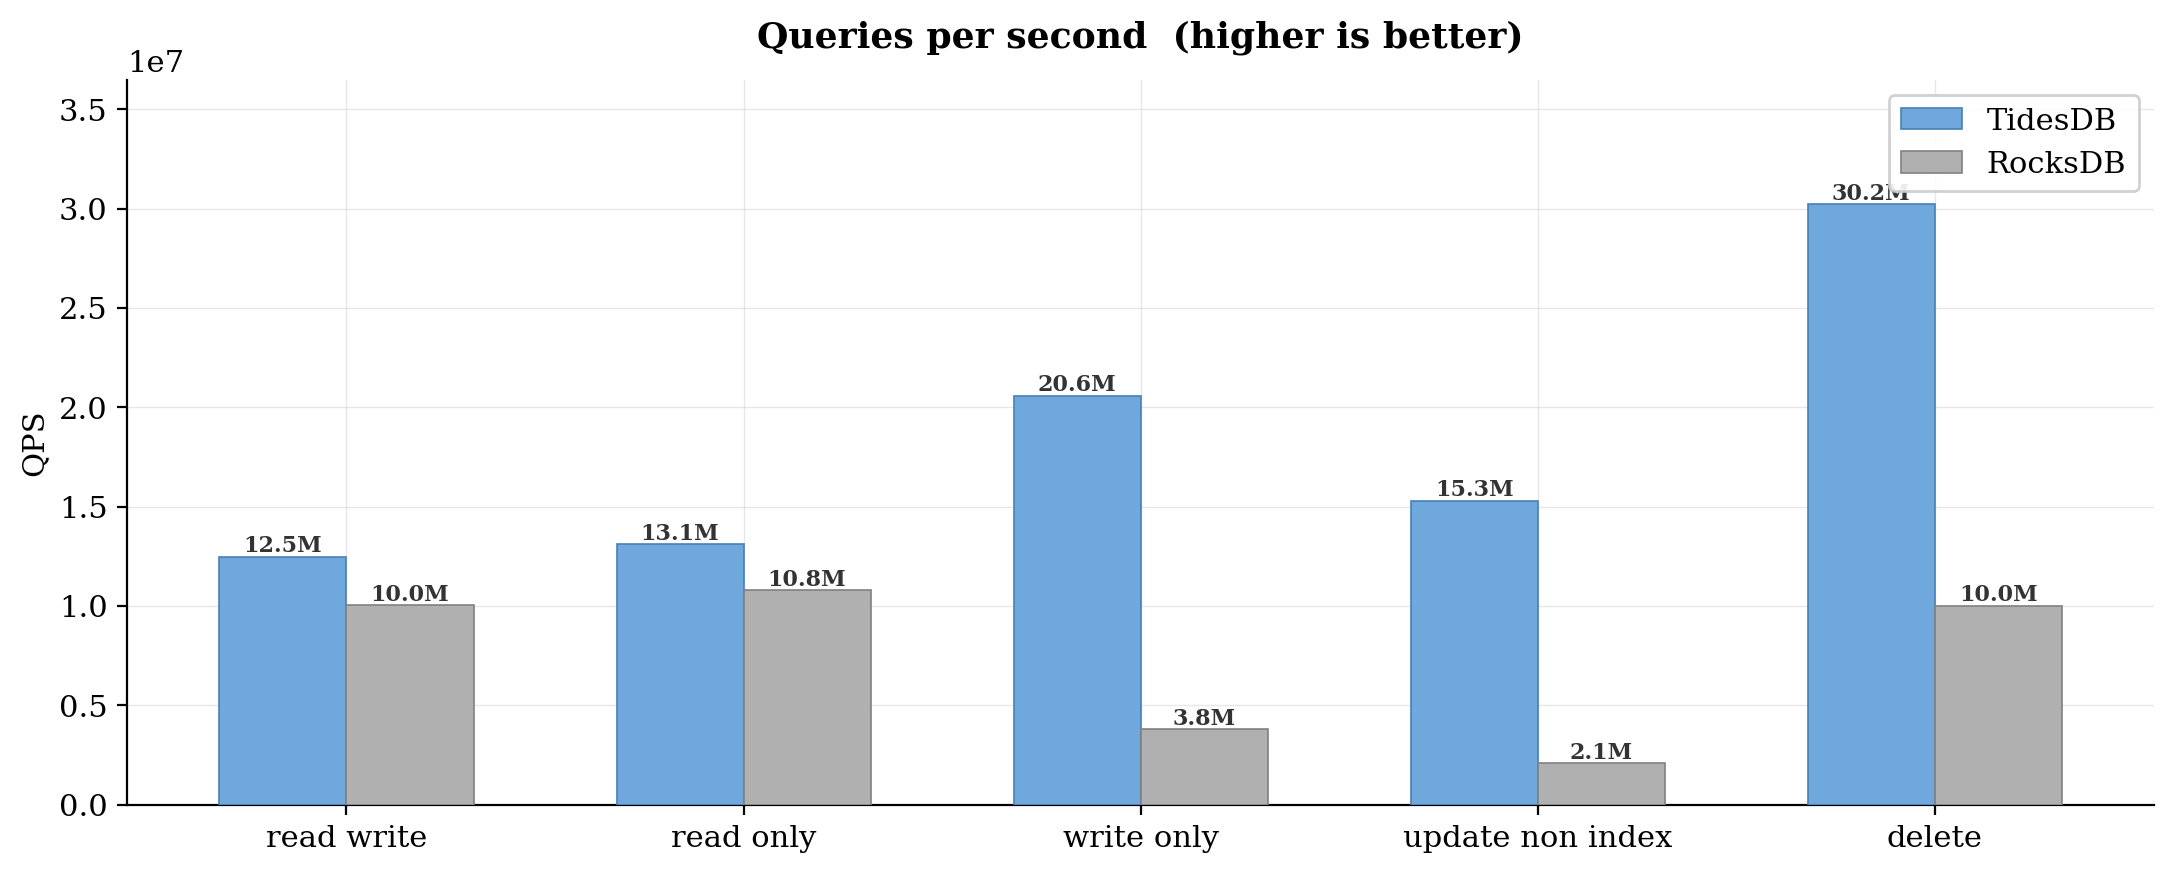
QPS includes reads, writes, and other queries that sysbench counts per workload. It is the total query volume the engine handled in 120 seconds.
Read-write was 12.5M queries for TidesDB versus 10.0M for RocksDB. Read-only was 13.1M versus 10.8M. Both roughly 1.2x.
Write-only is where the multiplier grows. TidesDB pushed 20.6M queries versus 3.8M for RocksDB. That is 5.4x. Update non-index was 15.3M versus 2.1M, which is 7.3x. Delete was 30.2M versus 10.0M, about 3.0x.
The pattern is consistent. For read-heavy work, TidesDB has a moderate edge. For write-heavy work, the gap opens rather significantly.
TPS
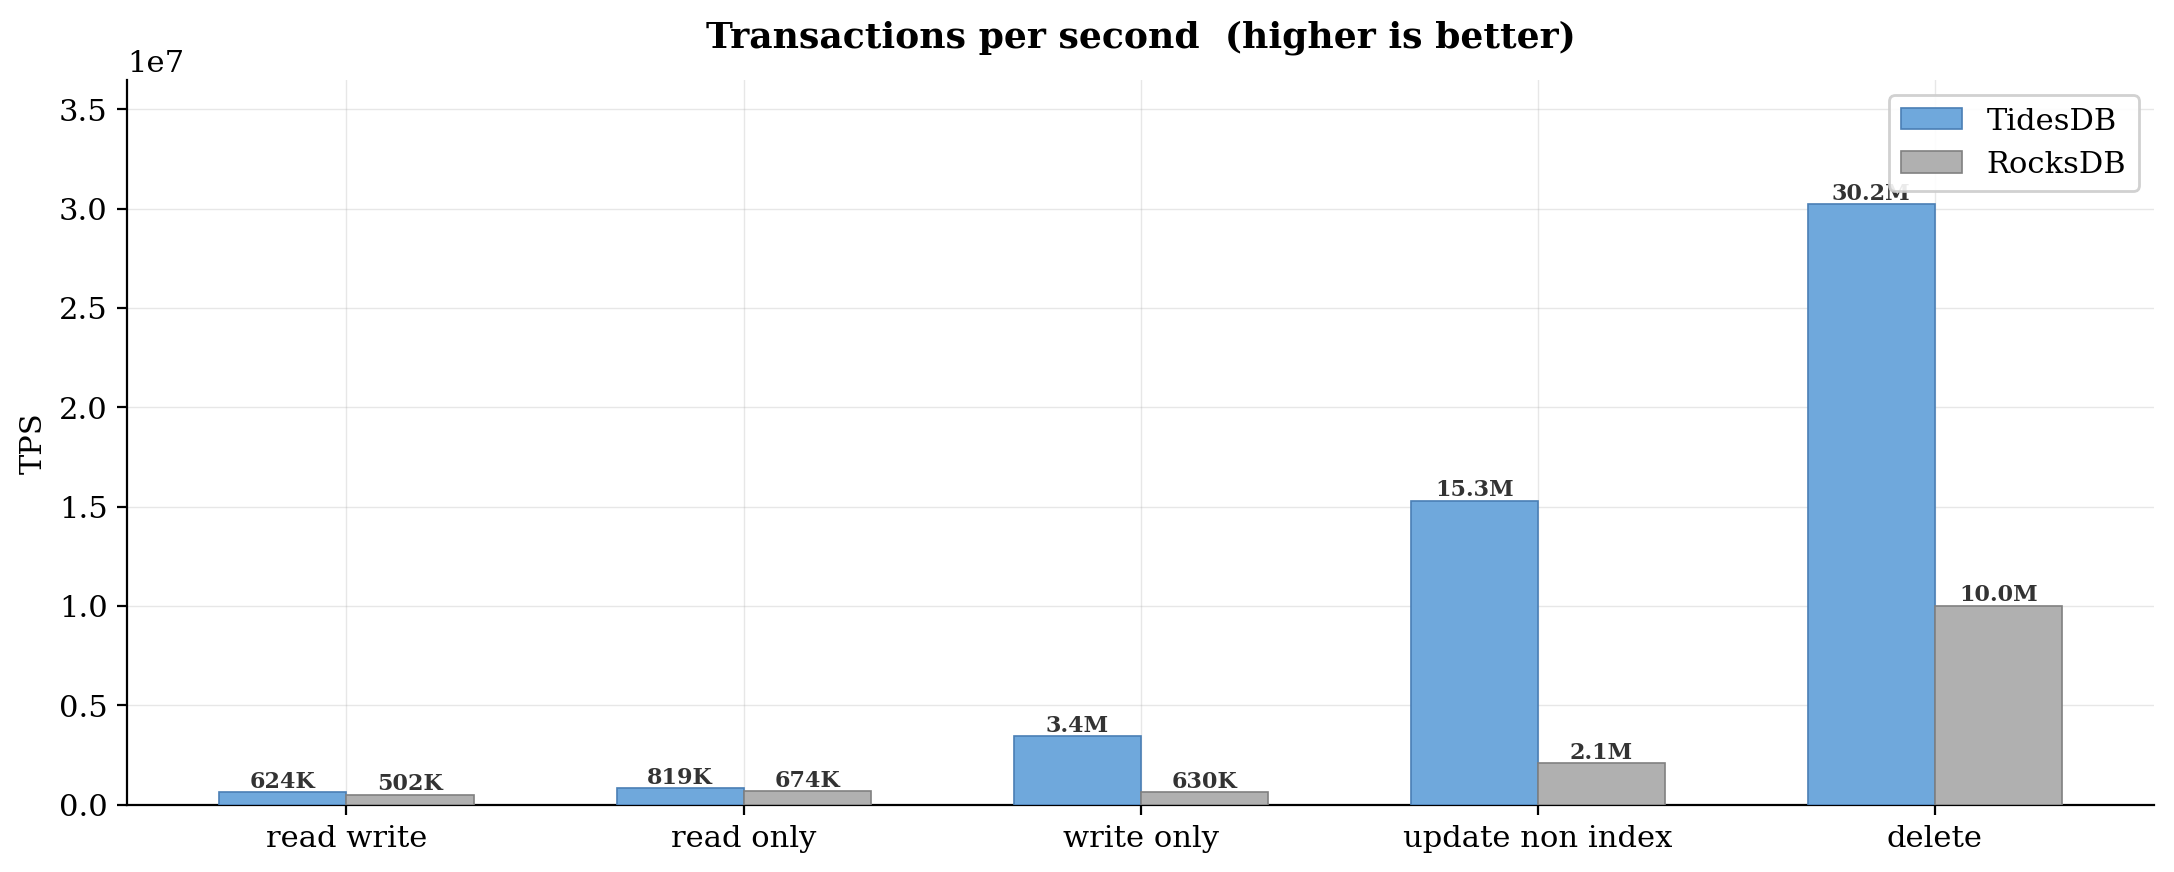
TPS tracks completed transactions per second. In sysbench OLTP, one transaction is one lua script execution that may contain multiple queries.
Read-write TPS was 623K for TidesDB and 502K for RocksDB. Read-only was 819K versus 674K. Again, about 1.2x in both mixed and read-only scenarios.
Write-only TPS was 3.4M versus 630K. That is 5.4x. Update non-index hit 15.3M versus 2.1M for a 7.3x difference. Delete reached 30.2M versus 10.0M.
The write-only and update-non-index numbers are very high for TidesDB. RocksDB’s write path has more overhead per operation.
Summary
TidesDB outperformed RocksDB across all five sysbench OLTP workloads in this configuration. This analysis hits memory and disk, this is not pure in-memory performance. In previous benchmark analysis space efficiency is usually better at the plugin level than RocksDB and InnoDB and this is very much true at the engine-engine level as well.
This is a huge leap in TideSQL development. TideSQL 4 show’s tremendous improvement over previous versions.
As per usual, benchmark your own workloads to understand the real-world impact for your use case.
That’s all for now.
Thank you for reading!
—
You can find the raw data below:
| File | SHA256 Checksum |
|---|---|
| bench_results_20260321_014527.csv | a5bf17cc03f50d3bb172925132cb17b58411a8e3a7828cfceb43ebea02a9c4ad |
| bench_logs_20260321_014527.zip | d323ee9510f84a3b0d28767e8a17e382ebf51346cec495426c84e7e6b5d20333 |
Learn more about TideSQL by visiting the reference.