Benchmark Analysis on TidesDB (TideSQL v3.1.0) & InnoDB in MariaDB v12.2.2

published on February 16th, 2026
Hey everyone, so with the latest releases of TidesDB and TideSQL, I decided to run some benchmarks to compare the performance of TidesDB (TideSQL v3.1.0) and InnoDB in MariaDB v12.2.2.
Environment:
- AMD Ryzen Threadripper 2950X (16 cores 32 threads) @ 3.5GHz
- 128GB DDR4
- Ubuntu 22.04 x86_64
- GCC (glibc)
- XFS raw NVMe(SAMSUNG MZVLB512HAJQ-00000) w/discard, inode64, nodiratime, noatime, logbsize=256k, logbufs=8
- Underlying TidesDB version used was v8.5.2
I ran the benchmark using the sqlbench tool.
Using below command and configuration:
nohup env \ BUILD_DIR=/usr/local/mariadb \ MYSQL_BIN=/usr/local/mariadb/bin/mariadb \ MYSQLD=/usr/local/mariadb/bin/mariadbd \ PLUGIN_DIR=/usr/local/mariadb/lib/plugin \ DATA_DIR=/data/db-bench \ TABLE_SIZES="500000" \ TABLES=1 \ THREAD_COUNTS="4 8" \ TIME=240 \ WARMUP=30 \ ENGINES="InnoDB TidesDB" \ WORKLOADS="oltp_read_write oltp_point_select oltp_insert oltp_write_only" \ TIDESDB_SYNC_MODE=0 \ ITERATIONS=1 \ TIDESDB_COMPRESSION=LZ4 \ INNODB_COMPRESSION=LZ4 \ TIDESDB_BLOCK_CACHE=67108864 \ INNODB_BUFFER_POOL=64M \ INNODB_FLUSH=0 \ ./sqlbench.sh > sqlbench.log 2>&1Data in these benchmarks live in memory and disk based on the configuration. Caches are set to 64mb for both engines, sync off (durability off). Both engines are using RR (Repeatable read) isolation level for transactions. Last bit both engines are utilziing the same compression (LZ4).
Throughput Comparison
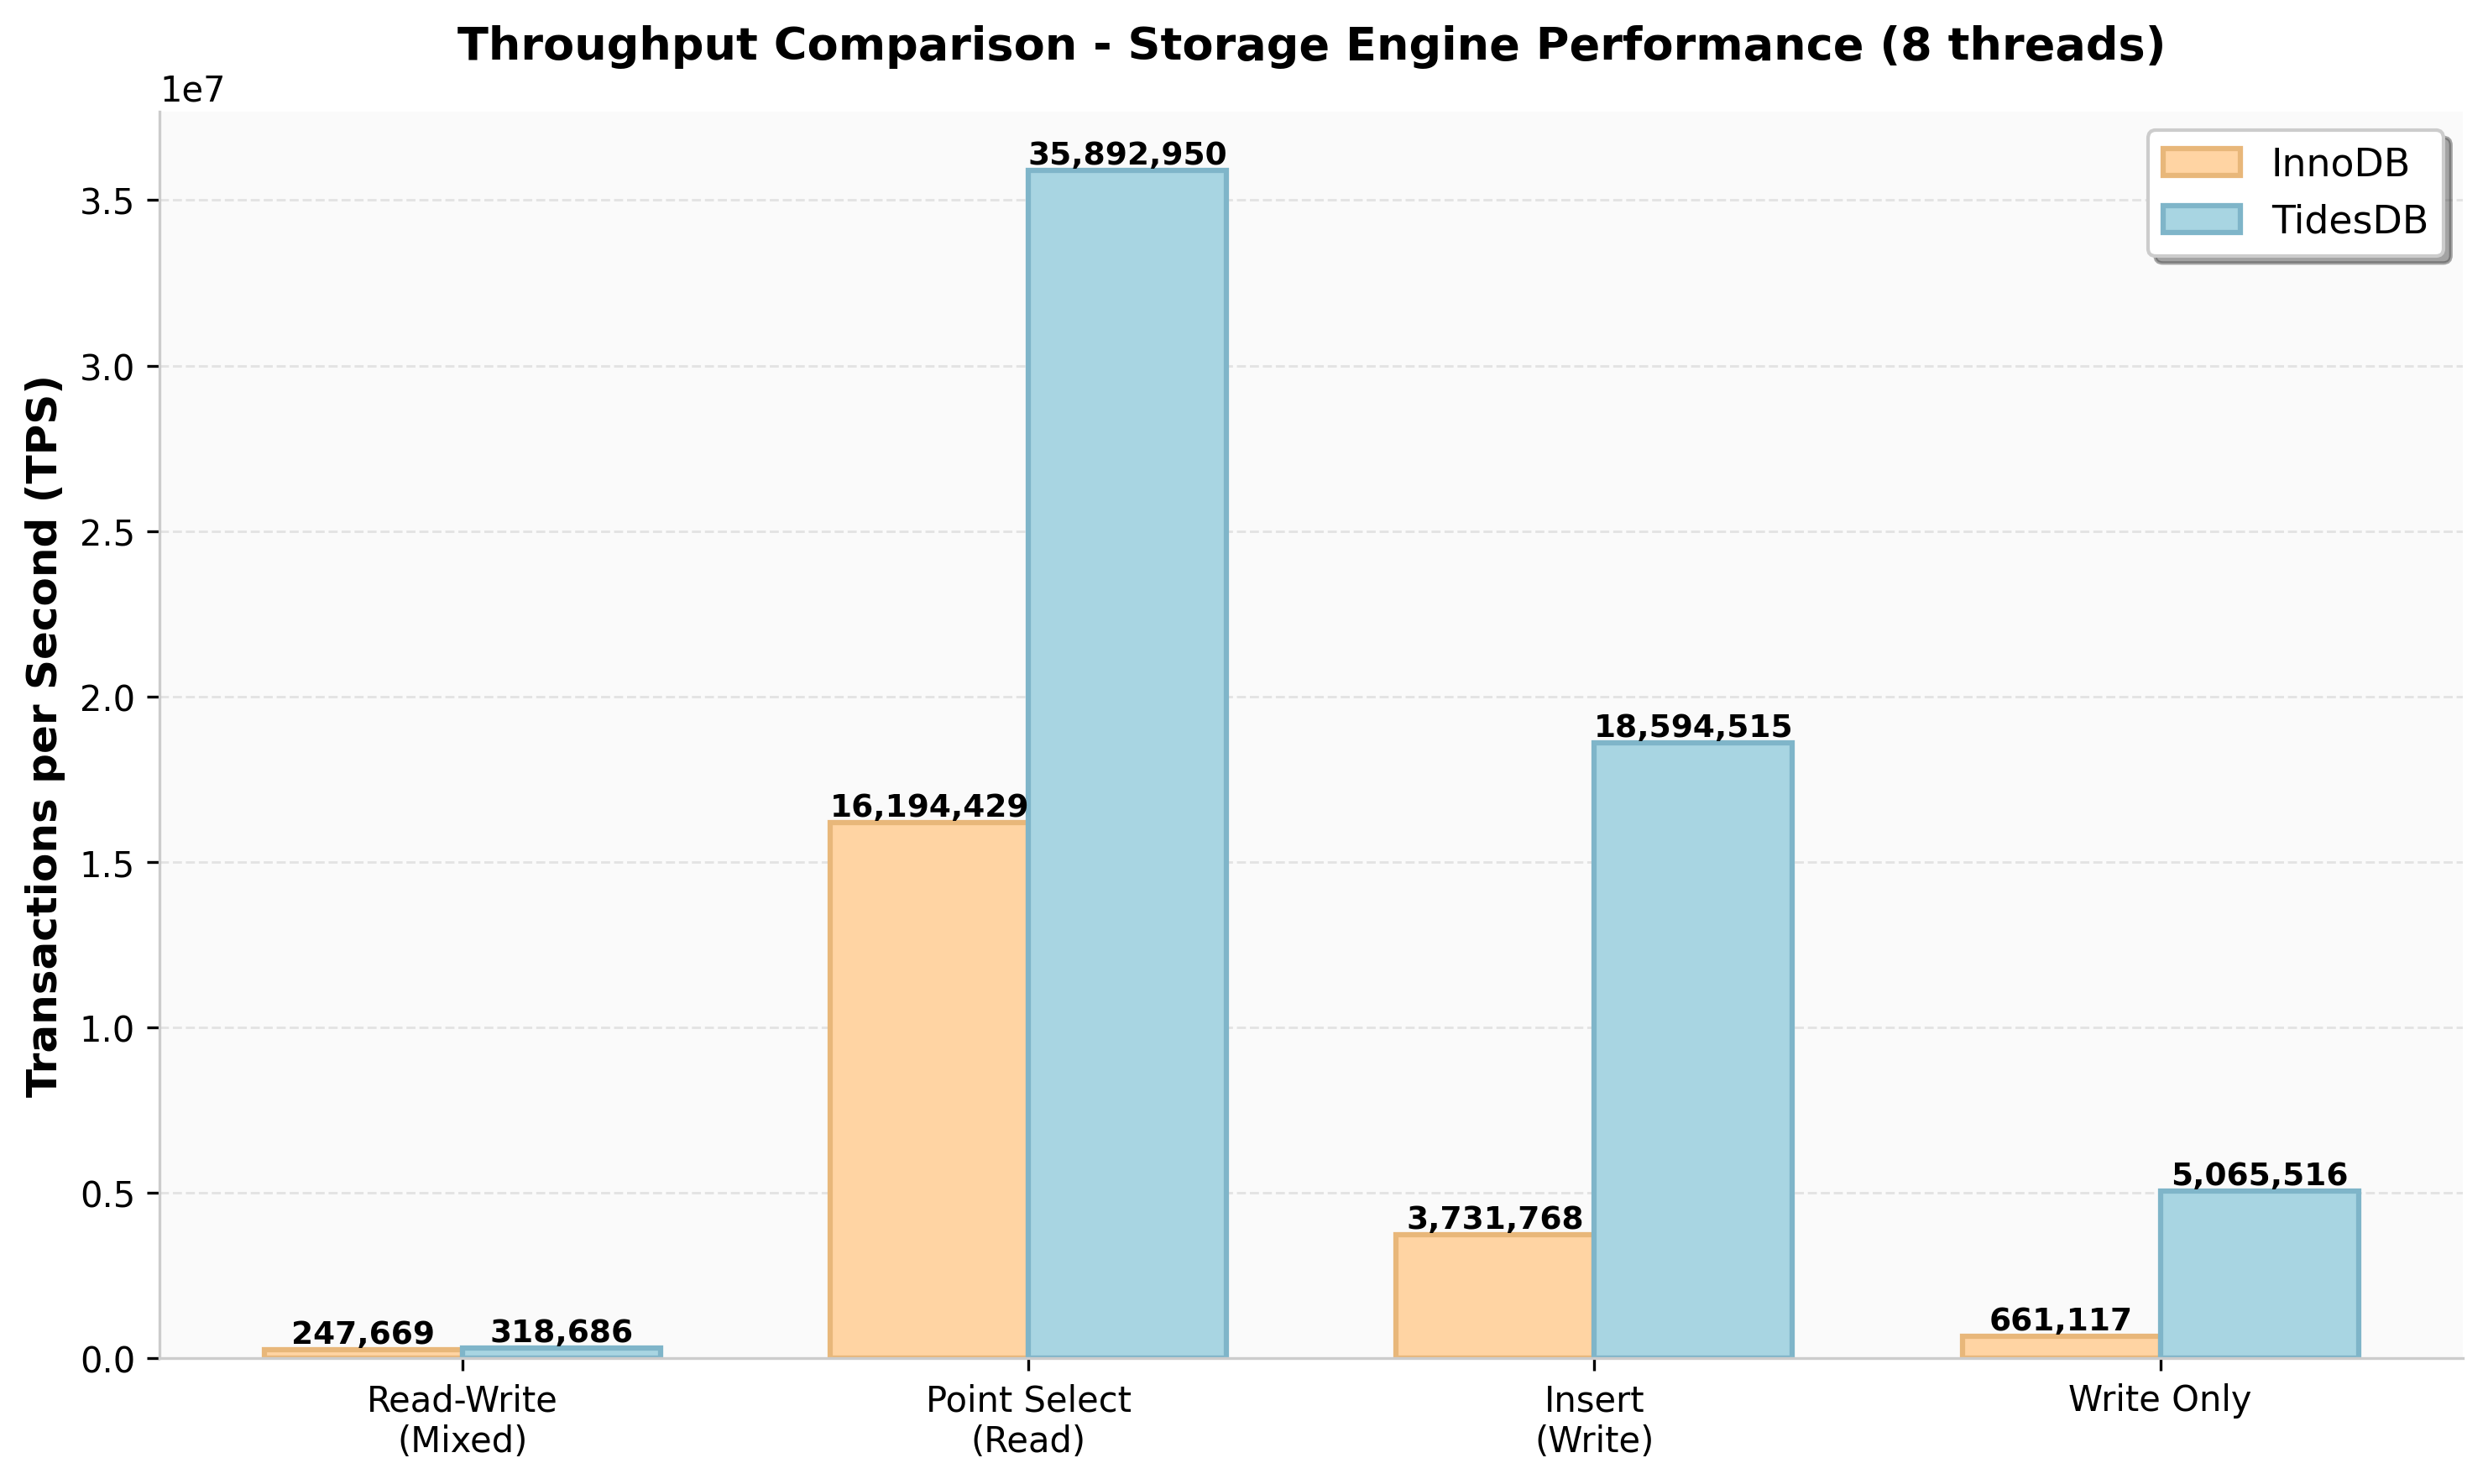
TidesDB shows 1.3x advantage on mixed read-write, modest gains on point-select (2.2x), and dominates write-heavy workloads with 5x on insert and 7.7x on write-only.
Average Latency
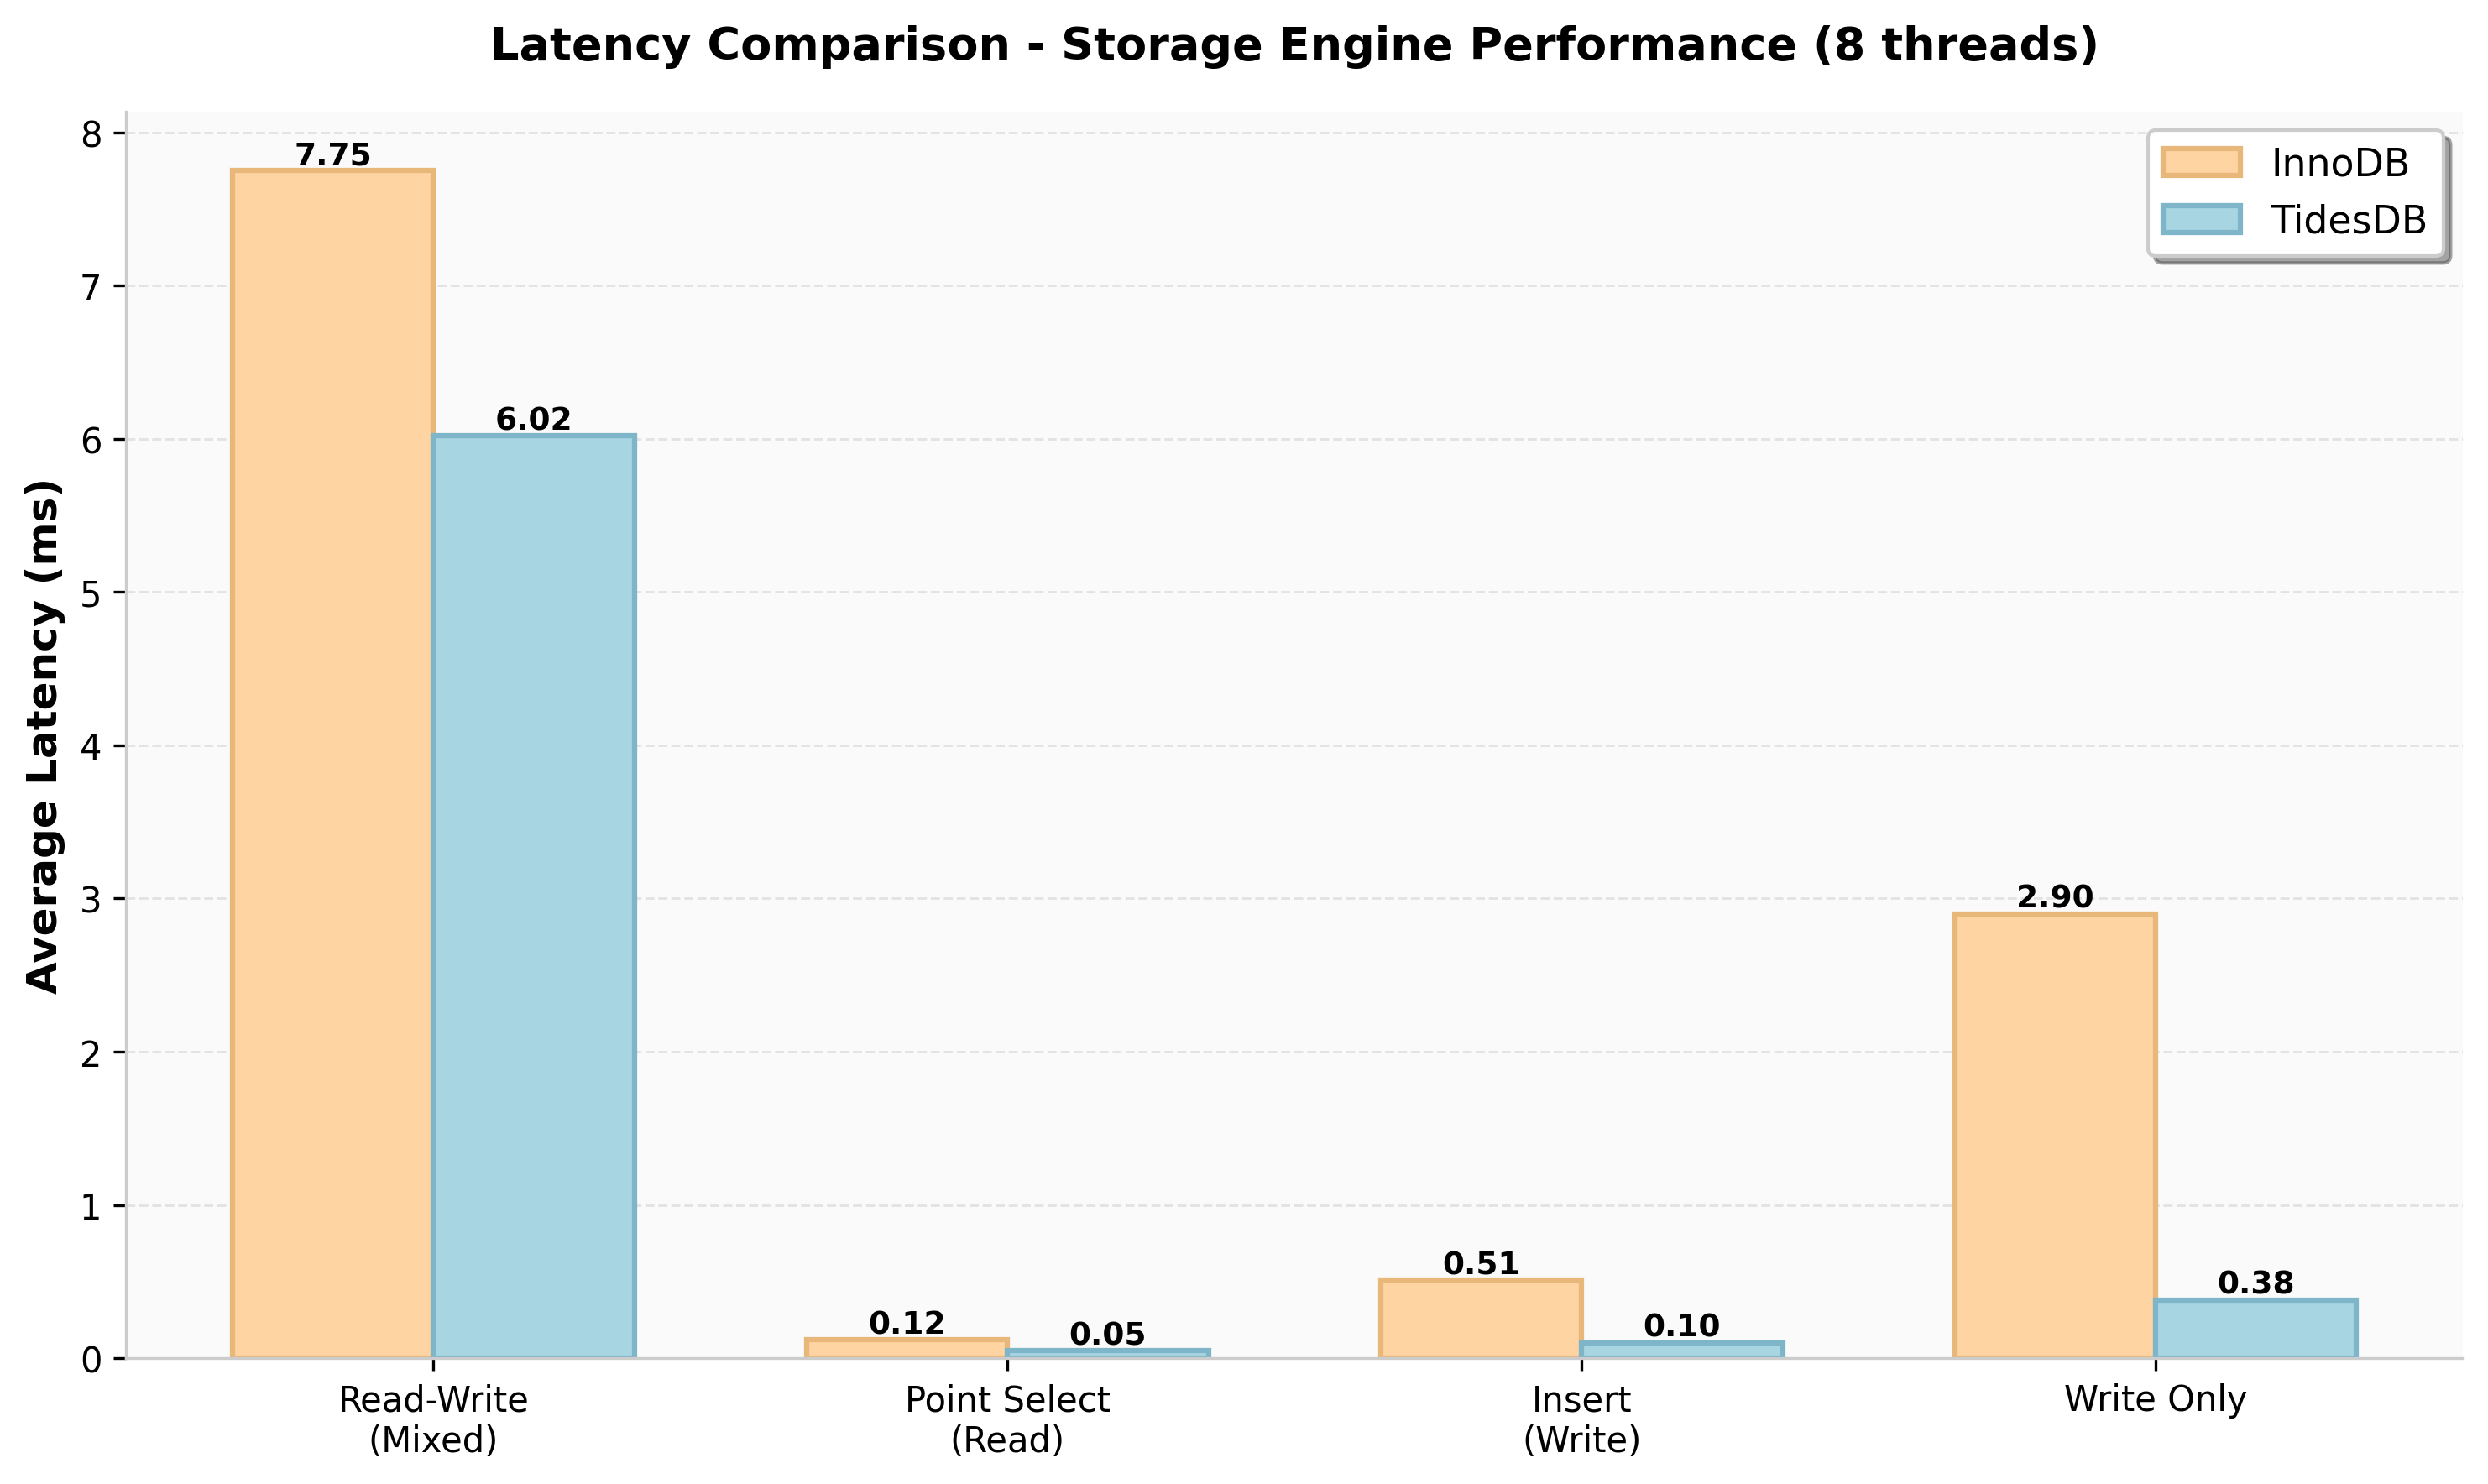
TidesDB wins across all workloads in regards to latency. Point-select shows 2.4x improvement (0.05ms vs 0.12ms), while write-heavy operations demonstrate 7.6x better latency. TidesDB’s write path is significantly more efficient.
Query Rate (QPS)
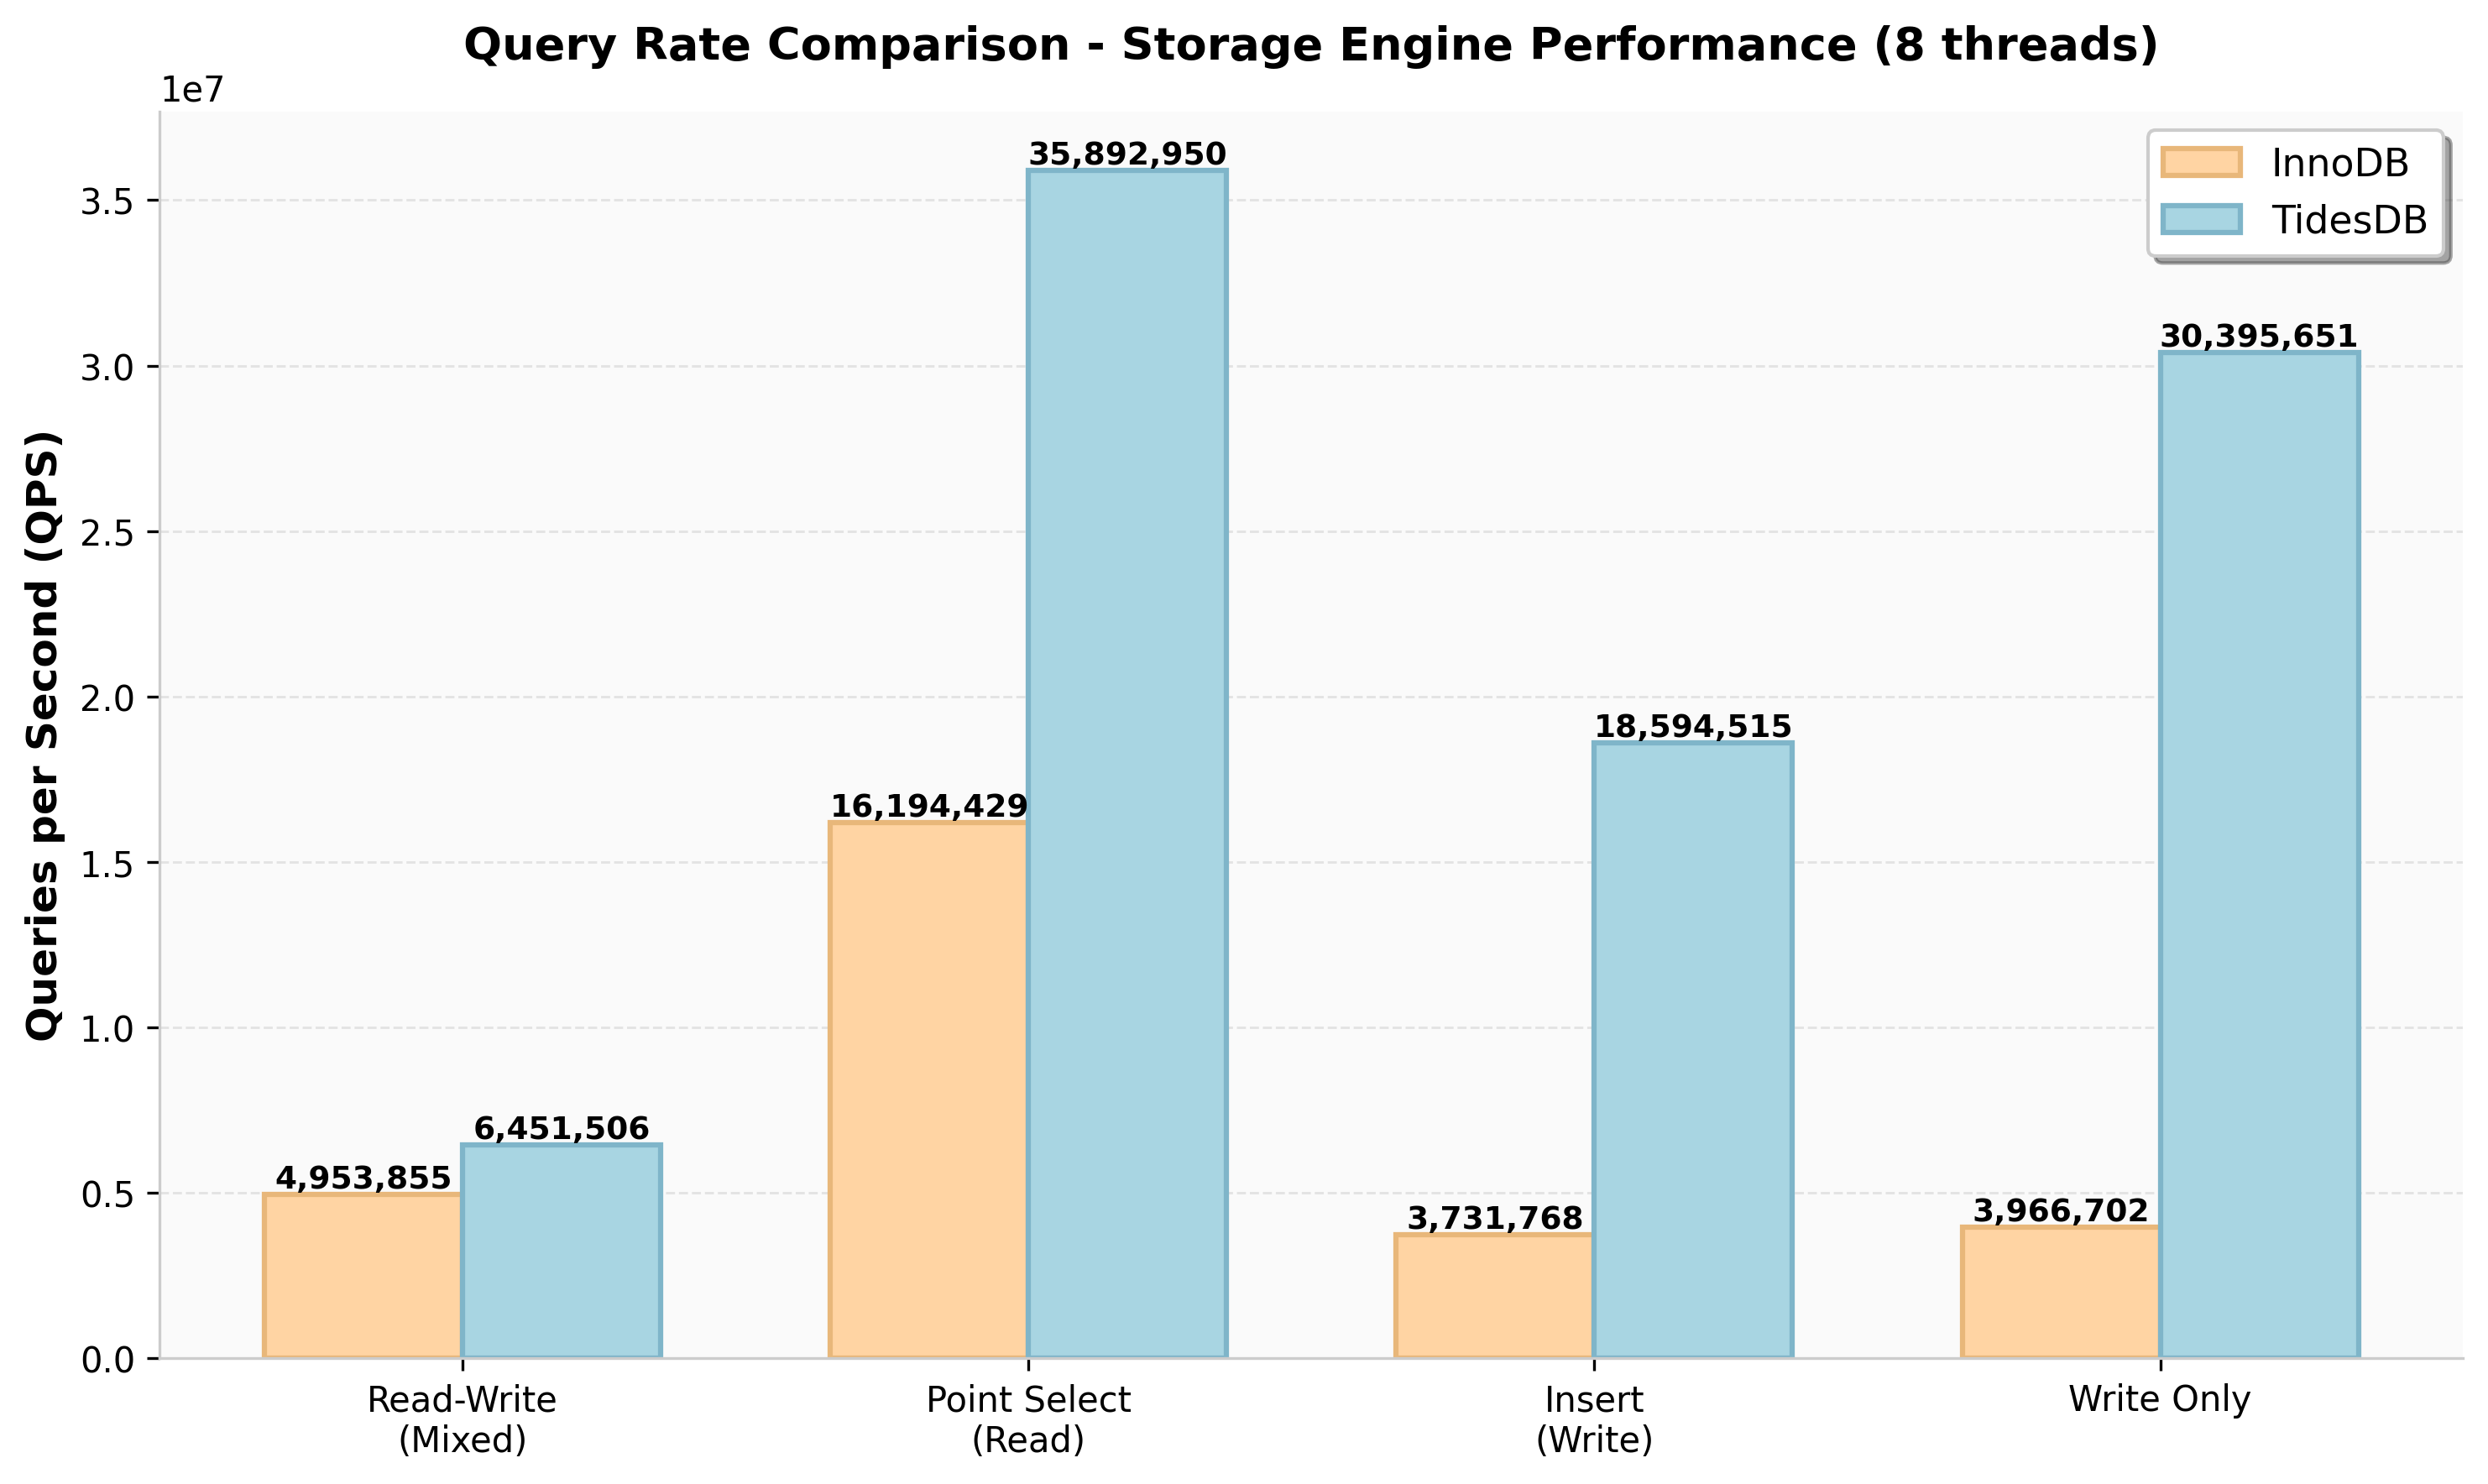
Query throughput mirrors TPS results but highlights the multiplier effect on mixed workloads. Point-select delivers 35.9M QPS vs 16.2M (2.2x), while write-only reaches 30.4M vs 4.0M (7.7x). Analysis shows that TidesDB’s query processing overhead within MariaDB is minimal compared to the B-tree alternative.
95th Percentile Latency
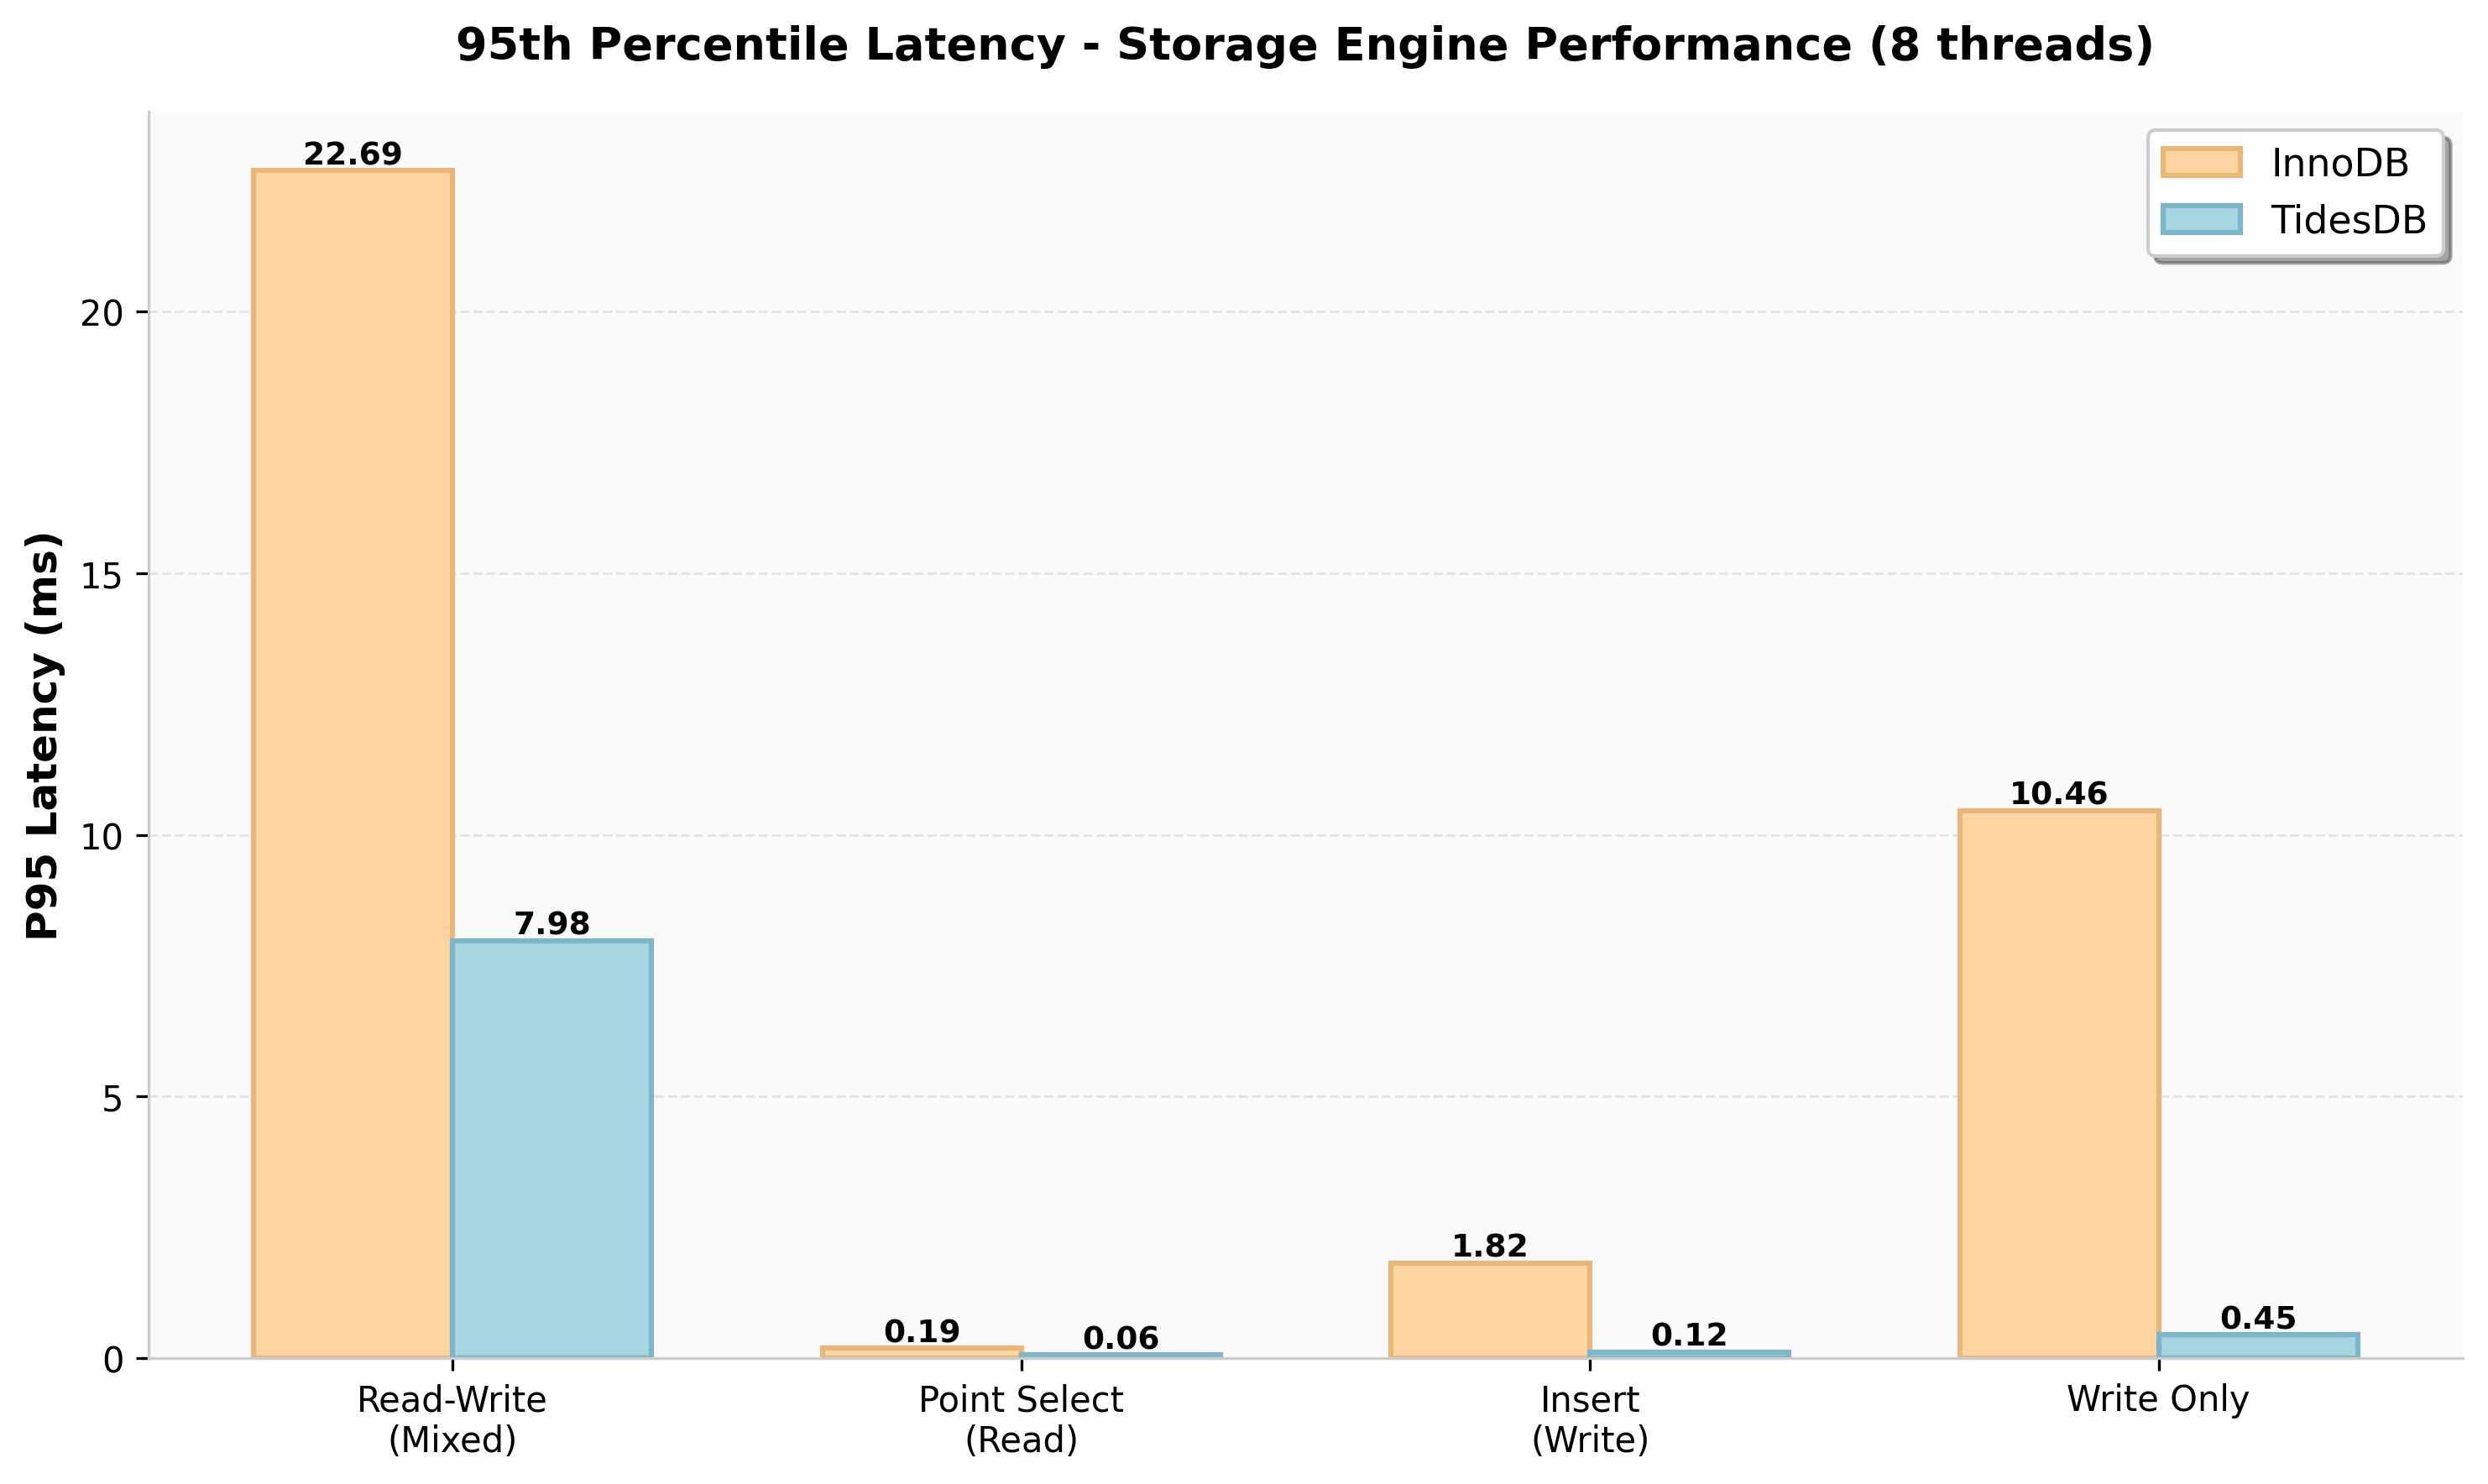
Tail latency reveals TidesDB’s predictability advantage. P95 stays under 8ms across all workloads while InnoDB ranges from 10-23ms. The write-only workload shows a 23.2x improvement (0.45ms vs 10.46ms).
Latency vs Throughput Trade-off
TidesDB shows consistently lower latency with higher throughput across workloads. Point-select clusters in the optimal zone (low latency, high TPS), while write workloads show TidesDB’s ability to maintain sub-millisecond latency at decent throughput.
Thread Scaling
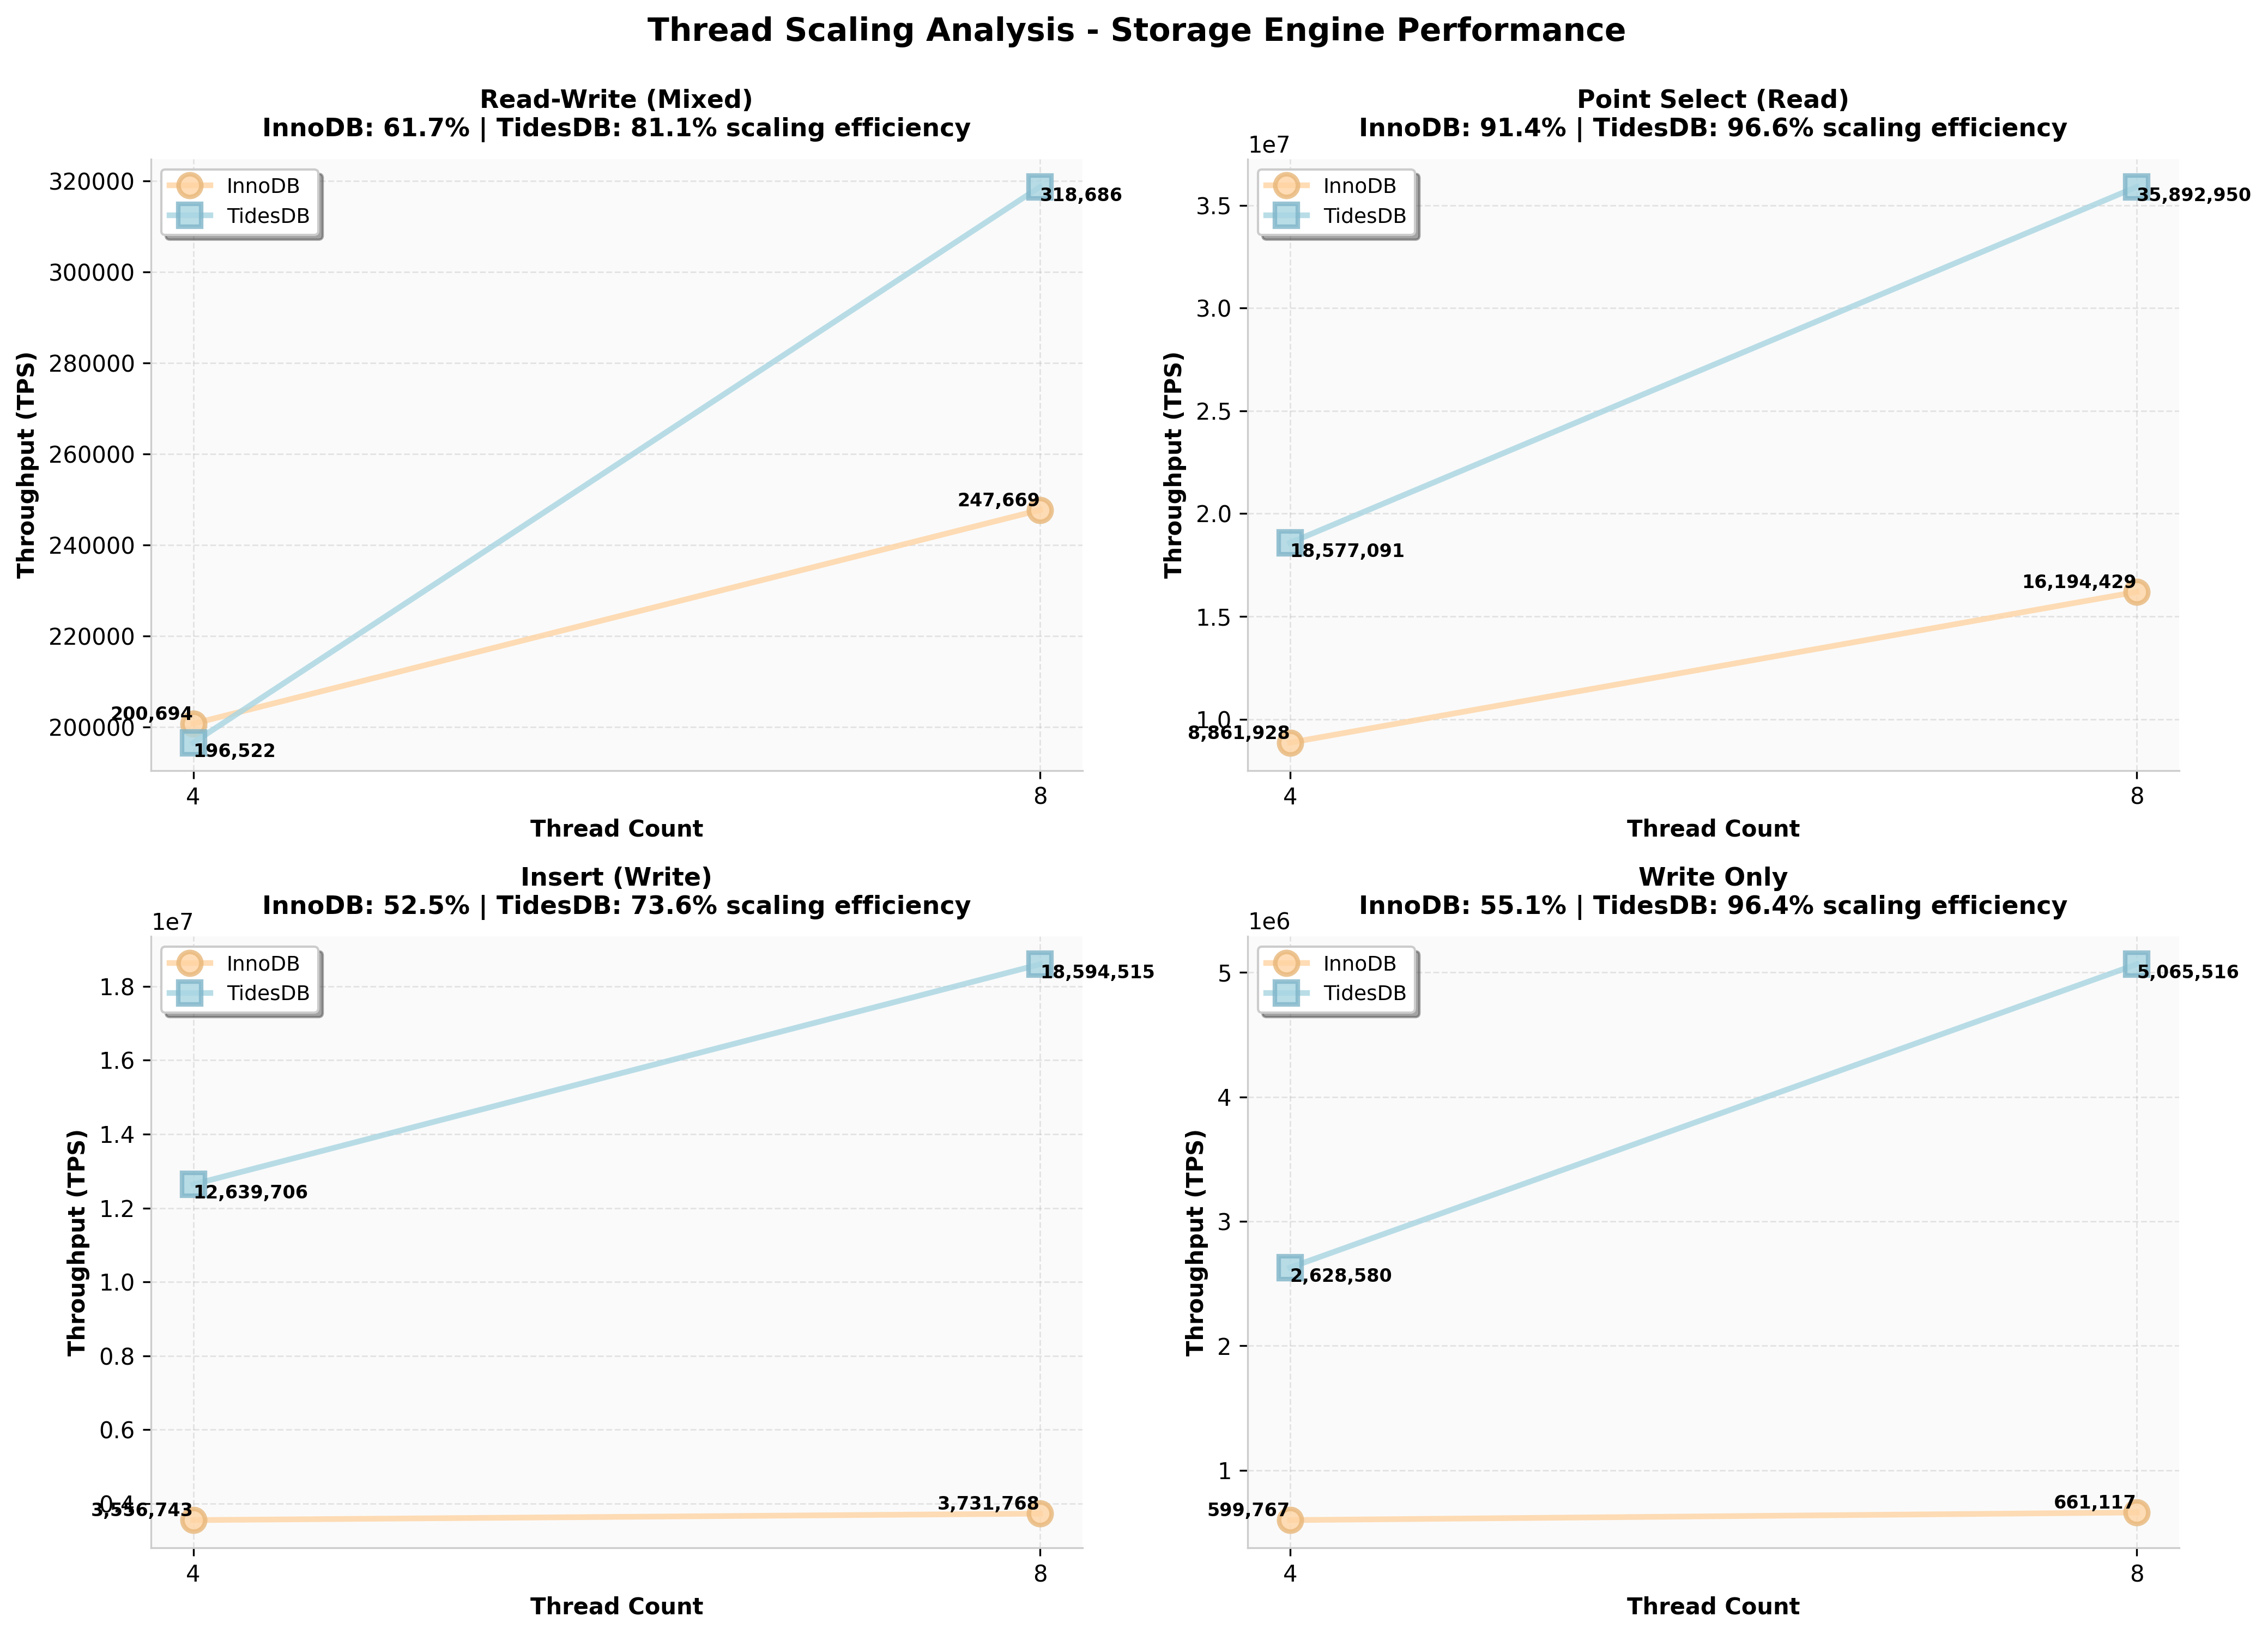
Thread scaling from 4 to 8 shows workload-dependent patterns. TidesDB achieves 62% efficiency on read-write and near-linear (93%) on insert, while InnoDB shows weaker scaling (23-52%). Point-select hits scaling limits for both engines (54-55%), likely due to contention or memory bandwidth saturation but this could be transient.
Overall, the plugin is shaping up really well, and I’m excited to conduct further benchmarks. The dedicated Threadripper server for TidesDB isn’t even optimal, which isn’t reflected in these results. If you benchmark against a more modern CPU and environment, you’ll see even greater differences. In a modern, highly optimized environment, TidesDB will deliver excellent throughput and low latency as seen in past benchmarks like see here.
That’s all for now.
Thank you for reading
—
Data:
| File Name | Format | SHA256 Checksum |
|---|---|---|
| detail_20260216_215126.csv | CSV | ca9bc0adf999be76cc1acaad702565f3cd0aa3cc17400e291737e5265b750c07 |
| summary_20260216_215126.csv | CSV | 74e7373c8a5c7a6b7538b2b3fbdcbb2479d741b475e90d520365ffb948c789d0 |