Benchmark Analysis on TidesDB v8.6.0 and RocksDB v10.10.1

published on February 23rd, 2026
In this article I’ll be going over my recent benchmark analysis on the latest minor release of TidesDB v8.6.0.
In the recent patches and this minor, mainly what was focused on was OOM(Out of Memory) proventions, lots of new tests across many internal components now hitting over 13,000 tests every commit, across 15+ platforms, x86, x64. When running very exhaustive benchmarks using TidesDB in TideSQL in MariaDB with many tables I found memory can get quite high as the gradual back pressure mechanisms are largerly column family based, thus I wanted to inter-connect the back pressure mechanisms with the storage engine globally tied to memory usage.
This minor introduces a single max_memory_usage field on the storage-engine-level config (tidesdb_config_t) that caps the engine’s total in-process memory footprint. When the engine opens, it resolves this value against the host’s physical RAM, if you set an explicit byte value it’s used directly (clamped to at least 50% of total RAM so the engine isn’t starved), and if you leave it at zero it defaults to 80% of total RAM.
The existing reaper thread periodically totals up memory across all column families - memtables, queued immutables, bloom filters, block indexes, and caches, and compares it against the resolved limit. The resulting ratio maps to four graduated pressure levels (Normal, Elevated, High, Critical). The engine also periodically checks OS-level free memory as a safety net, overriding to Critical if the host itself is running low.
Every put and delete checks this pressure level before proceeding. At lower pressure the engine injects small delays and triggers proactive flushes to keep things under control. At higher pressure it force-flushes memtables and blocks writes until memory comes back down. The background thread also takes direct action on its side - force-flushing the largest column families and triggering compaction to reclaim bloom filter and index memory. This two-sided approach - writers slowing down while the engine actively sheds memory - means the system self-heals under burst load without operator intervention.
With that, I ran a series of benchmarks on TidesDB v8.6.0 and RocksDB v10.10.1 across multiple workloads on 2 different environments. I use the benchtool using the tidesdb_rocksdb_old.sh and tidesdb_rocksdb.sh runners.
Environment 1
The specs for the environment are
- Intel Core i7-11700K (8 cores, 16 threads) @ 4.9GHz
- 48GB DDR4
- Western Digital 500GB WD Blue 3D NAND Internal PC SSD (SATA)
- Ubuntu 23.04 x86_64 6.2.0-39-generic
- GCC (glibc)
Benchmark Results Files
| File | SHA256 Checksum |
|---|---|
| tidesdb_rocksdb_benchmark_results_20260222_214833.csv | 62d15fd5935b974d211ca91fc3586b888f68df1a6389a1d3e5f090fd6ba0aee5 |
| tidesdb_rocksdb_benchmark_results_20260222_214833.txt | 9d9e524f4ef52b397a541b64faf3fdbb9a3f7aa1f7ad75292d219805db6ecc48 |
| tidesdb_rocksdb_benchmark_results_20260222_215604.csv | 1ef69ee46e82b8445a3650910bb330be7db3d66c7898b7e83942fac7deca1566 |
| tidesdb_rocksdb_benchmark_results_20260222_215604.txt | d59ac55e840f4d23b992add7252dd97b5b803246544d5ac7aa980af8deba7bc4 |
| tidesdb_rocksdb_benchmark_results_20260223_022800.csv | 751fa68816c678c009597ca91390a0f0adf900c96dd65bb4fc81042af549dd6b |
| tidesdb_rocksdb_benchmark_results_20260223_022800.txt | aaa6ae1331c78020f13d7018b604f61be261fa0e9031d1b32ec61856e8c2ef73 |
| tidesdb_rocksdb_benchmark_results_20260223_023559.csv | 5f0f30faa7db0bae367b911a72c65c9d553999f0cdb3e052ff4b85607bdec7eb |
| tidesdb_rocksdb_benchmark_results_20260223_023559.txt | 76842d88667c441d948ef63da4b138146bf08a15ff935cf281e9ad46d6327a5c |
Run
Full standard-scale suite covering sequential, random, and Zipfian writes, random reads, mixed read/write, deletes at various batch sizes, seek and range-scan workloads, batch-size scaling from 1 to 10,000, and value-size sensitivity from 64 B to 4 KB. Everything runs at 8 threads.
Speedup Summary
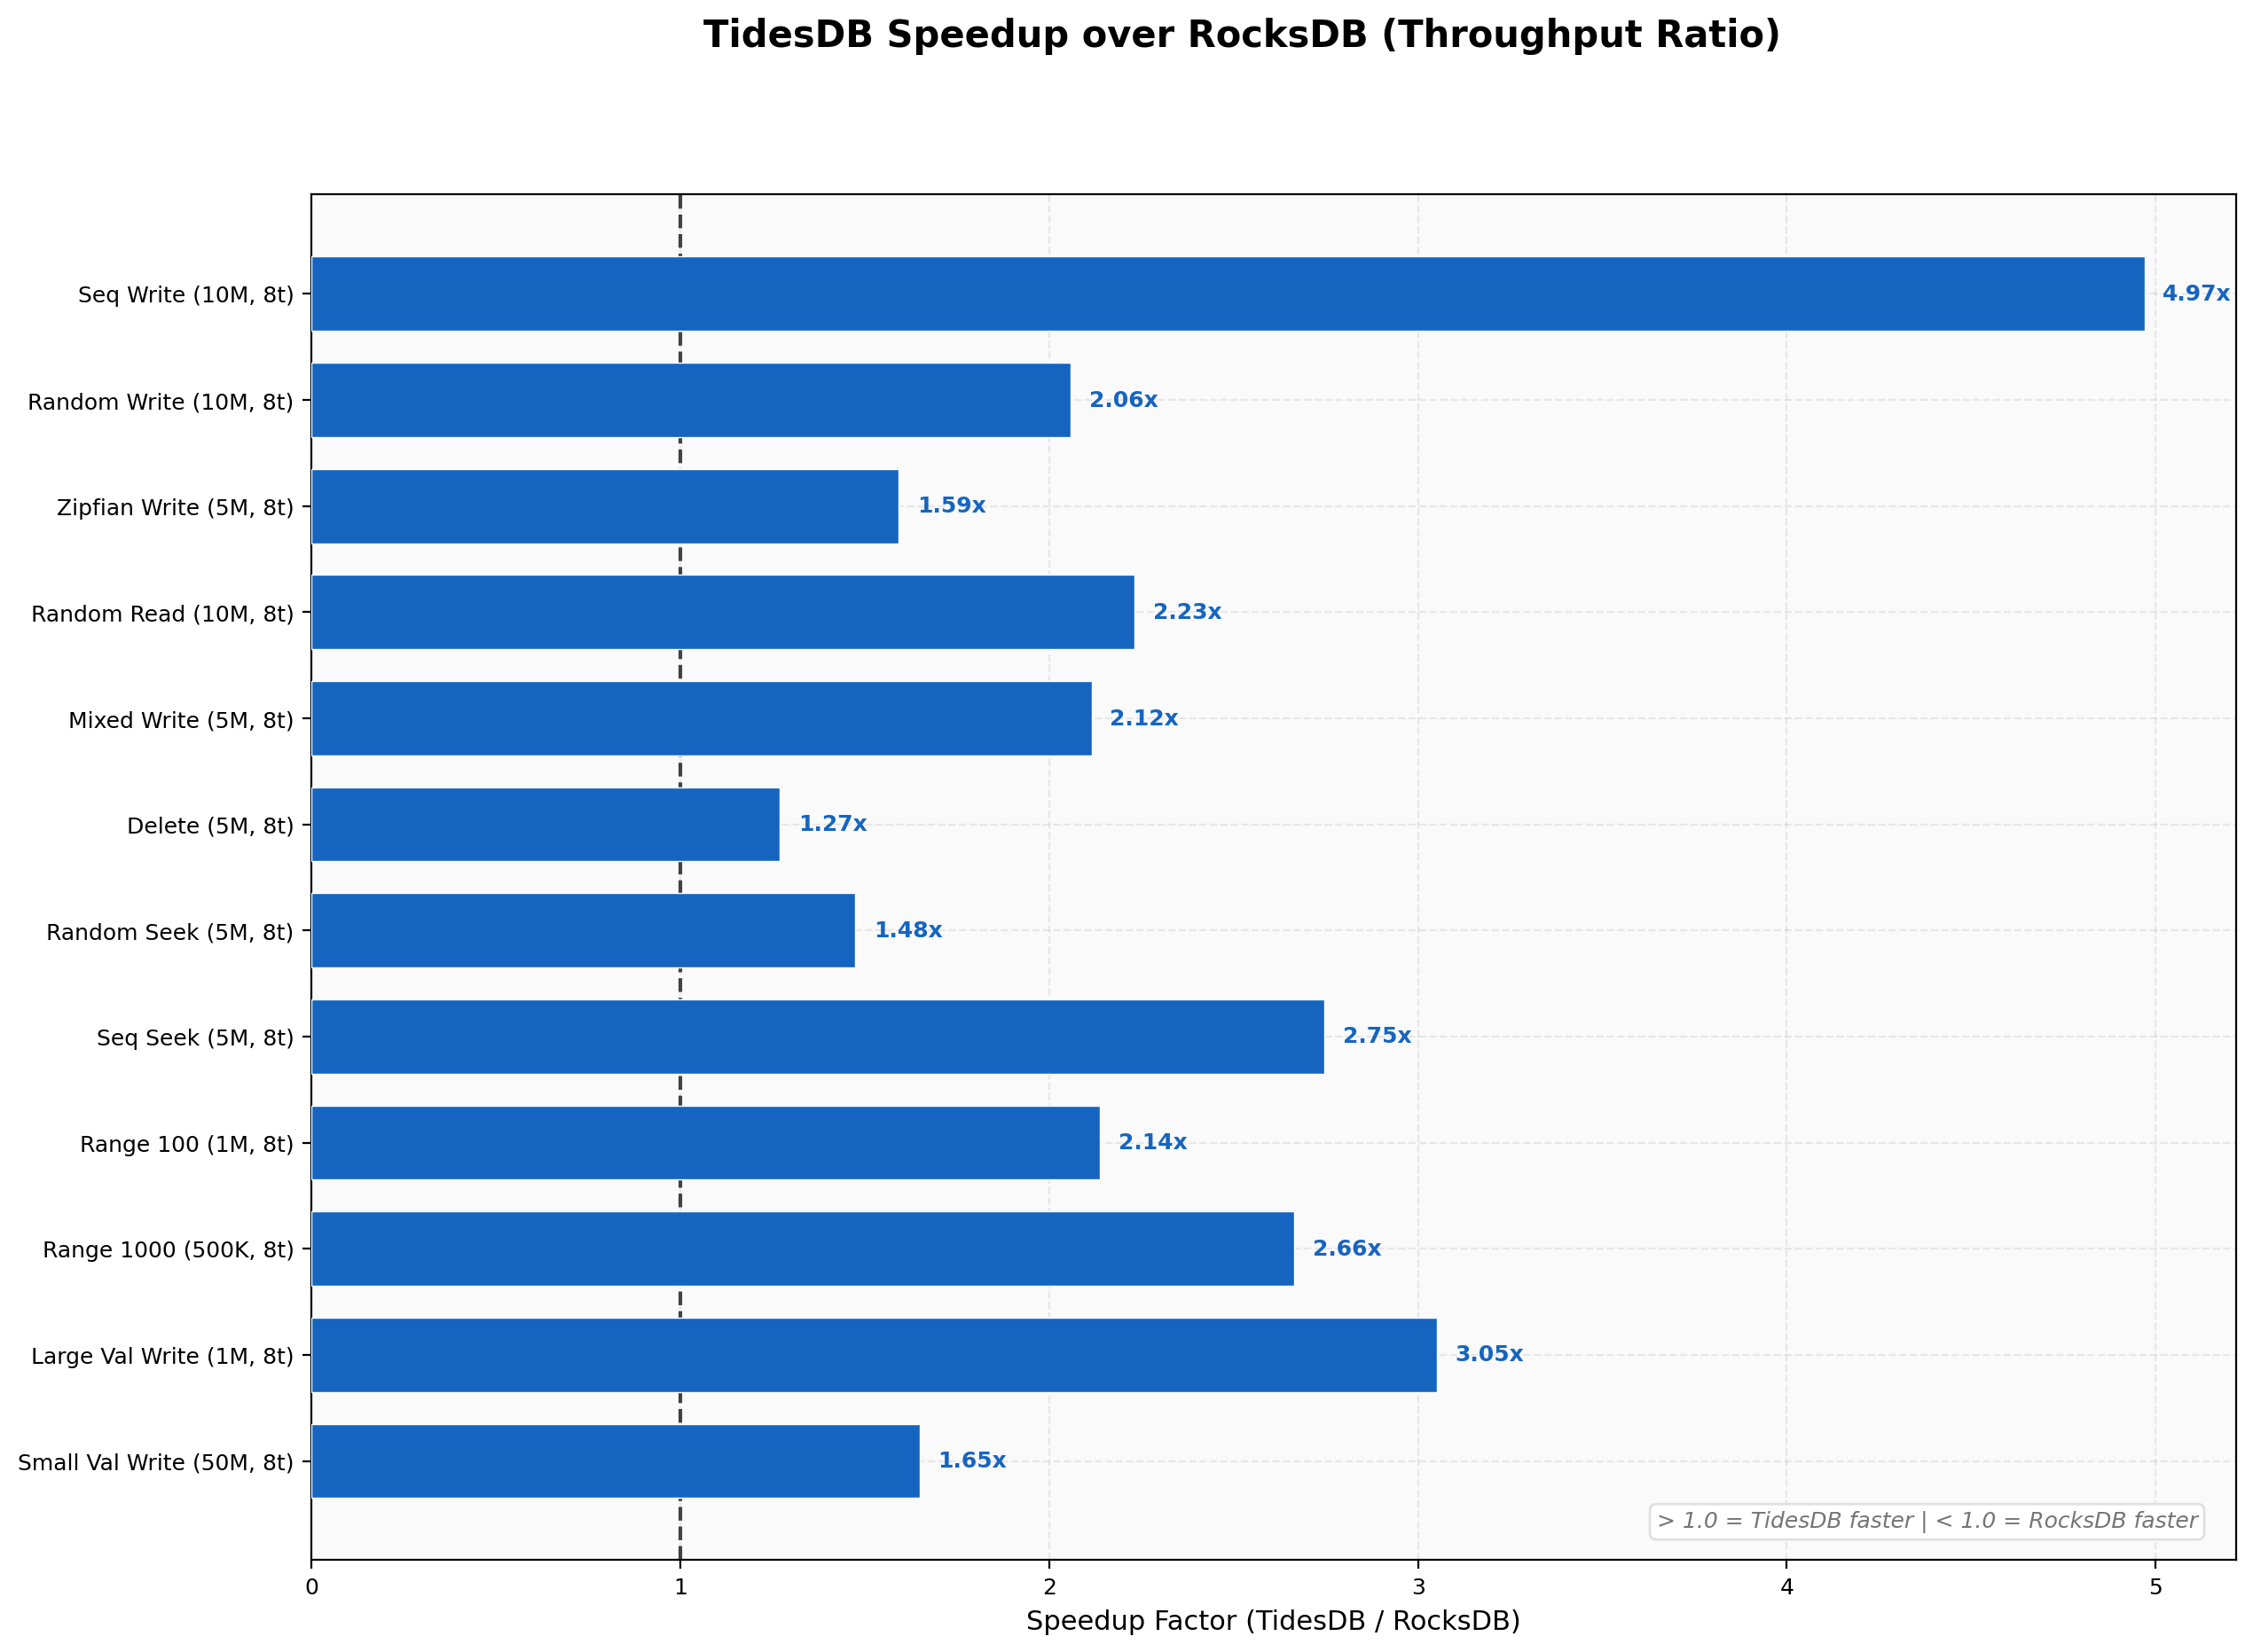
TidesDB is faster than RocksDB on almost every test in this run. Narrowest margin is 1.27x on random deletes, widest is 4.97x on sequential writes, geometric mean across all workloads lands around 2.2x.
Write Throughput
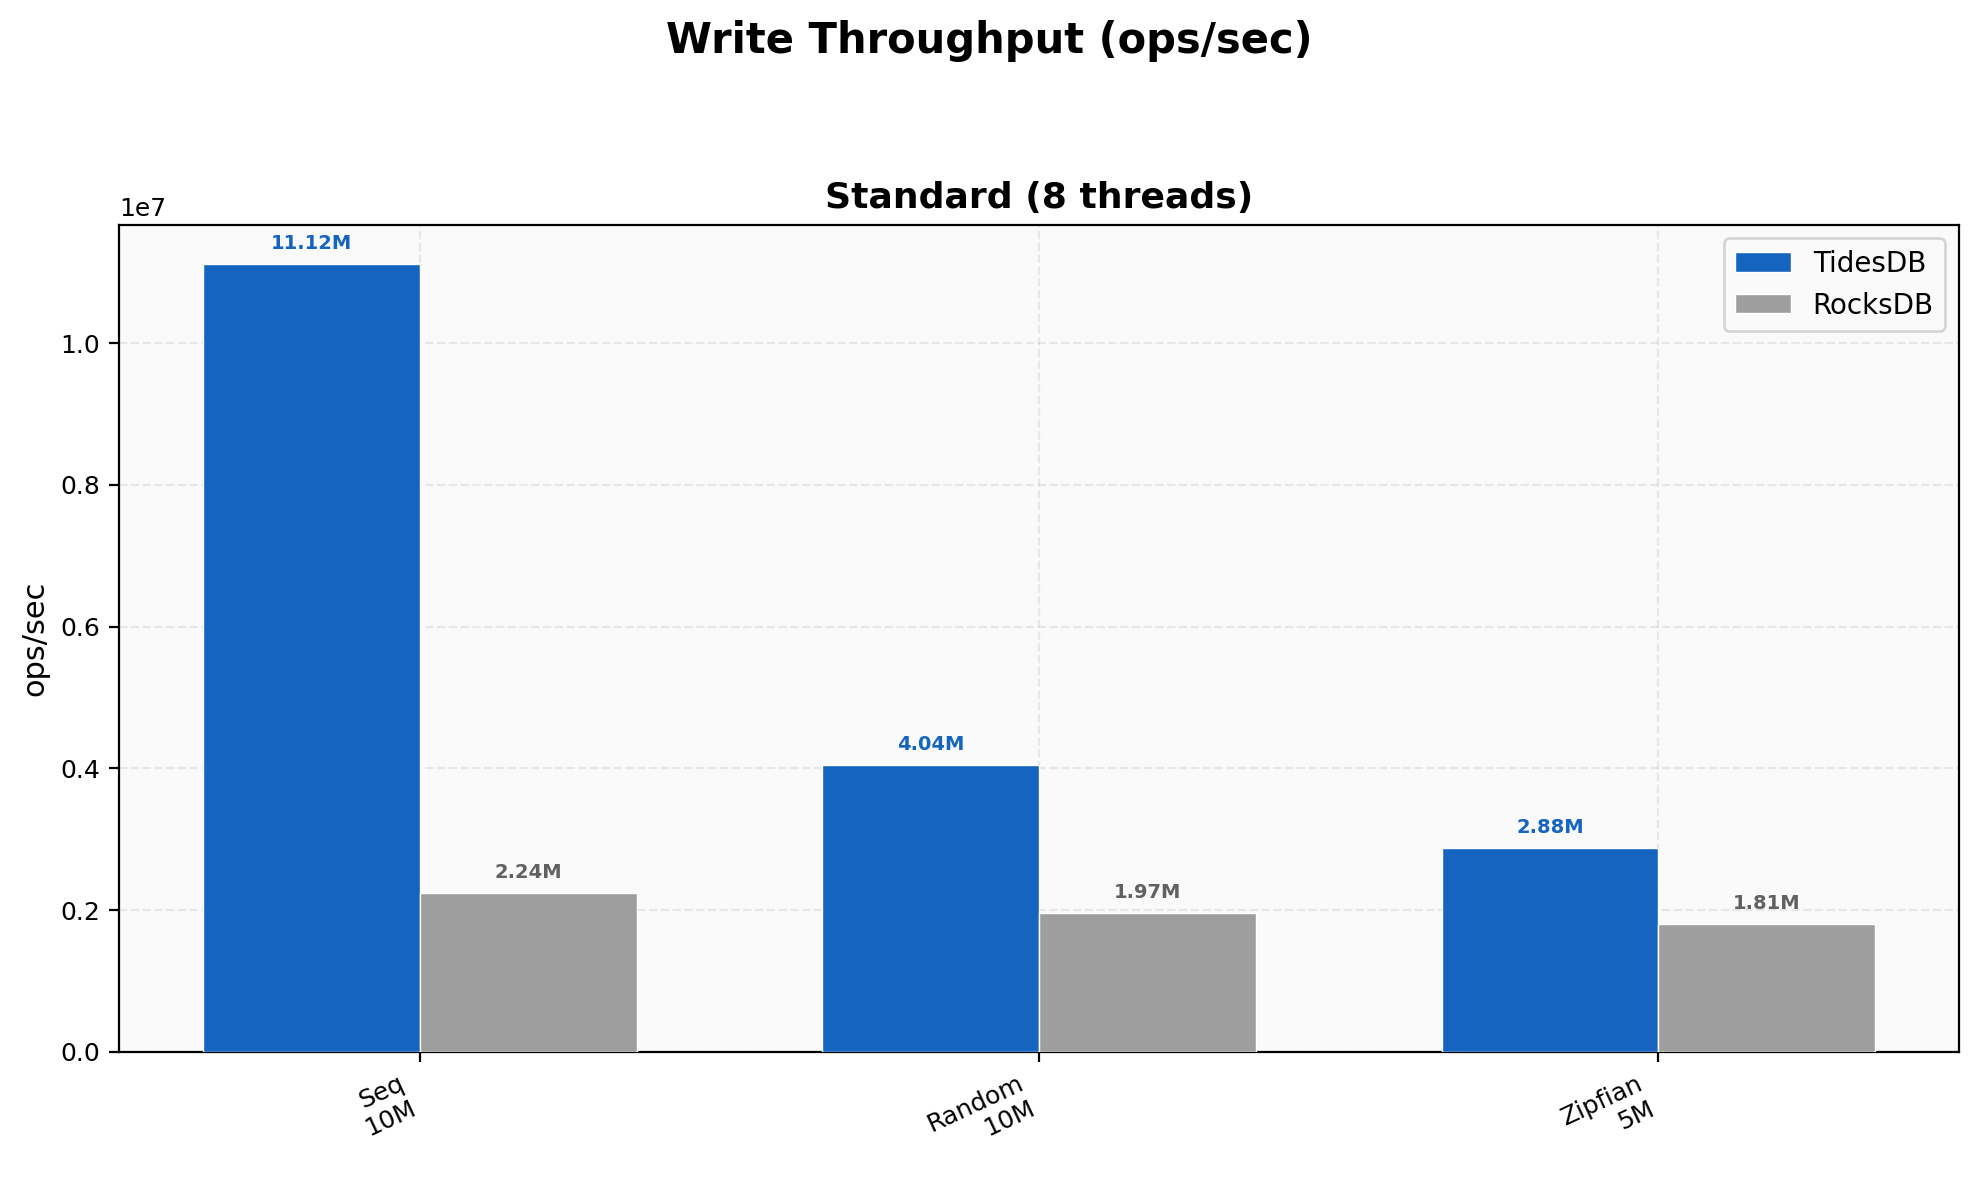
Sequential writes hit 11.12M ops/sec versus RocksDB’s 2.24M (4.97x), where ordered keys let our memtable flush produce perfectly sorted runs with minimal compaction overhead. Random writes narrow to 2.05x (4.04M vs 1.97M) and Zipfian to 1.59x (2.88M vs 1.81M) as key-distribution entropy reduces the advantage.
Read & Mixed Workload Throughput
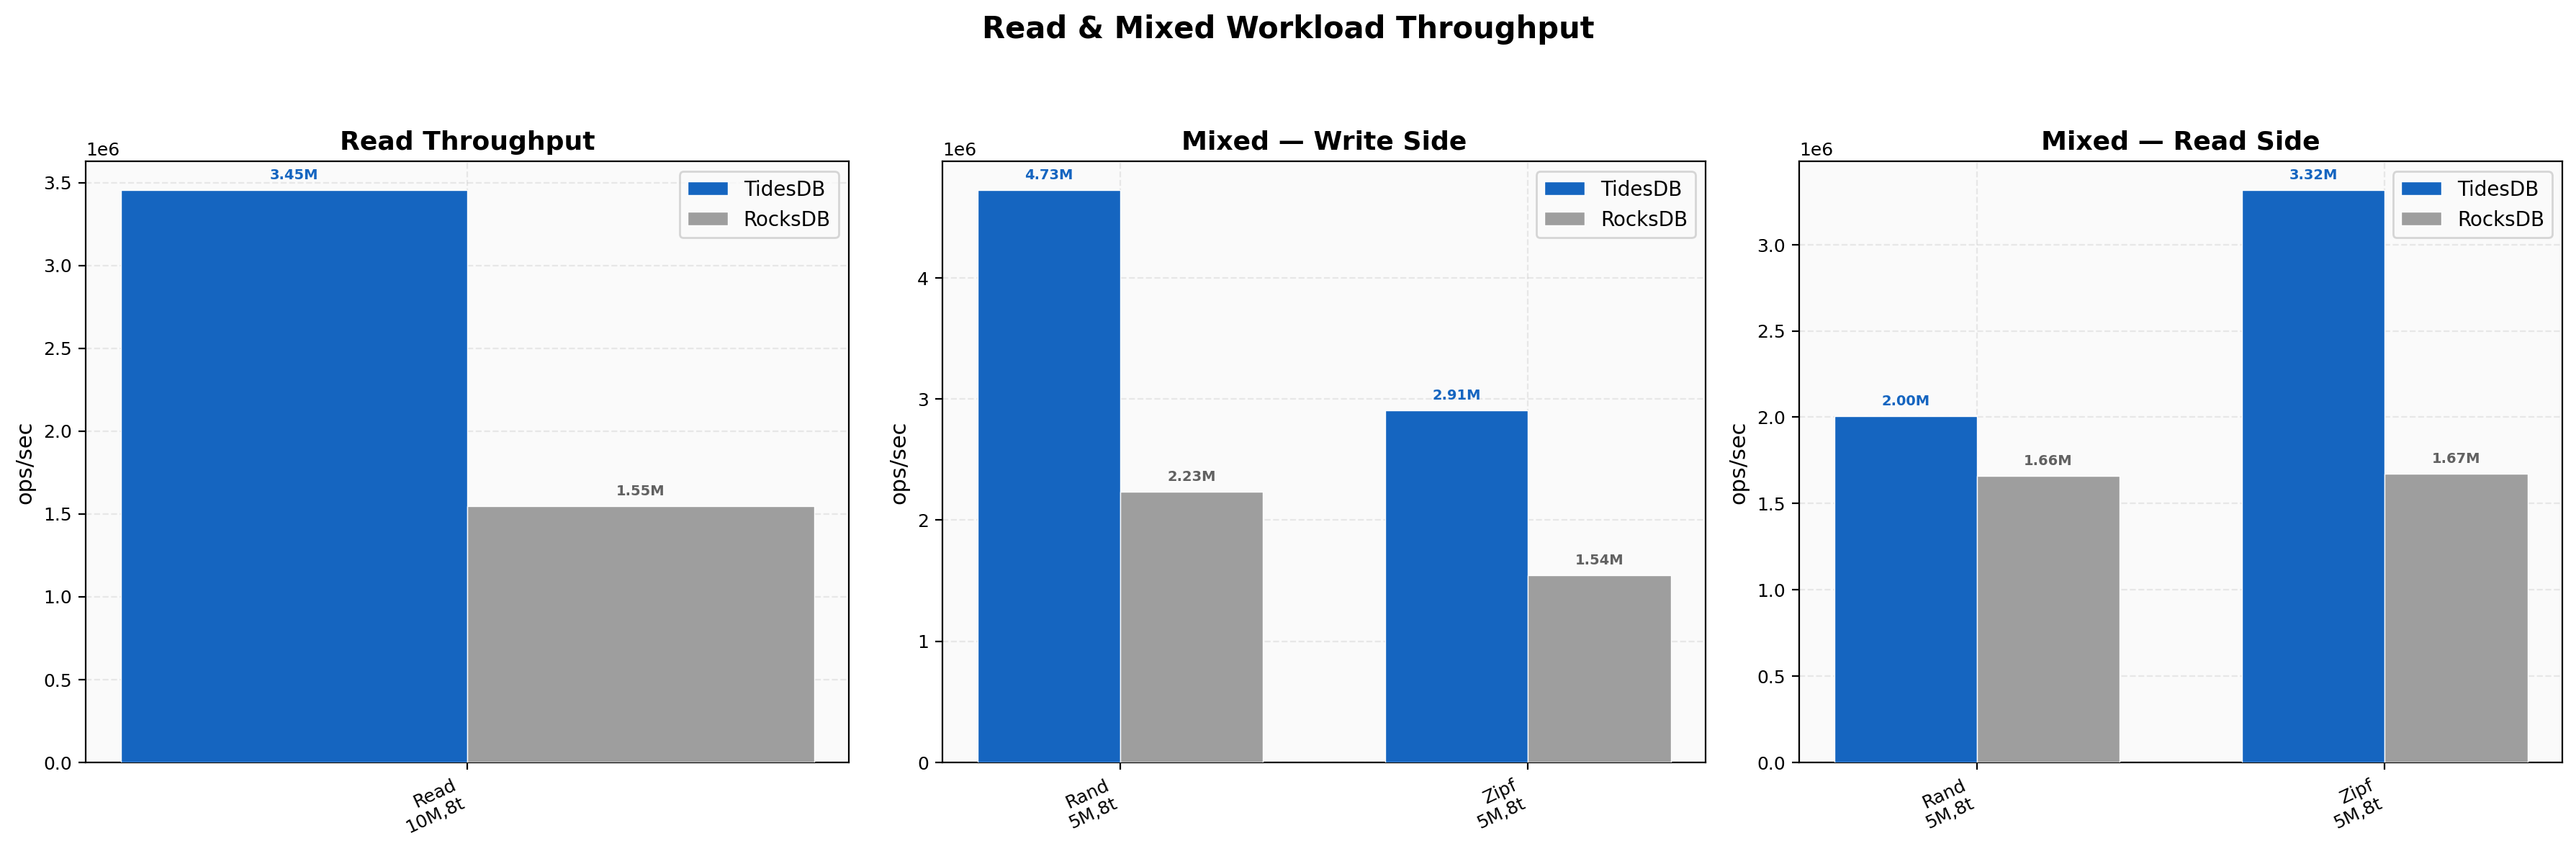
Random reads hit 3.45M vs 1.55M (2.23x) at 2.05 µs average latency. Mixed random PUT side is 4.73M vs 2.23M (2.12x), GET side tighter at 2.00M vs 1.66M (1.21x). Zipfian mixed reads reach 3.32M vs 1.67M (~2x).
Delete Throughput
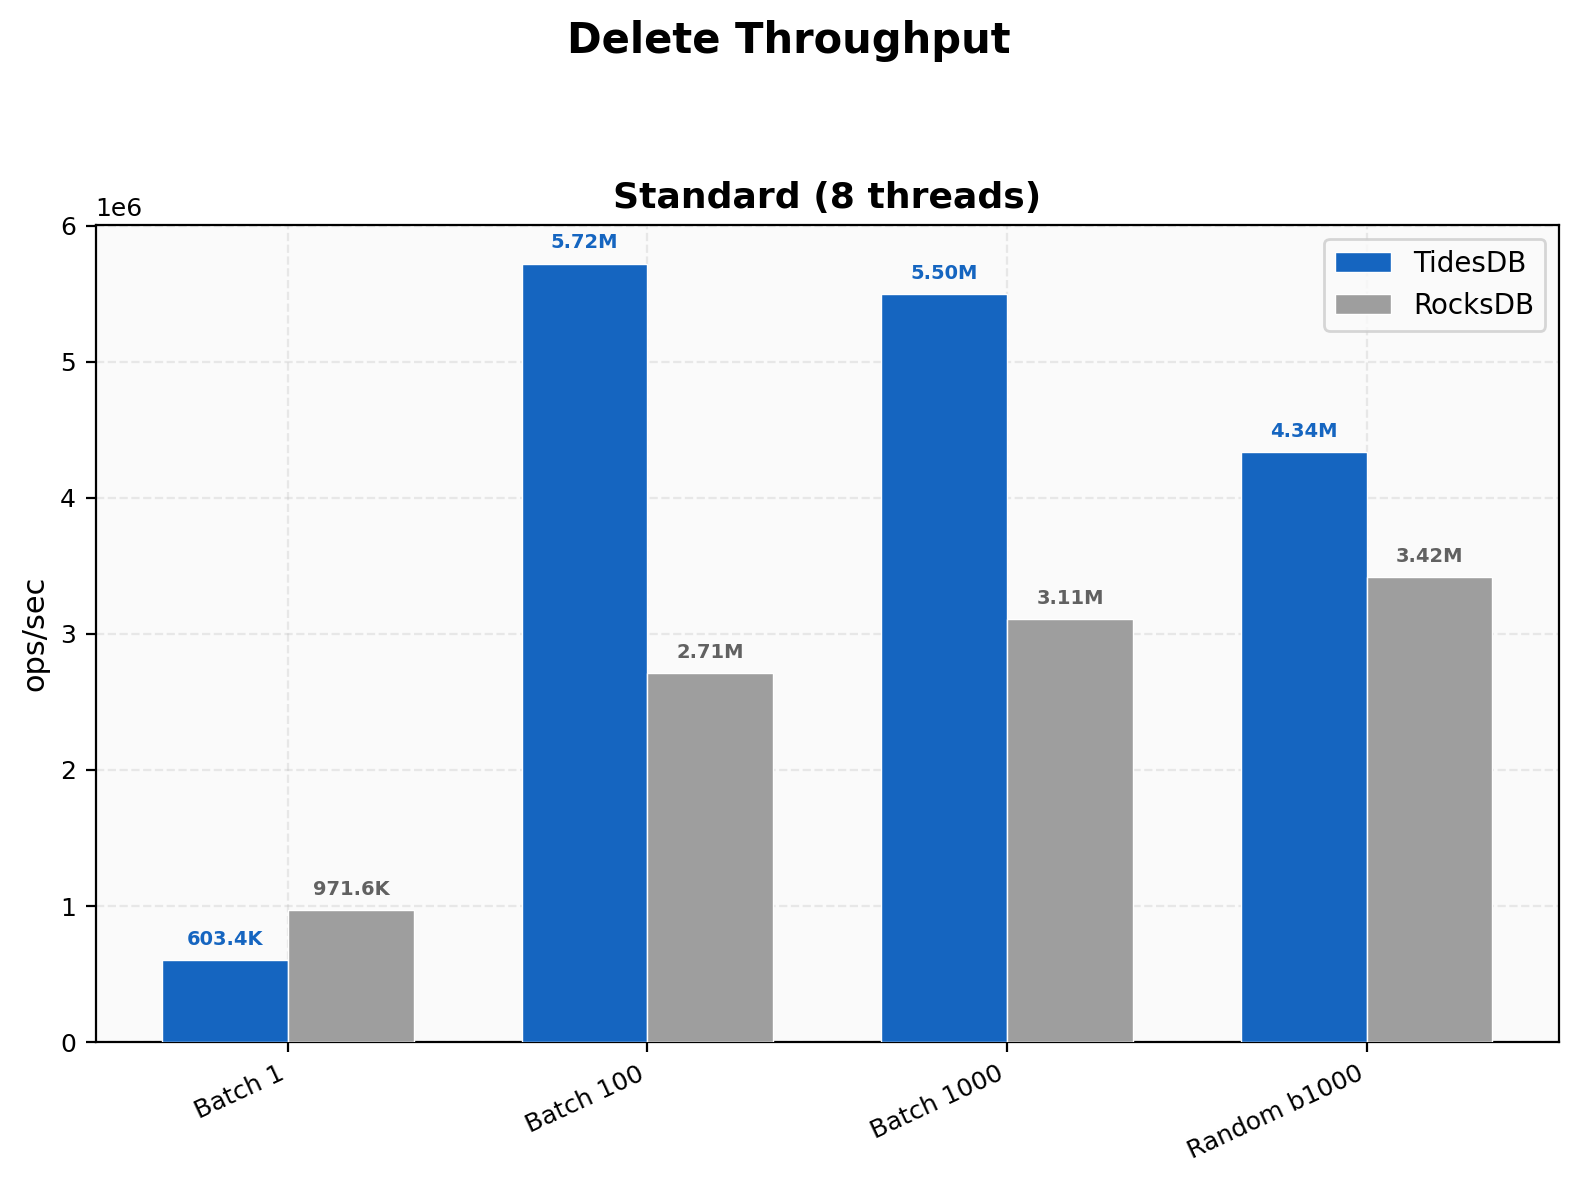
For single-key deletes, RocksDB wins at 971K vs our 603K since their tombstone path is leaner at that granularity. Once batched, the picture flips and batch 100 hits 5.72M vs 2.71M (2.11x), batch 1000 reaches 5.50M vs 3.11M (1.77x).
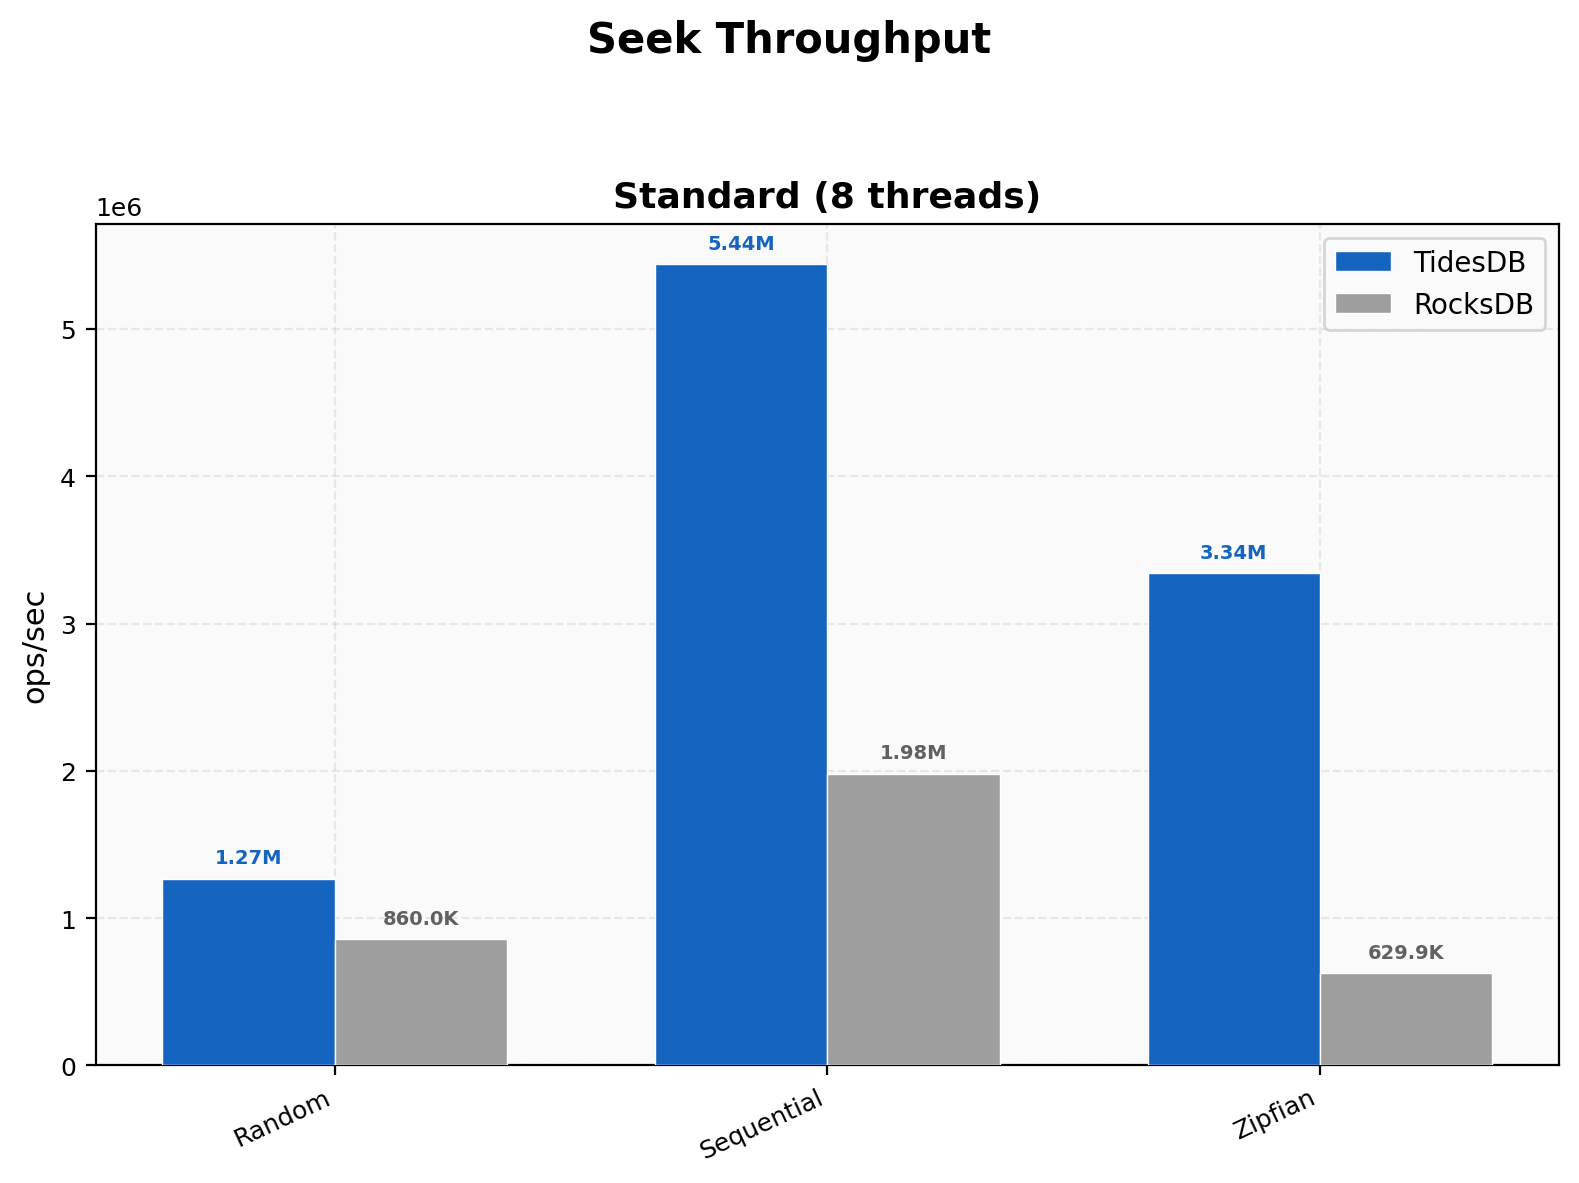
Seek Throughput
Random seeks hit 1.27M vs 860K (1.48x), sequential 5.44M vs 1.98M (2.75x), and Zipfian 3.34M vs 630K (5.31x).
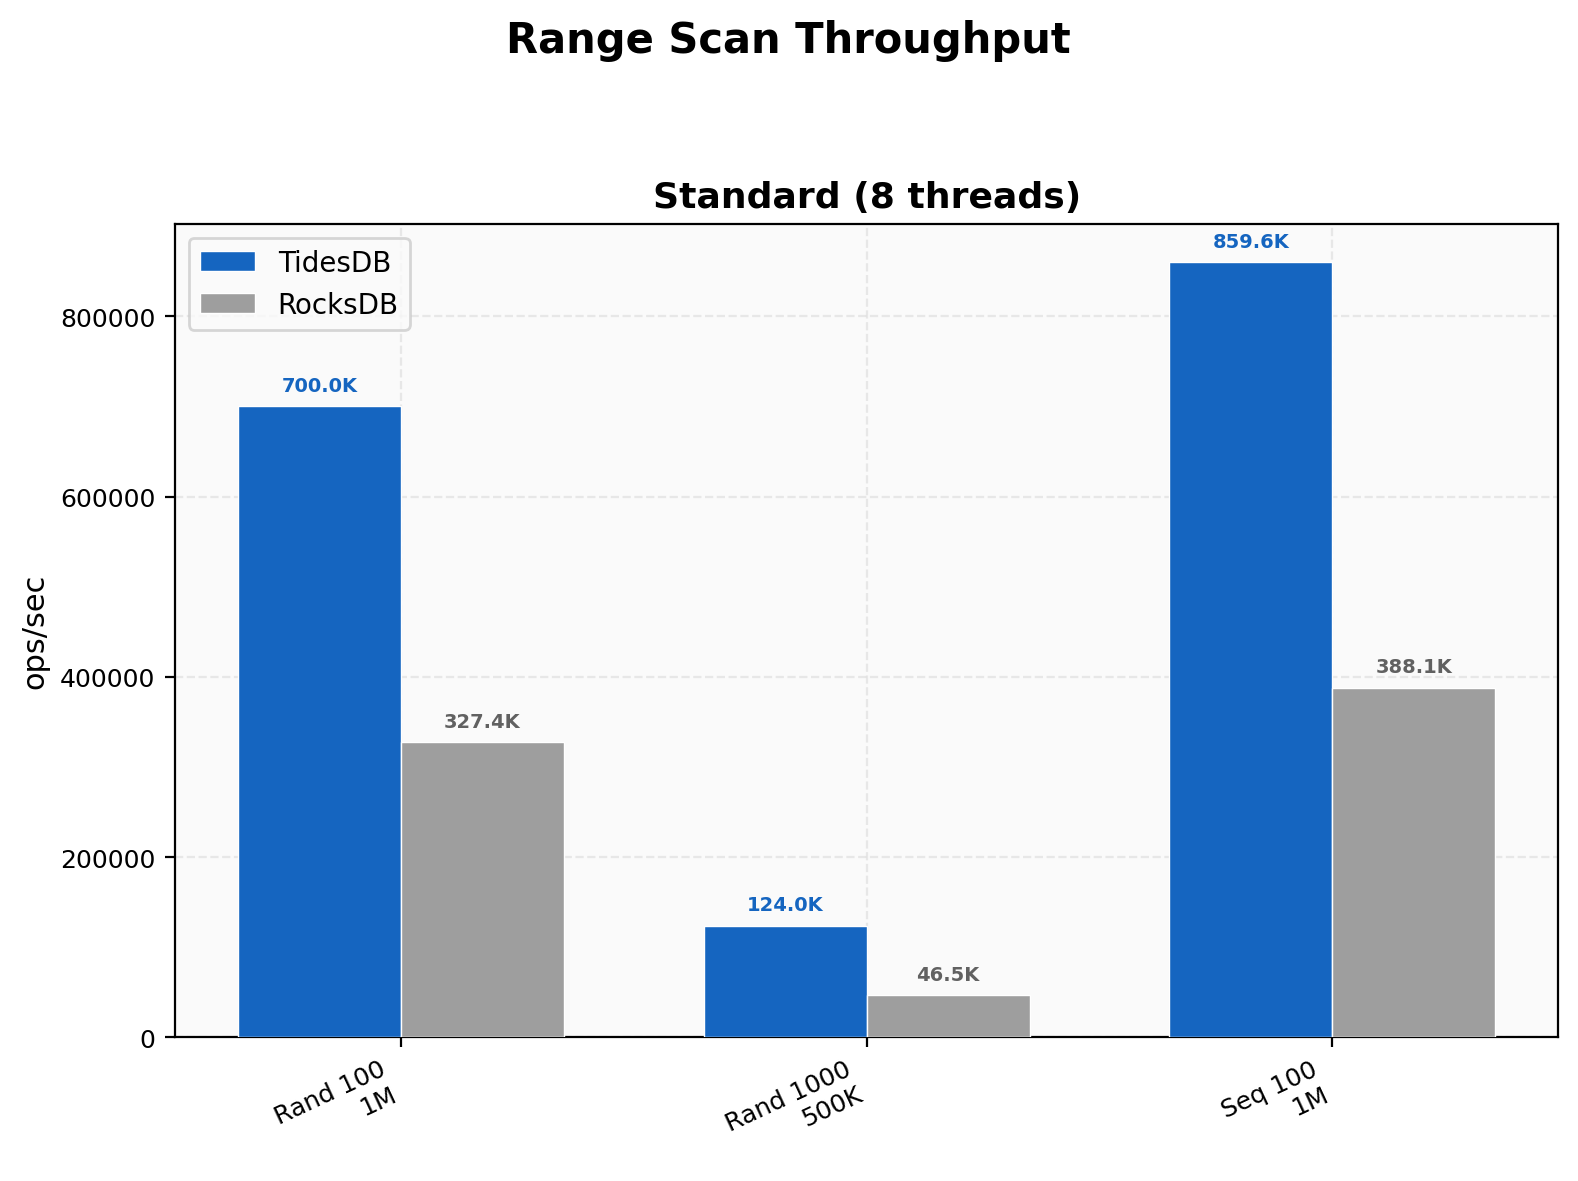
Range Scan Throughput
Random 100-key scans hit 700K vs 327K (2.14x), 1000-key scans 124K vs 46.5K (2.66x), and sequential 100-key 860K vs 388K (2.21x). Wider scans amplify TidesDB’s edge as the initial seek cost gets amortized over more keys per scan.
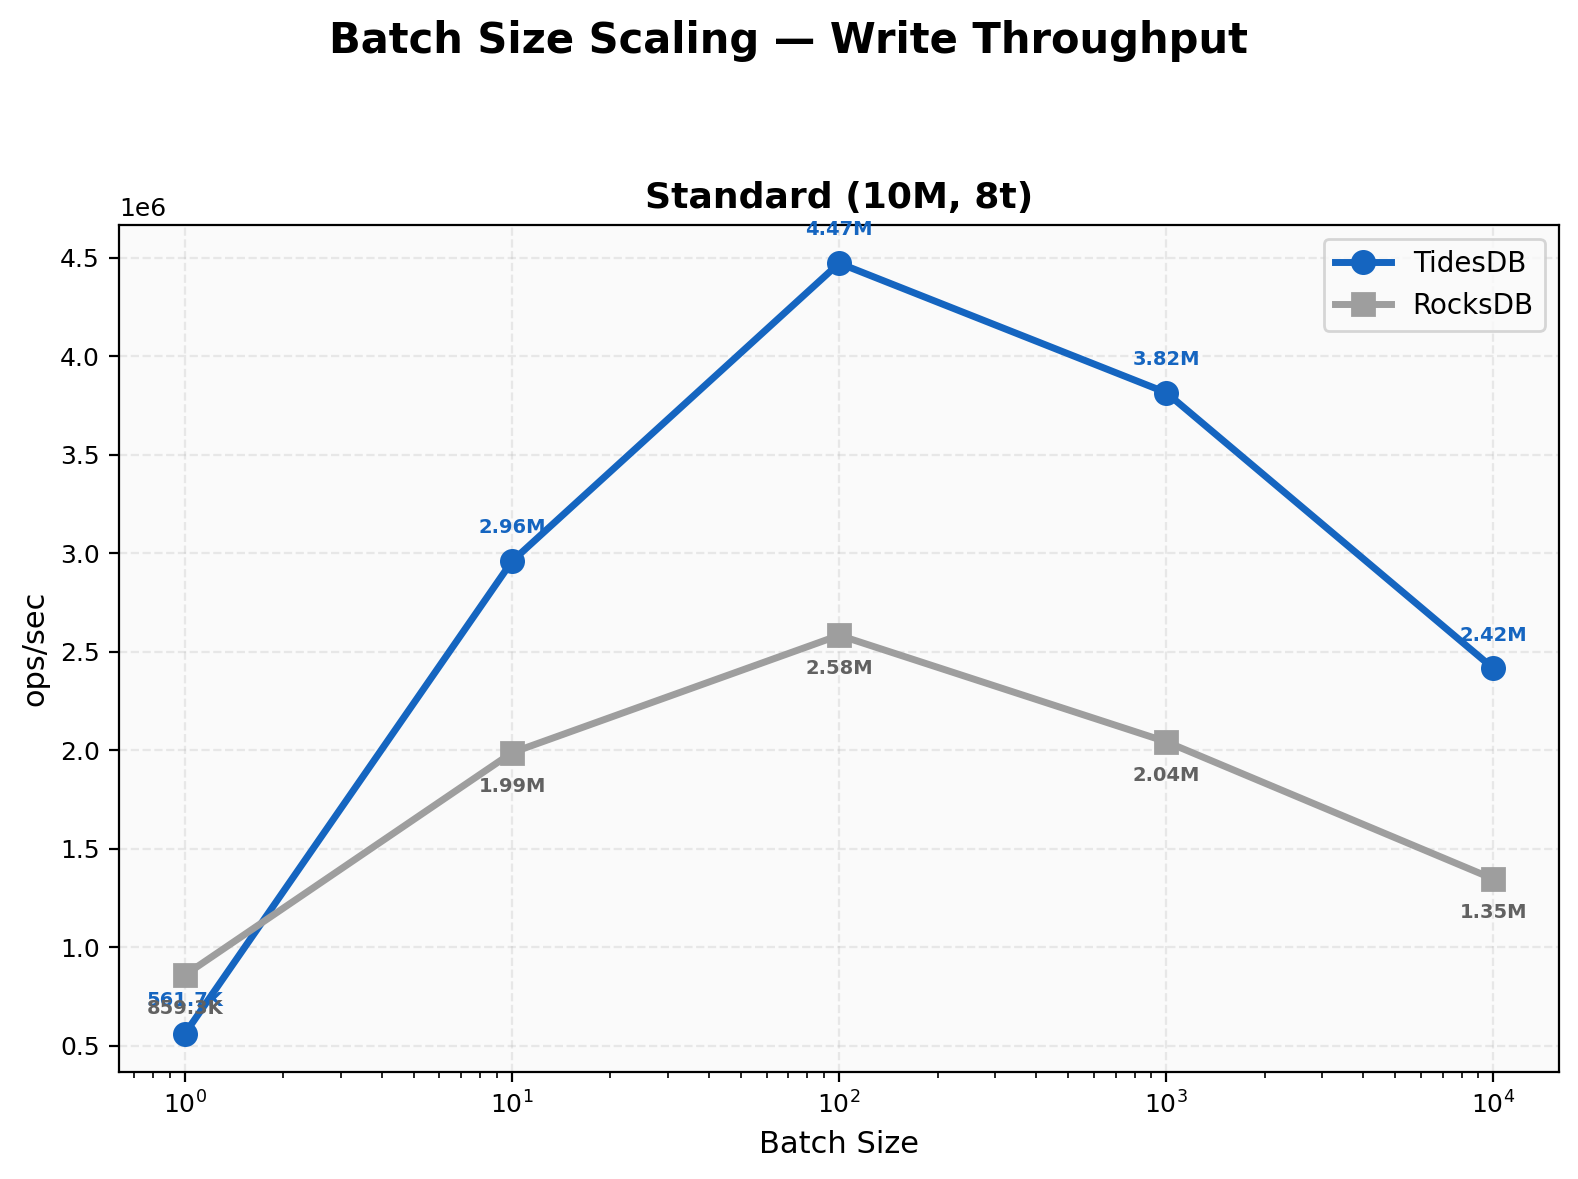
Batch Size Scaling
At batch 1, RocksDB wins at 859K vs 562K (~1.53x). Crossover happens at batch 10 where TidesDB takes the lead at 1.49x. Both peak at batch 100 with TidesDB at 4.47M and RocksDB at 2.58M. TidesDB’s peak-to-trough ratio is 8x versus RocksDB’s 3x, showing we benefit disproportionately from batching.
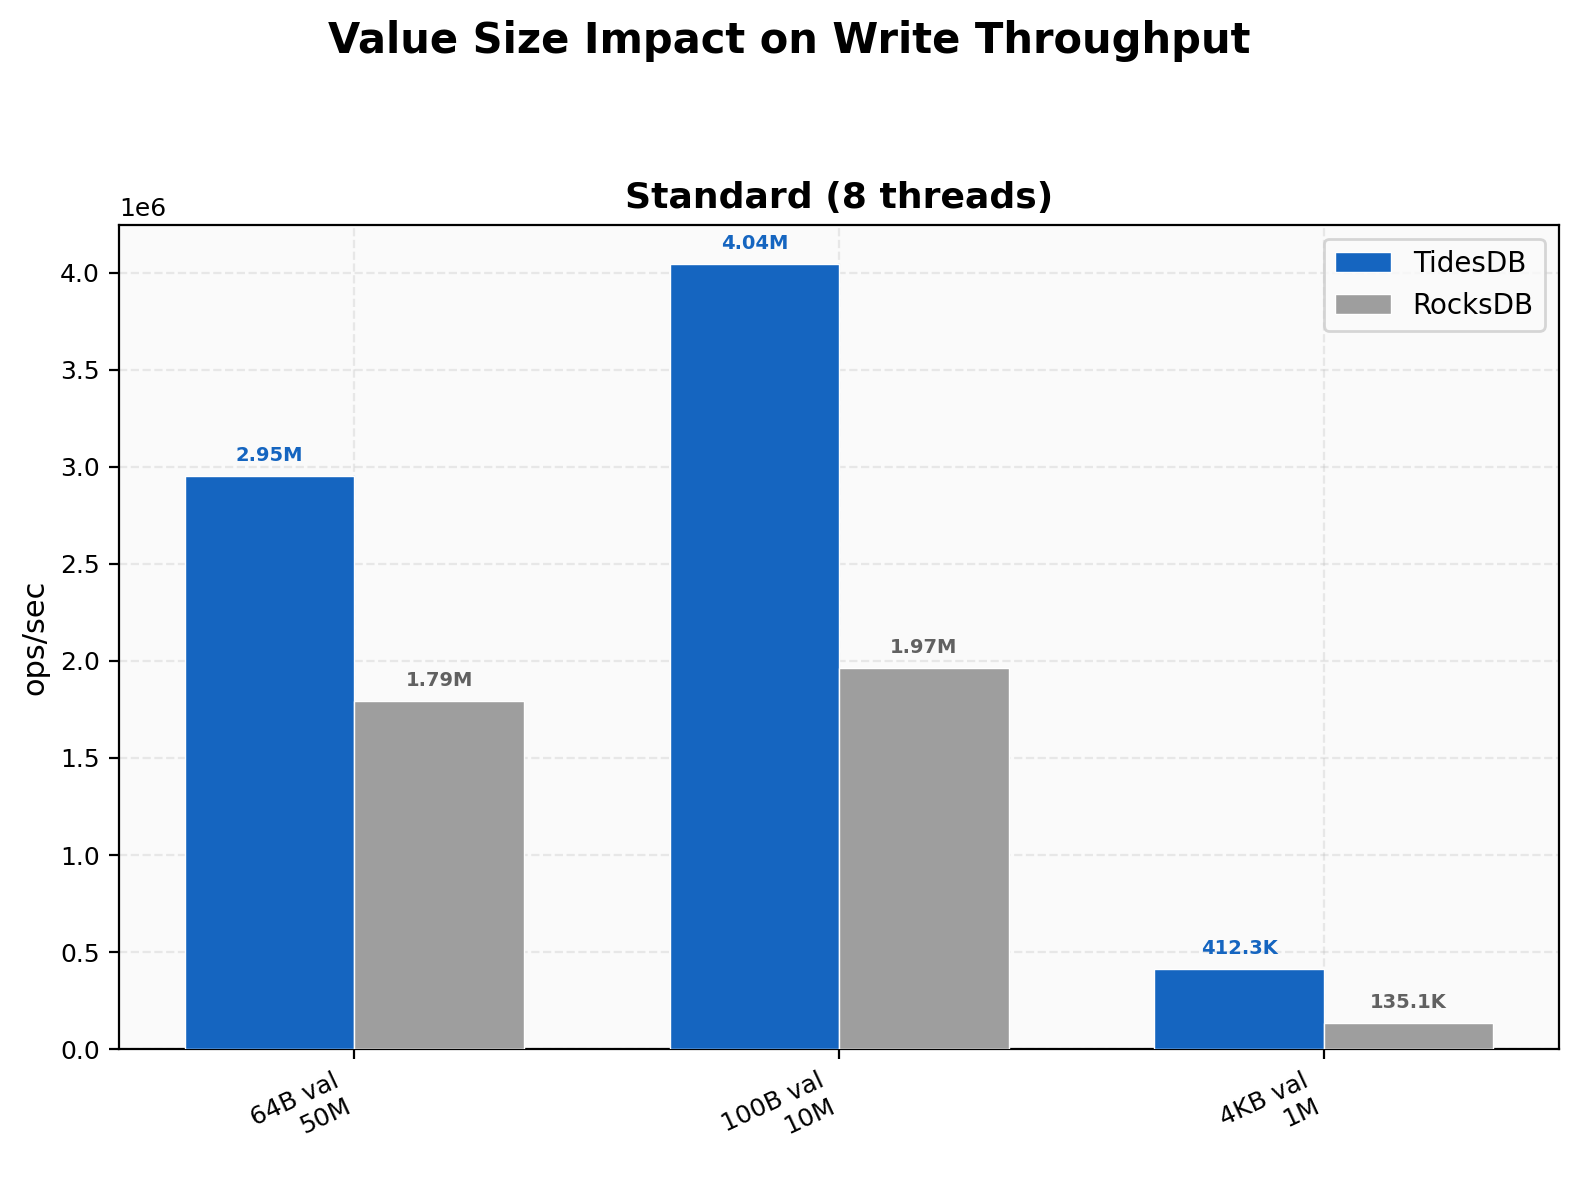
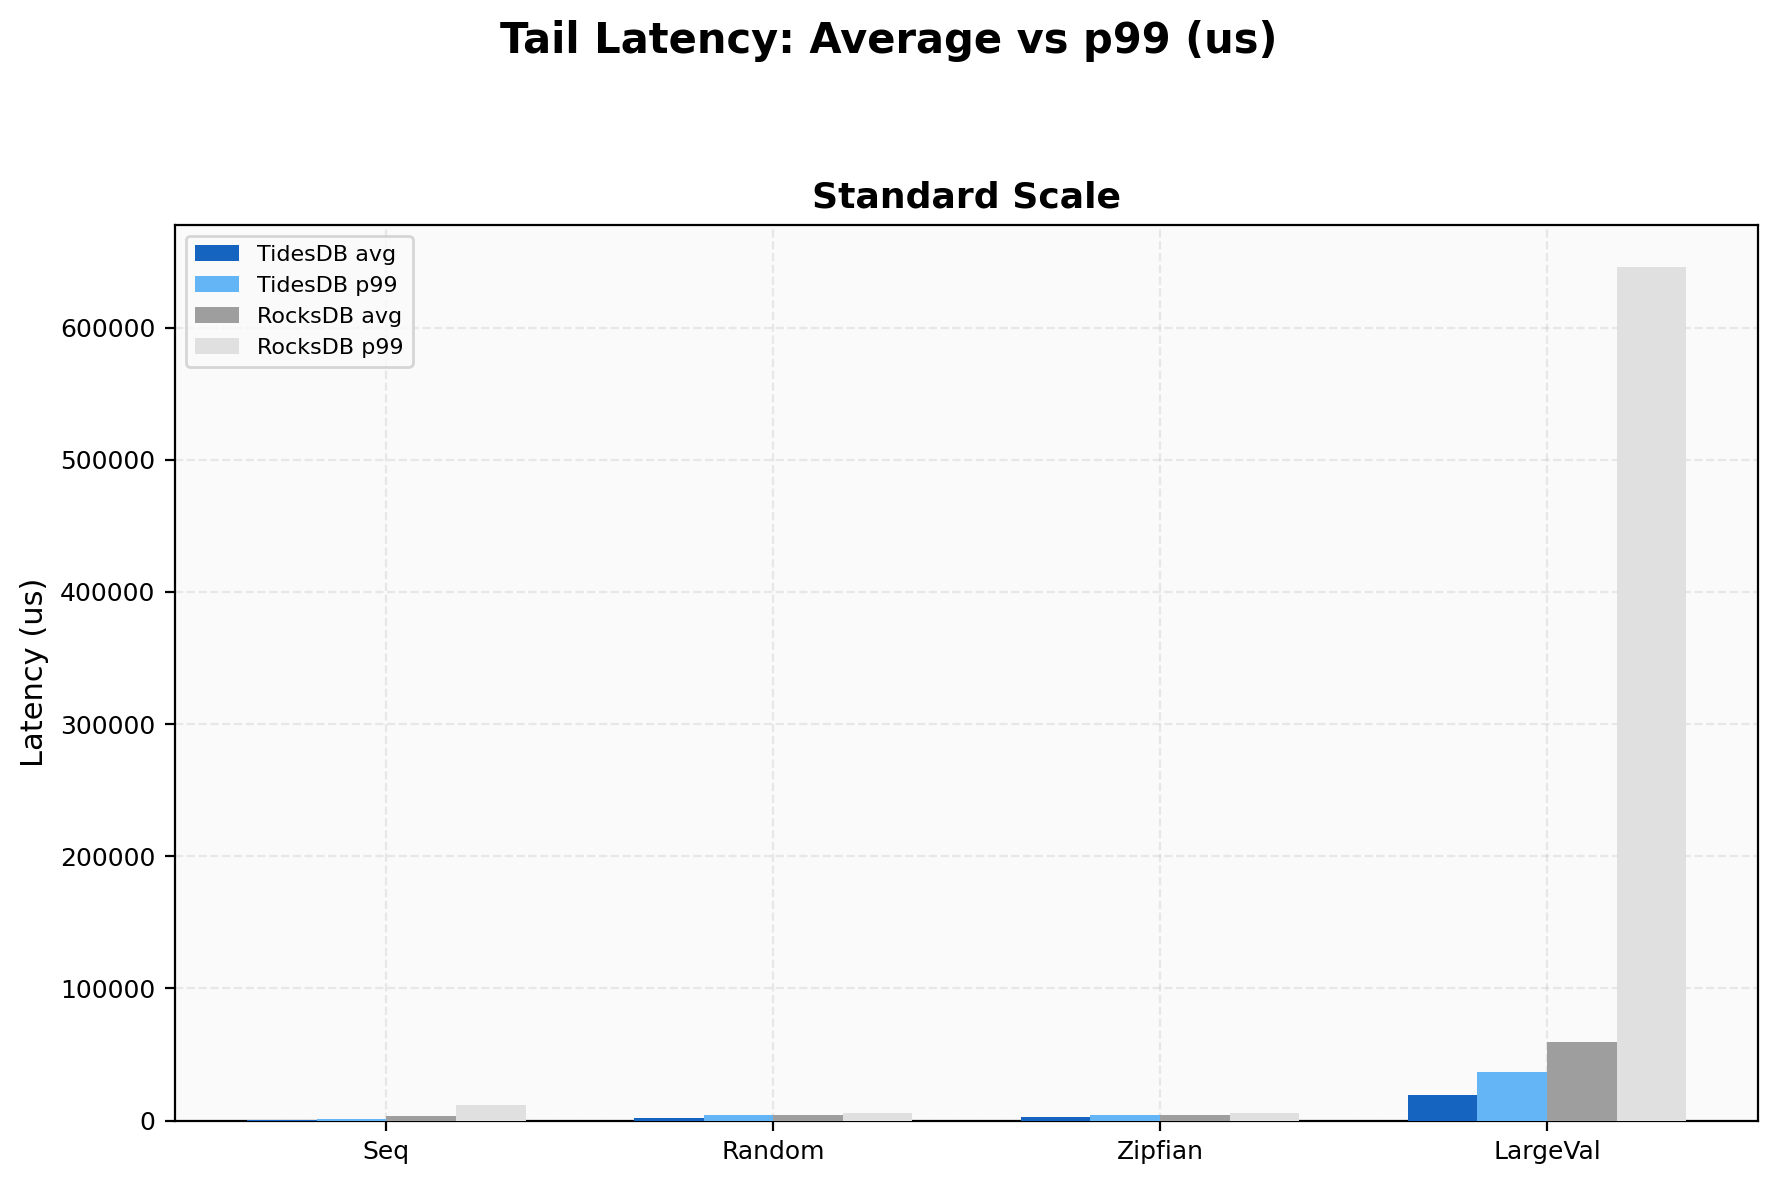
Value Size Impact
TidesDB’s advantage grows with value size, from 1.65x at 64B to 2.06x at 100B to 3.05x at 4KB. At 4KB write amplification is 1.03 vs 1.22, and RocksDB’s p99 spikes to 645,594 µs (over half a second) while ours stays at 36,427 µs. Larger values expose compaction cost differences.
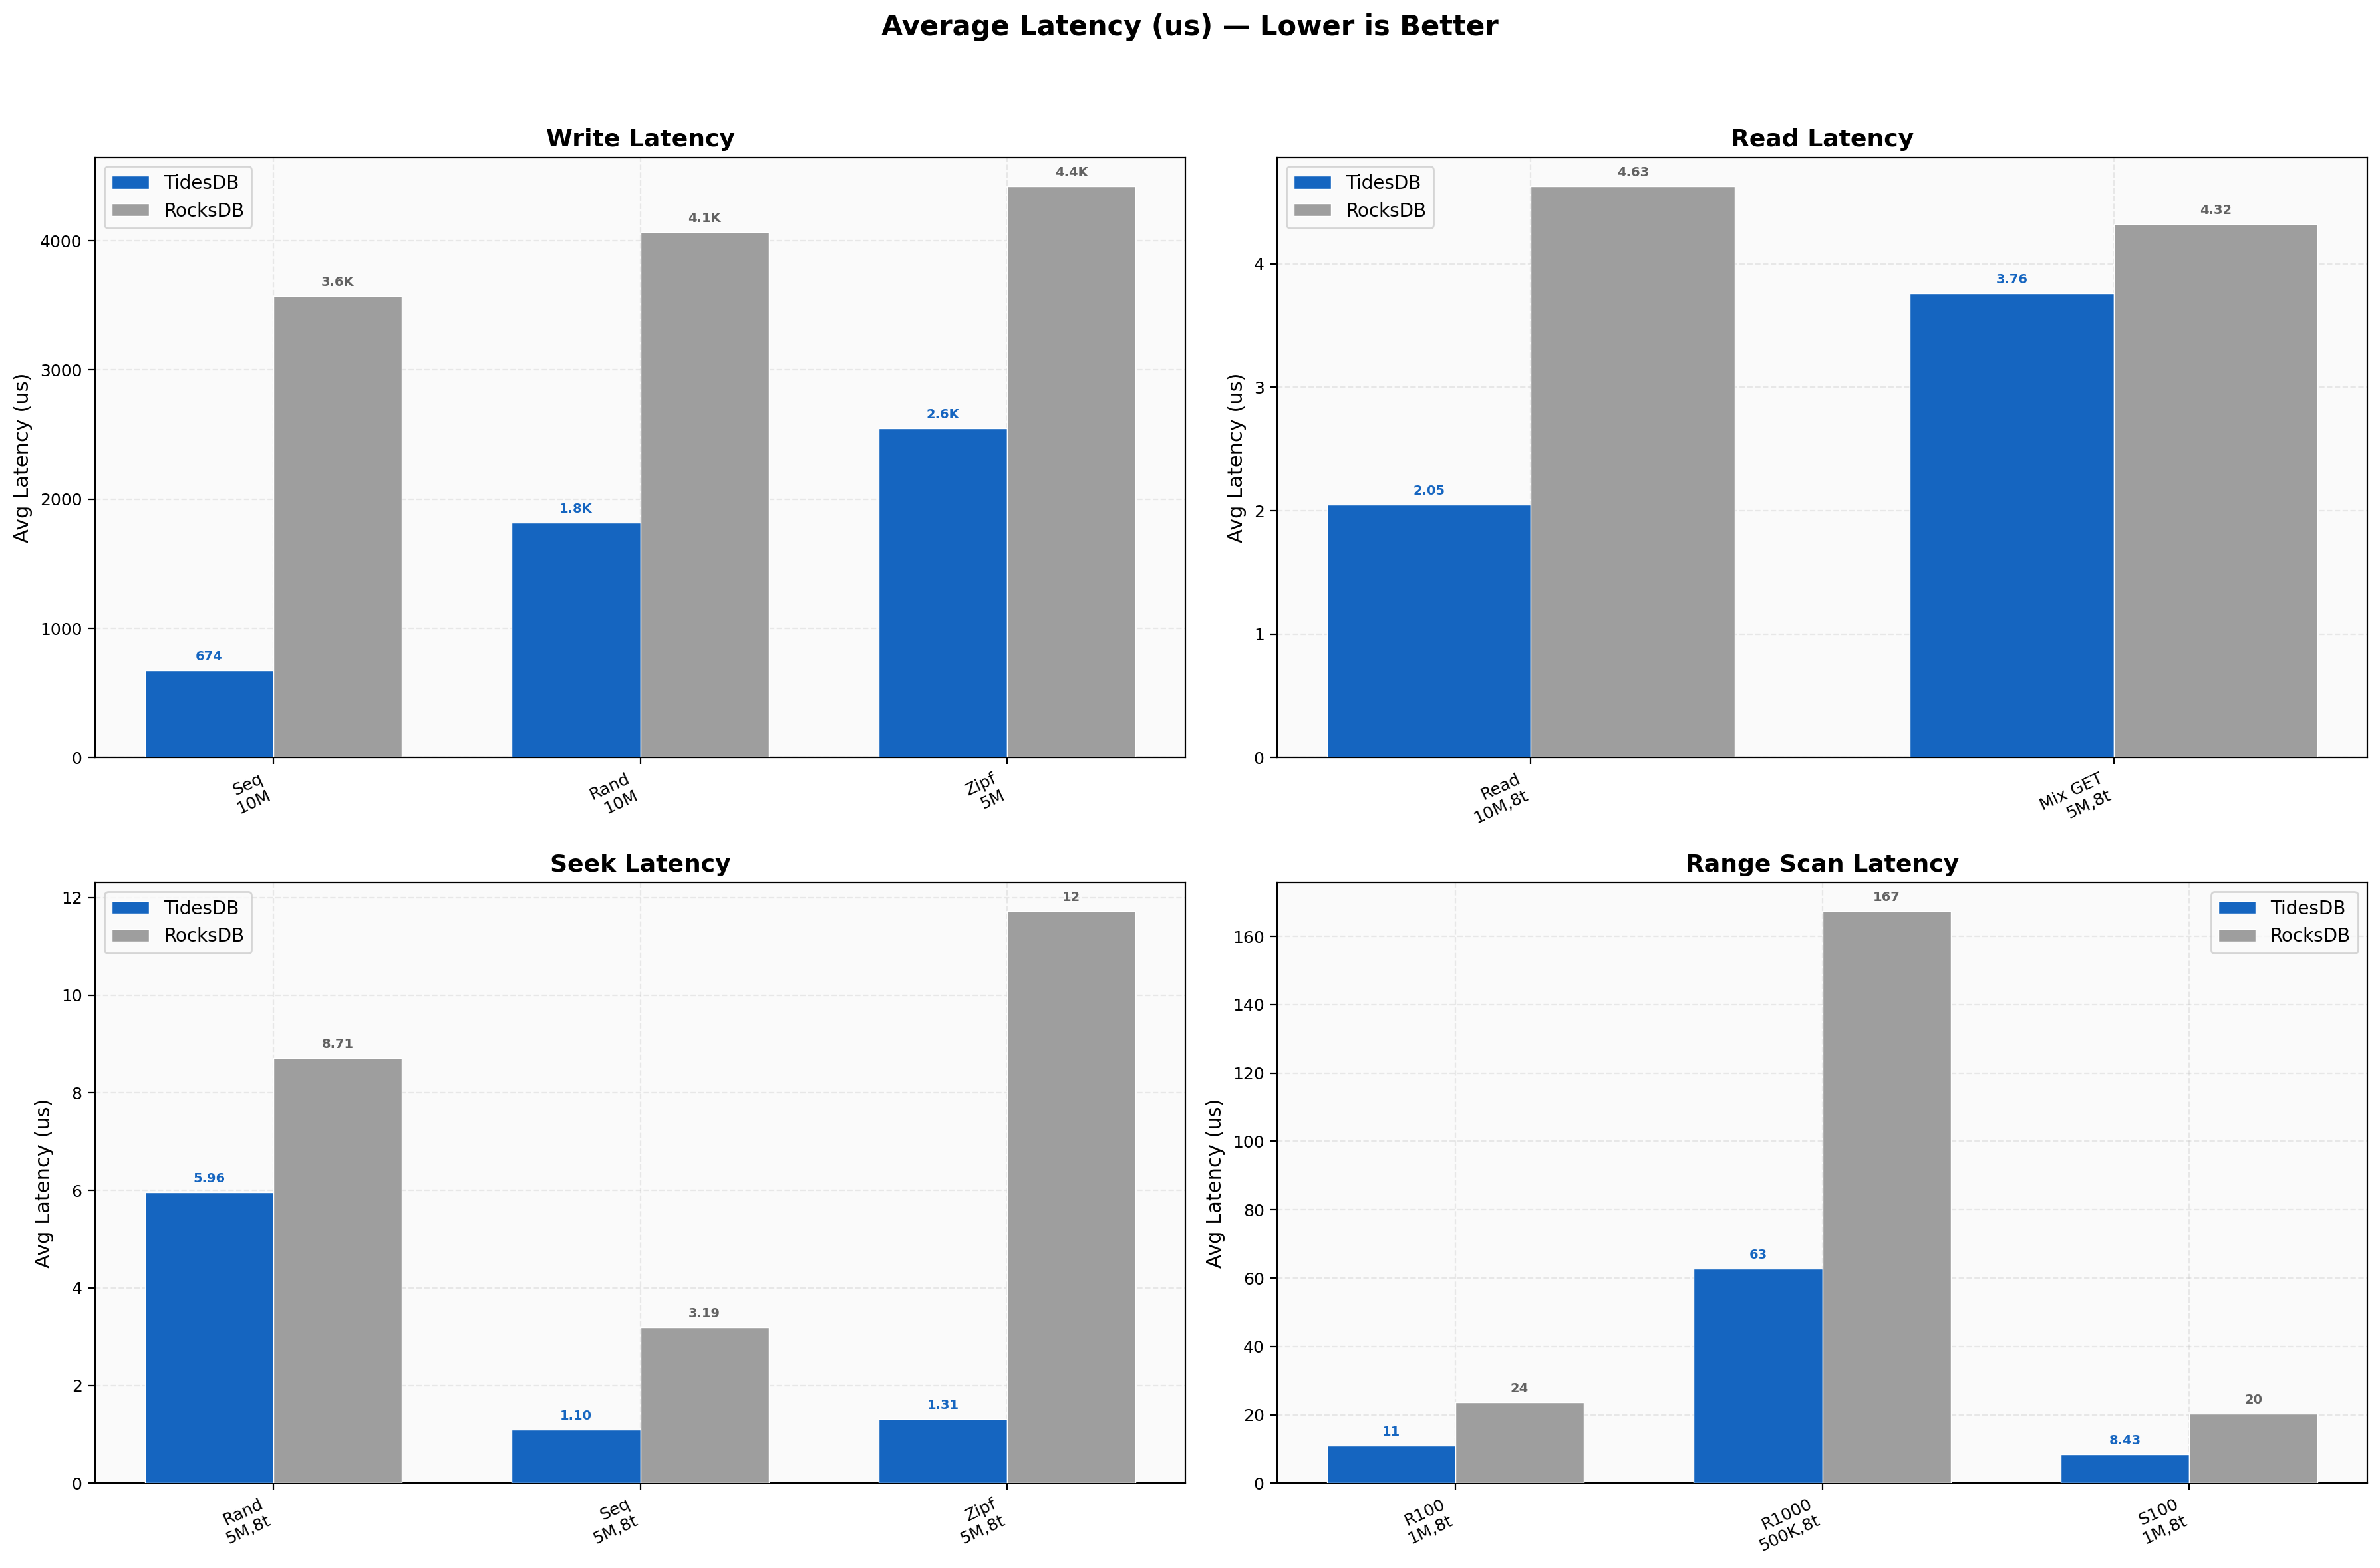
Latency Overview
Average write latency for sequential is 674 µs vs 3,575 µs (5.3x), random 1,821 µs vs 4,069 µs. Read and seek latencies are sub-5 µs with random reads at 2.05 µs vs 4.63 µs and Zipfian seeks at 1.31 µs vs 11.72 µs (~9x). Range scans scale from 11 µs to 63 µs for TidesDB versus 24 µs to 167 µs for RocksDB.
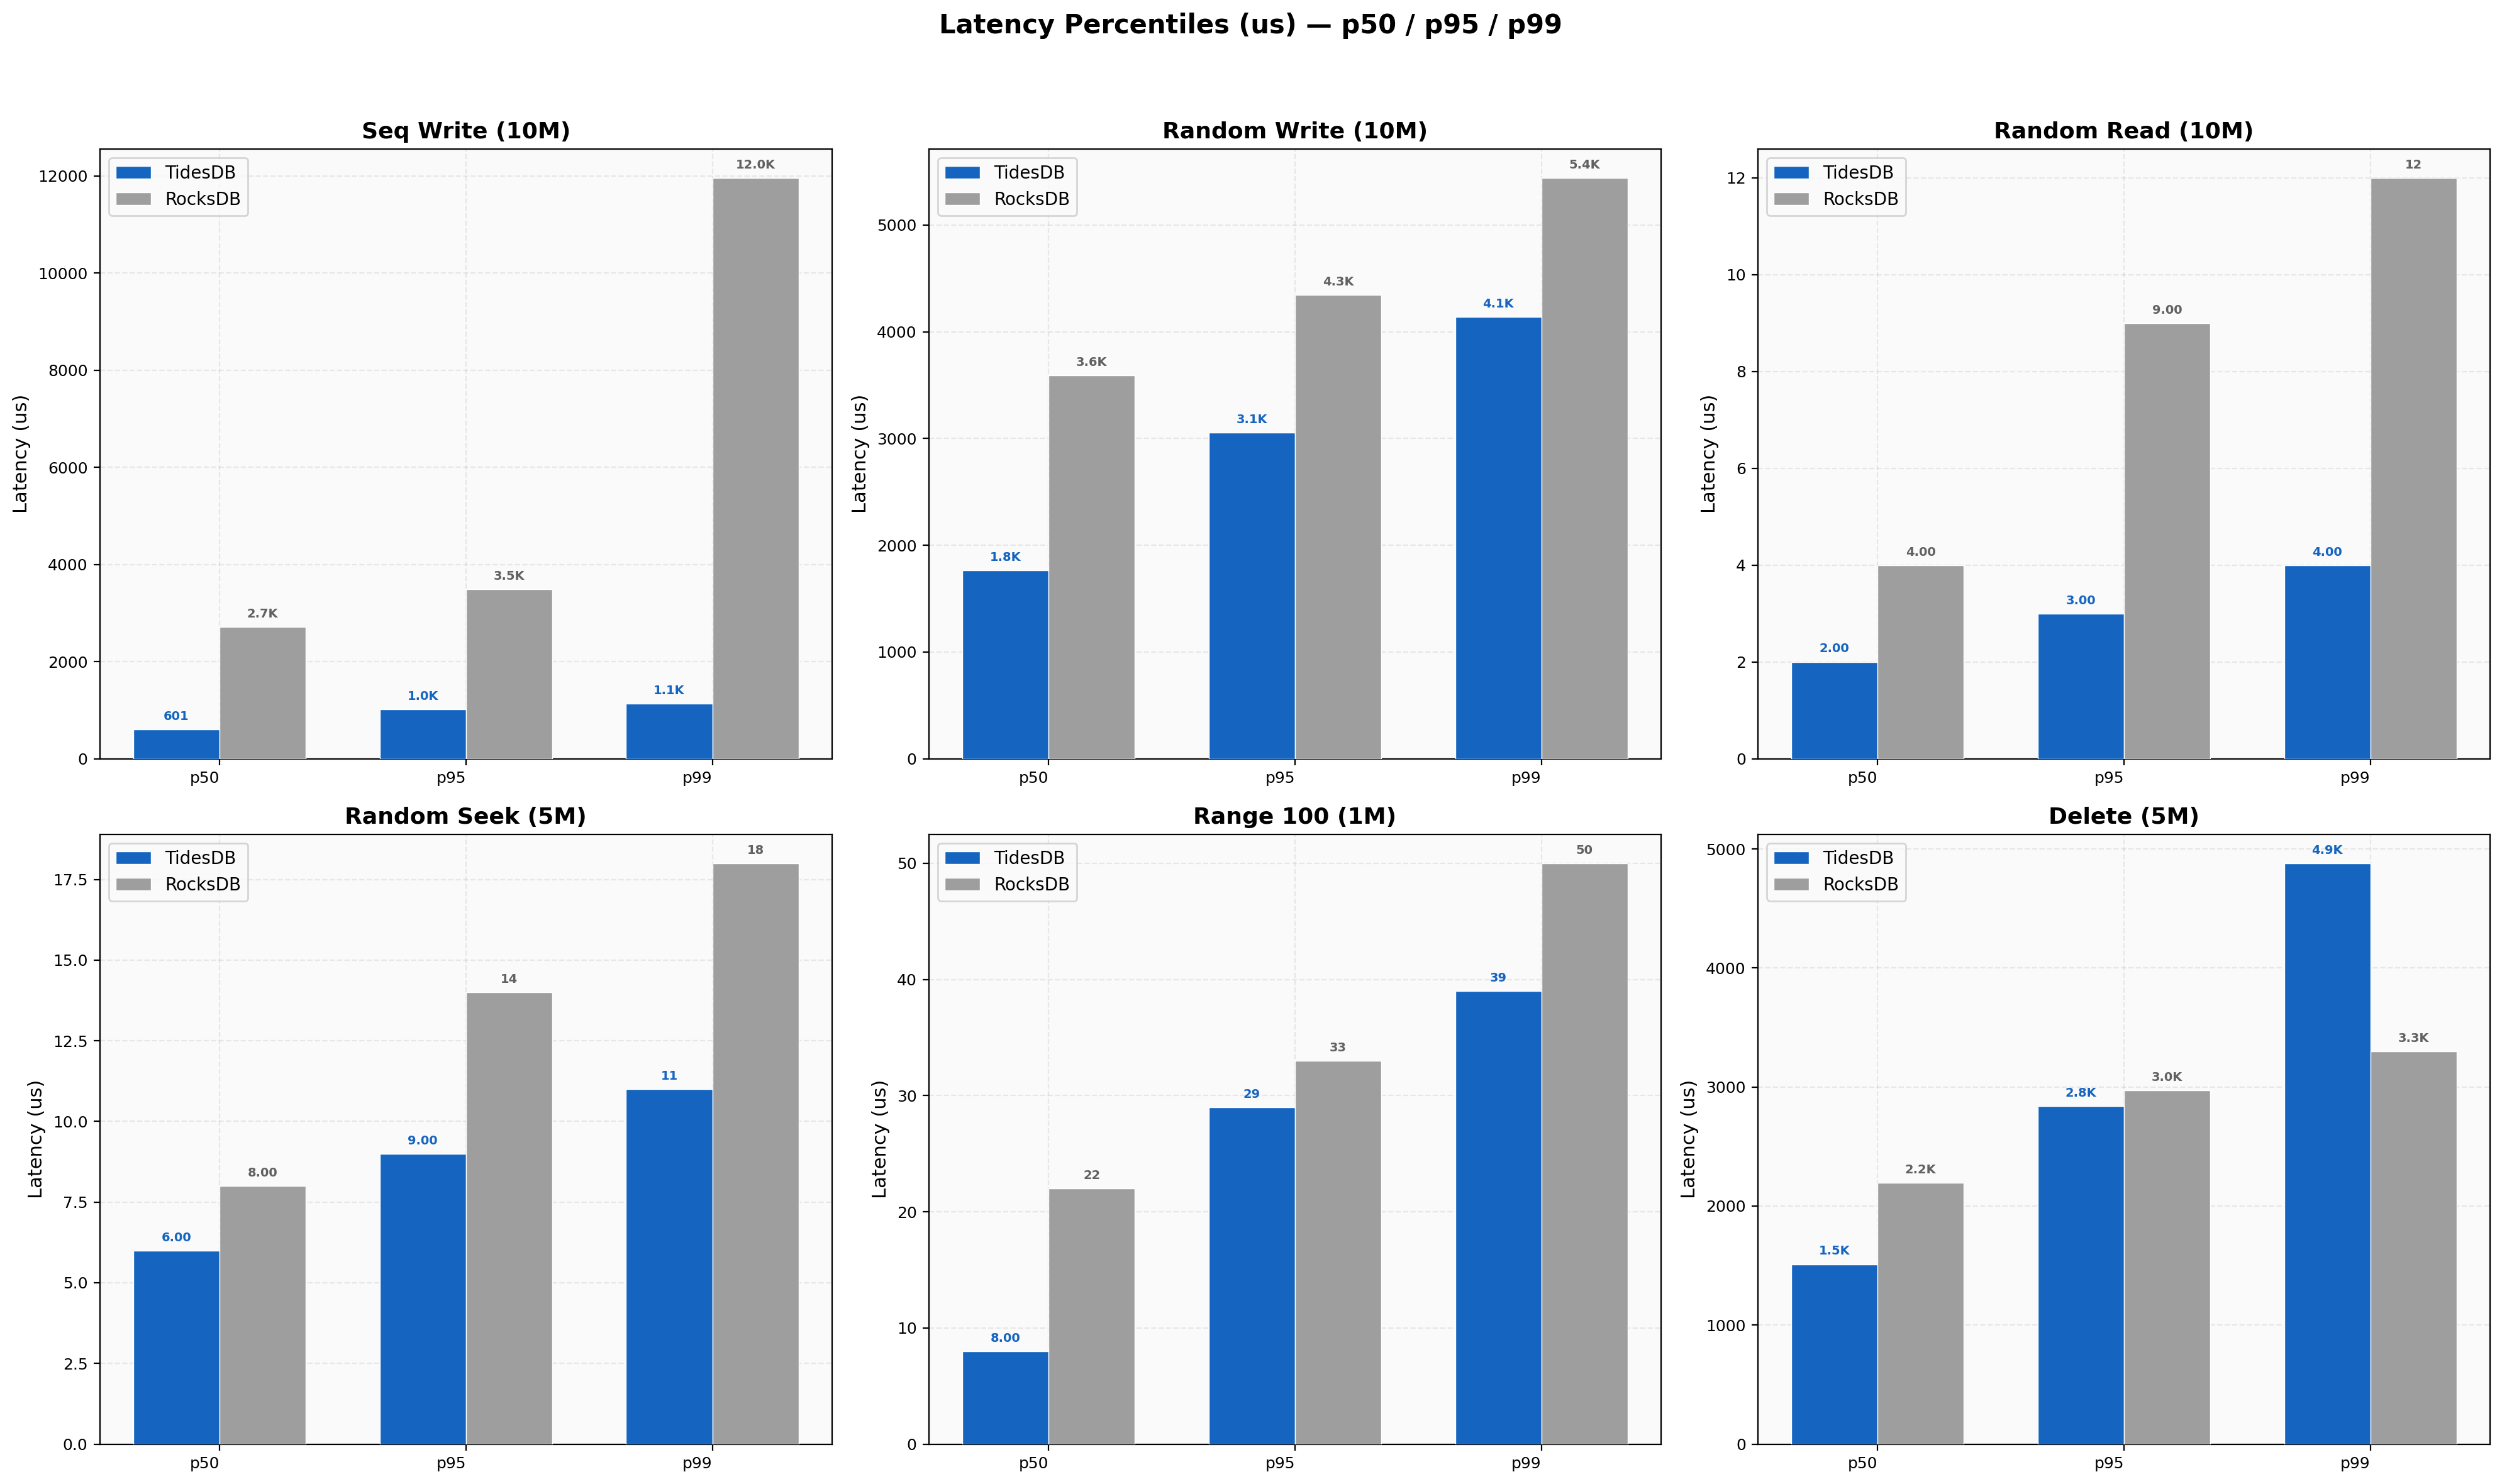
Latency Percentiles
Sequential write p99/p50 ratio is 1.9x for TidesDB vs 4.4x for RocksDB, where the wider spread indicates compaction stalls. Random reads are tight for both (TidesDB 2/3/4 µs at p50/p95/p99 vs RocksDB 4/9/12 µs). Delete p50 favors TidesDB but RocksDB has a tighter p99/p50 ratio (1.50x vs our 3.23x).
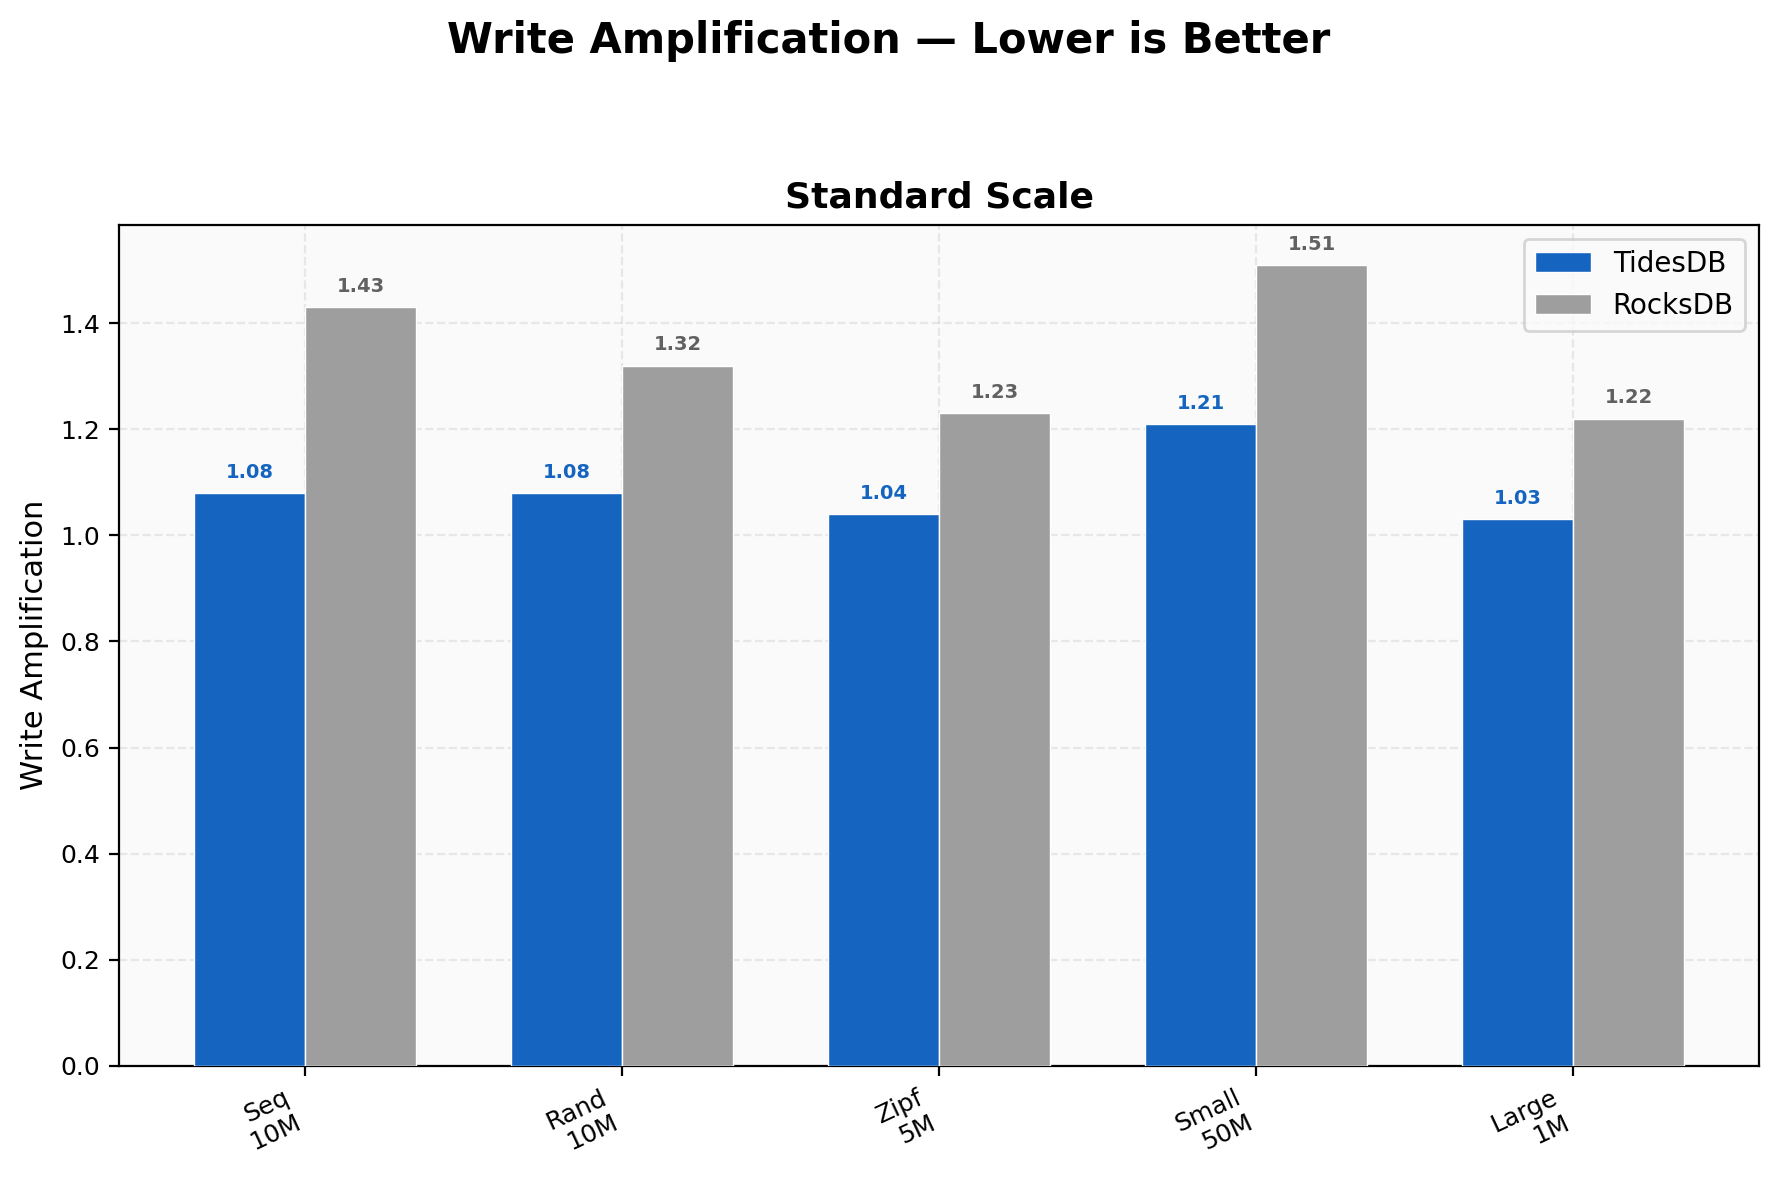
Write Amplification
TidesDB stays between 1.03-1.21 across all workloads; RocksDB ranges 1.22-1.51. The 15-24% gap translates directly to less SSD wear, less background I/O contention, and tighter tail latencies. Tightest amplification is on large values (1.03 vs 1.22) and the widest gap is on 50M small-value writes (1.21 vs 1.51).
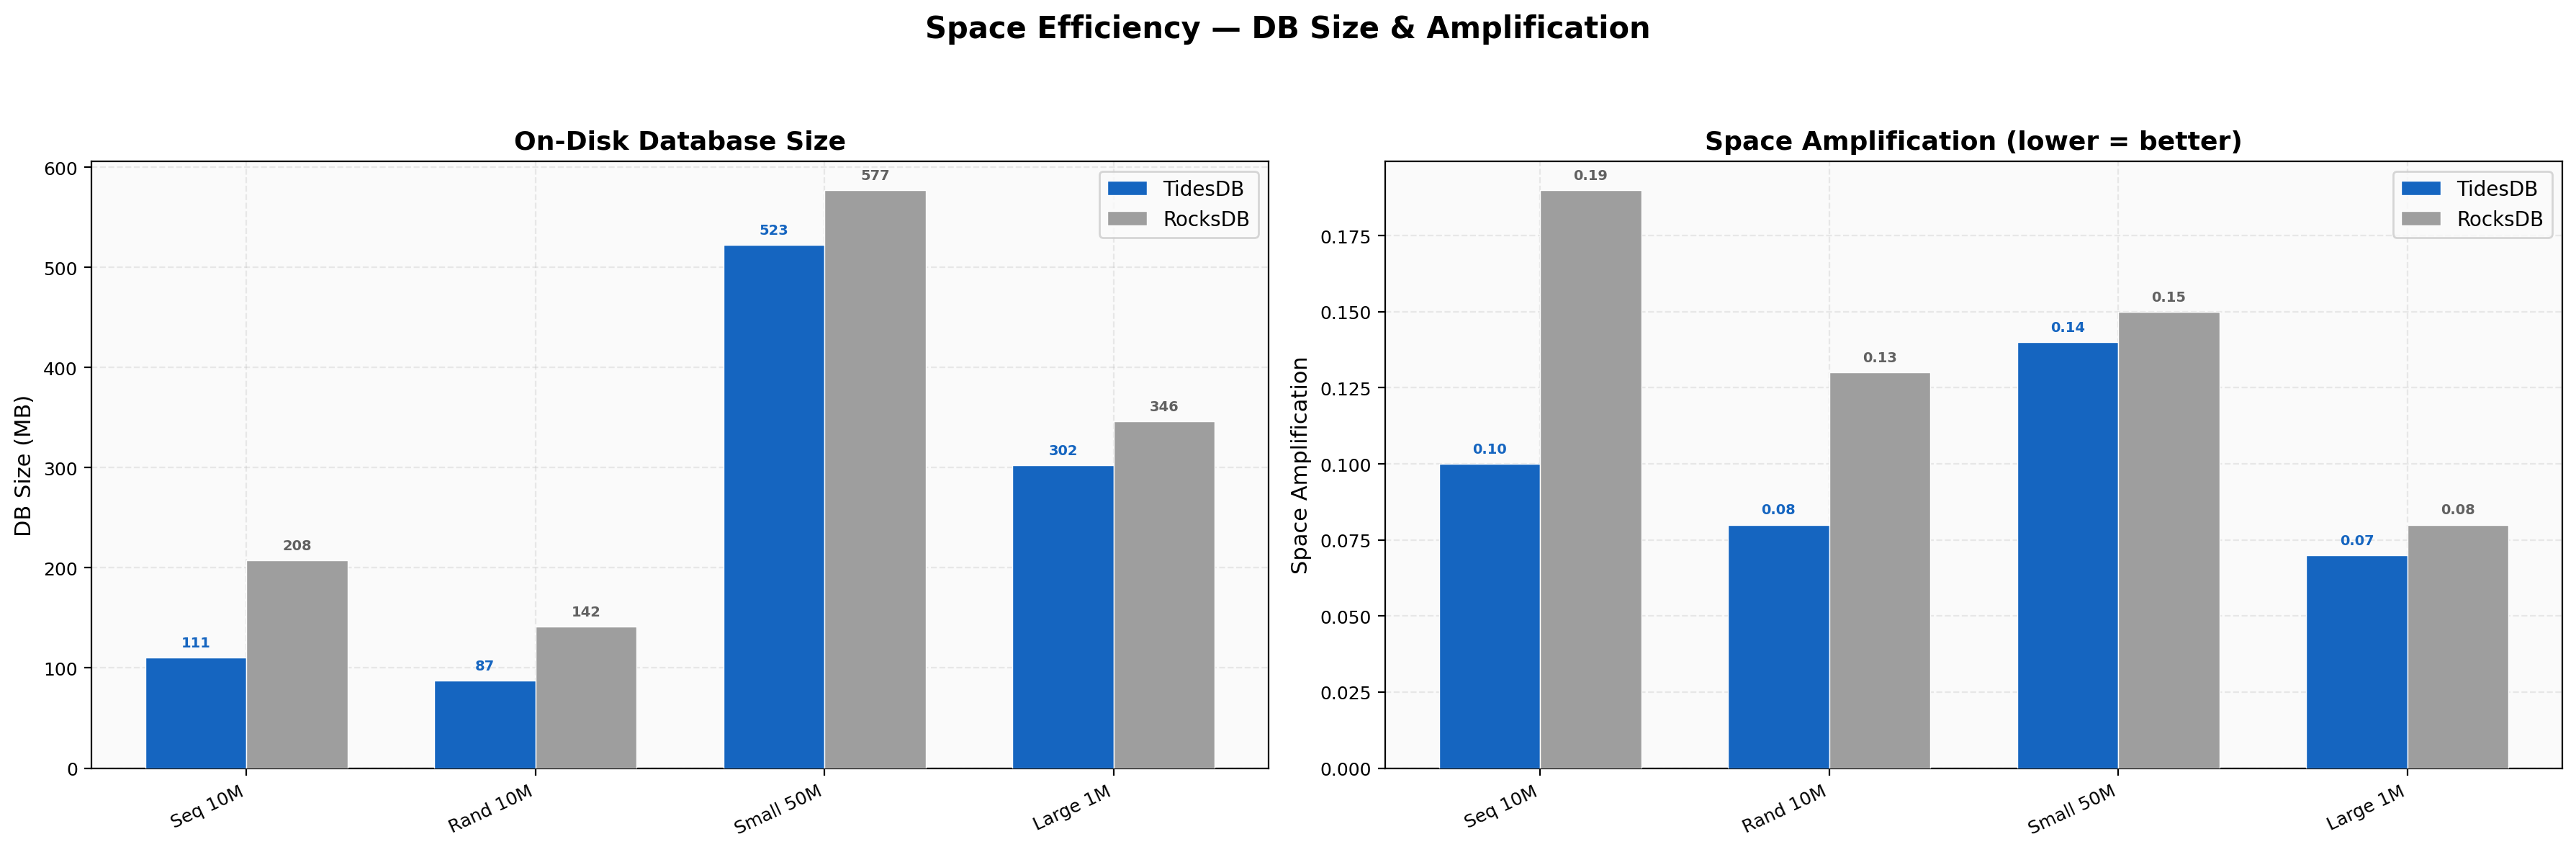
Space Efficiency
Sequential 10M keys land at 111 MB vs 208 MB (47% smaller), random 10M at 87 MB vs 142 MB (38%). Space amplification ratios are TidesDB 0.07-0.14 vs RocksDB 0.08-0.19. Sequential writes produce the tightest compaction on our sorted runs.
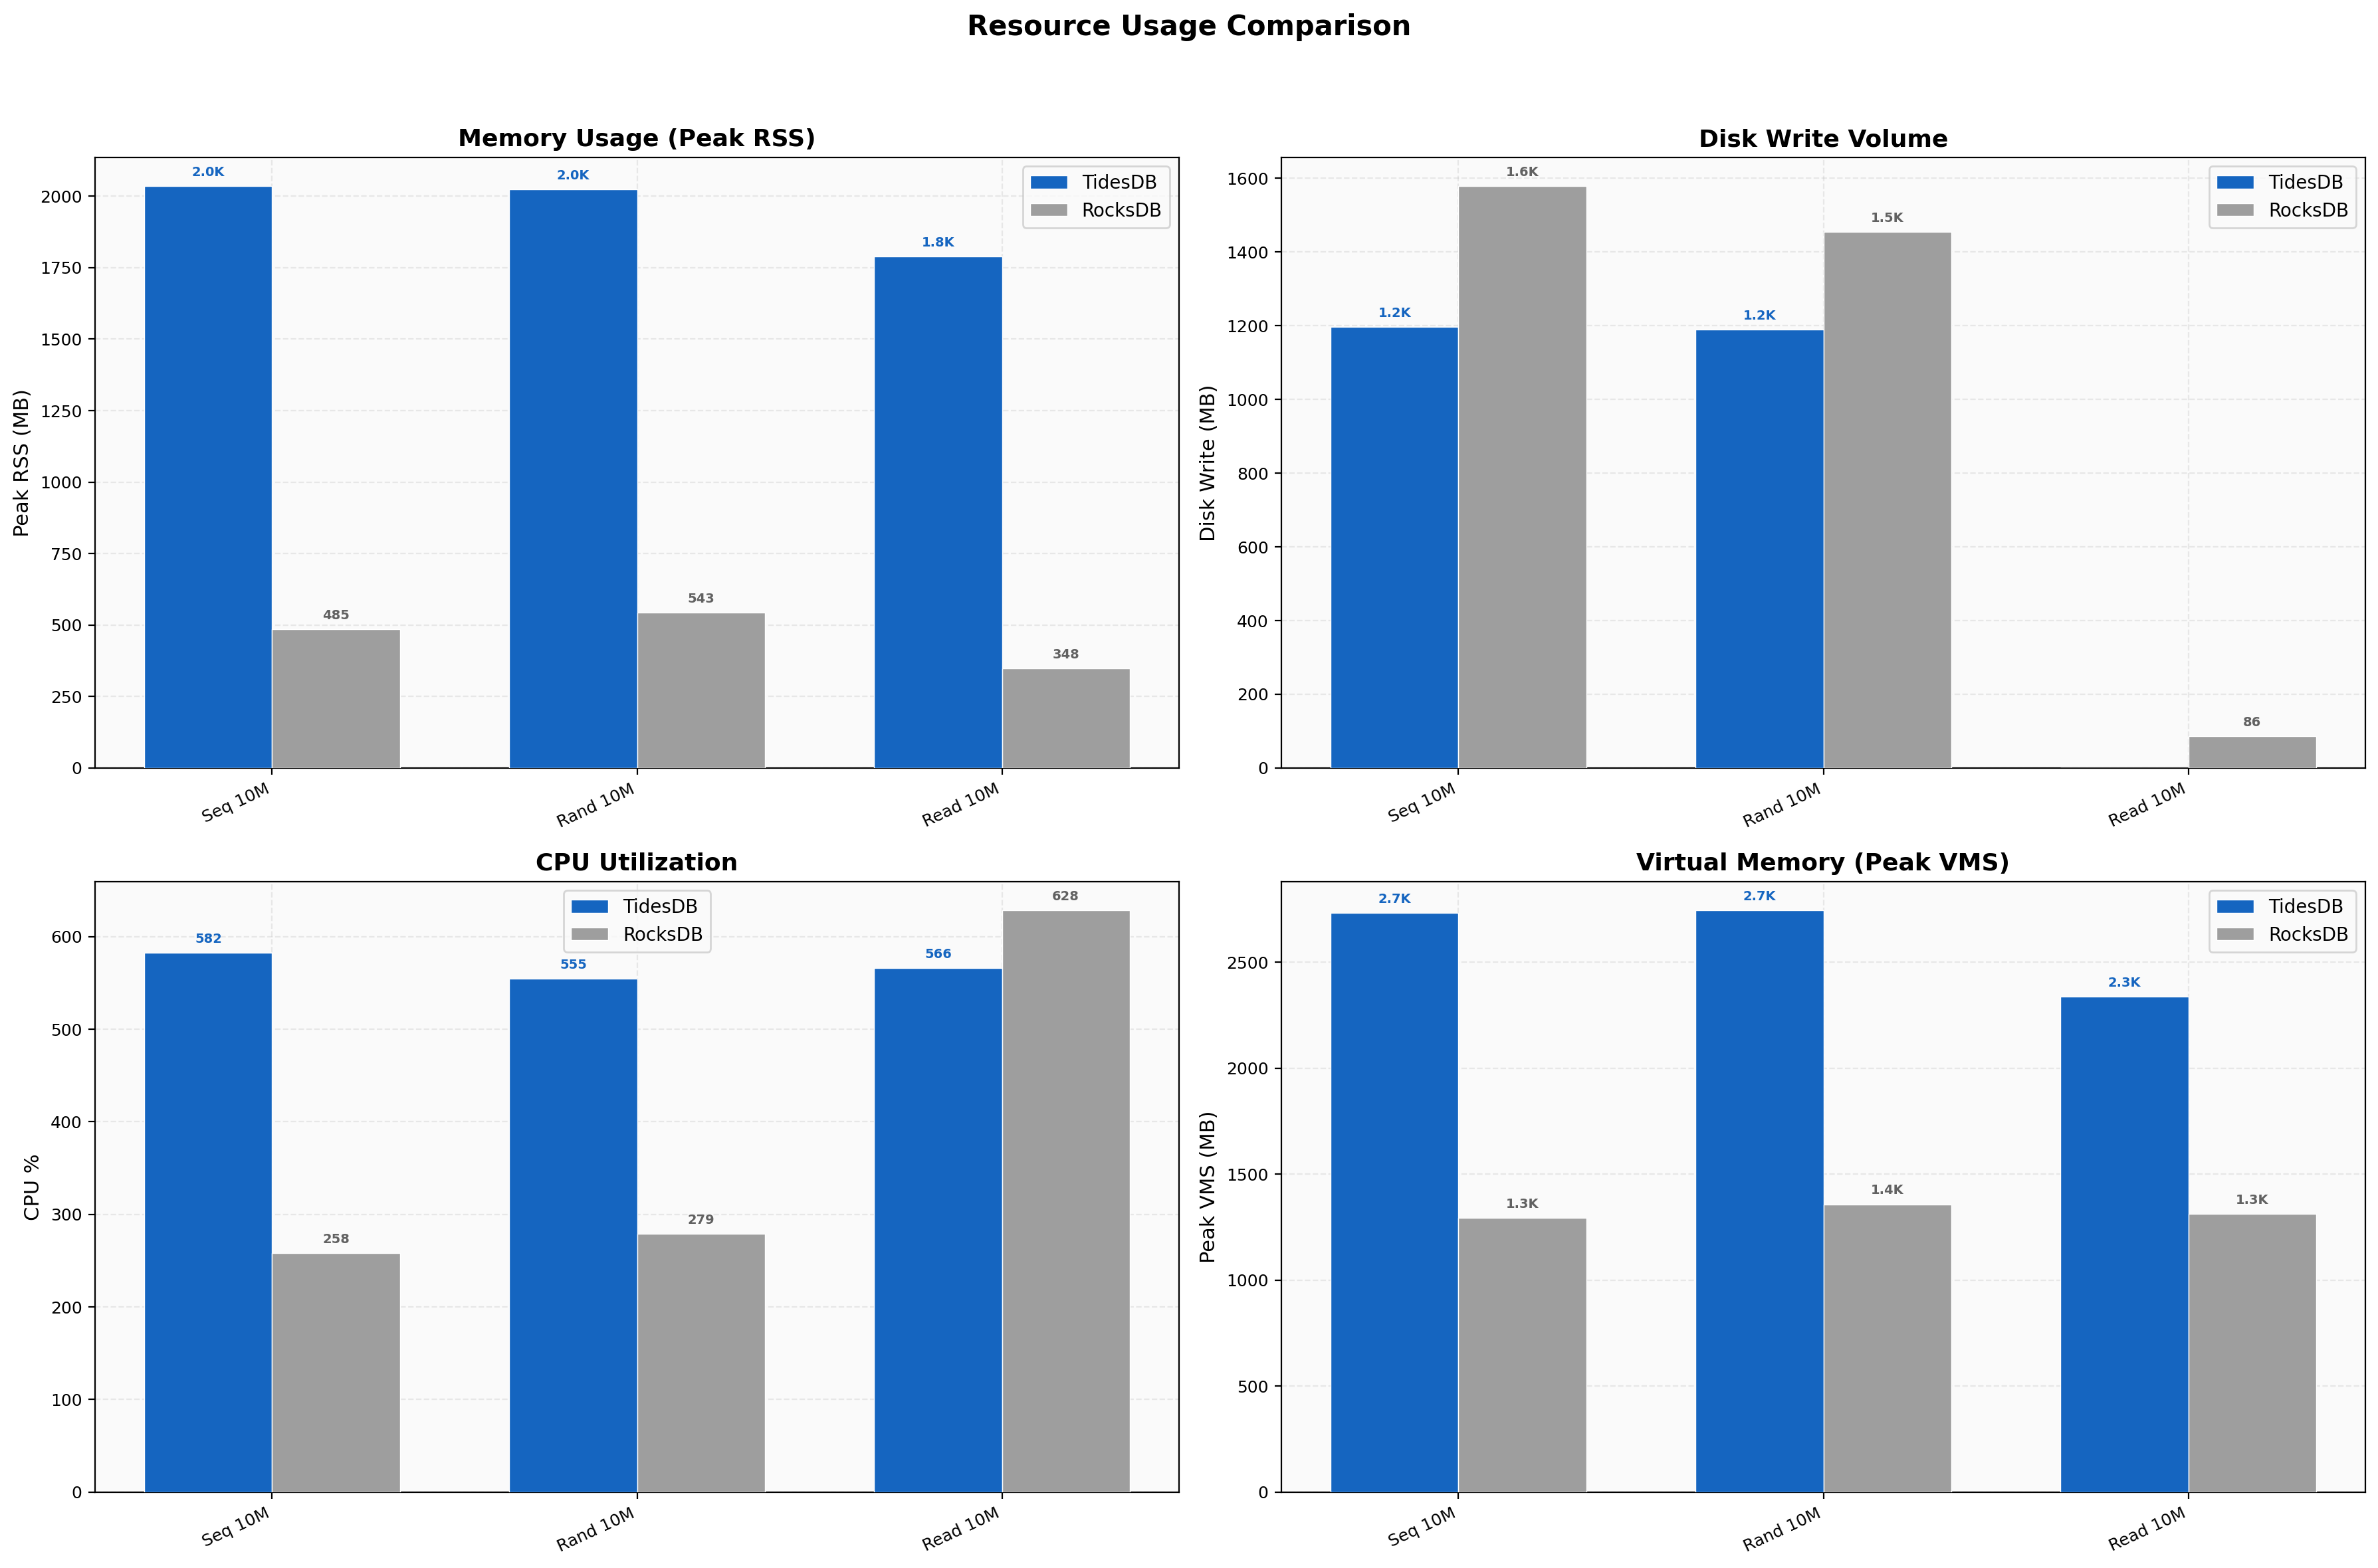
Resource Usage
TidesDB uses ~4x more memory (2,035 MB vs 485 MB peak RSS on sequential writes), an intentional trade-off for speed. We write 18-24% less data to disk. CPU is higher on writes (582% vs 258%) due to more aggressive parallelism across 8 threads. The new max_memory_usage cap in v8.6.0 keeps this bounded.
Tail Latency
On 4KB values, TidesDB p99/avg ratio is 1.92x (36,427 µs / 18,959 µs) while RocksDB is 10.9x (645,594 µs / 59,082 µs). RocksDB’s compaction stalls on large values produce half-second tail spikes. Standard-size sequential writes show a 1.68x ratio for TidesDB vs 3.34x for RocksDB.
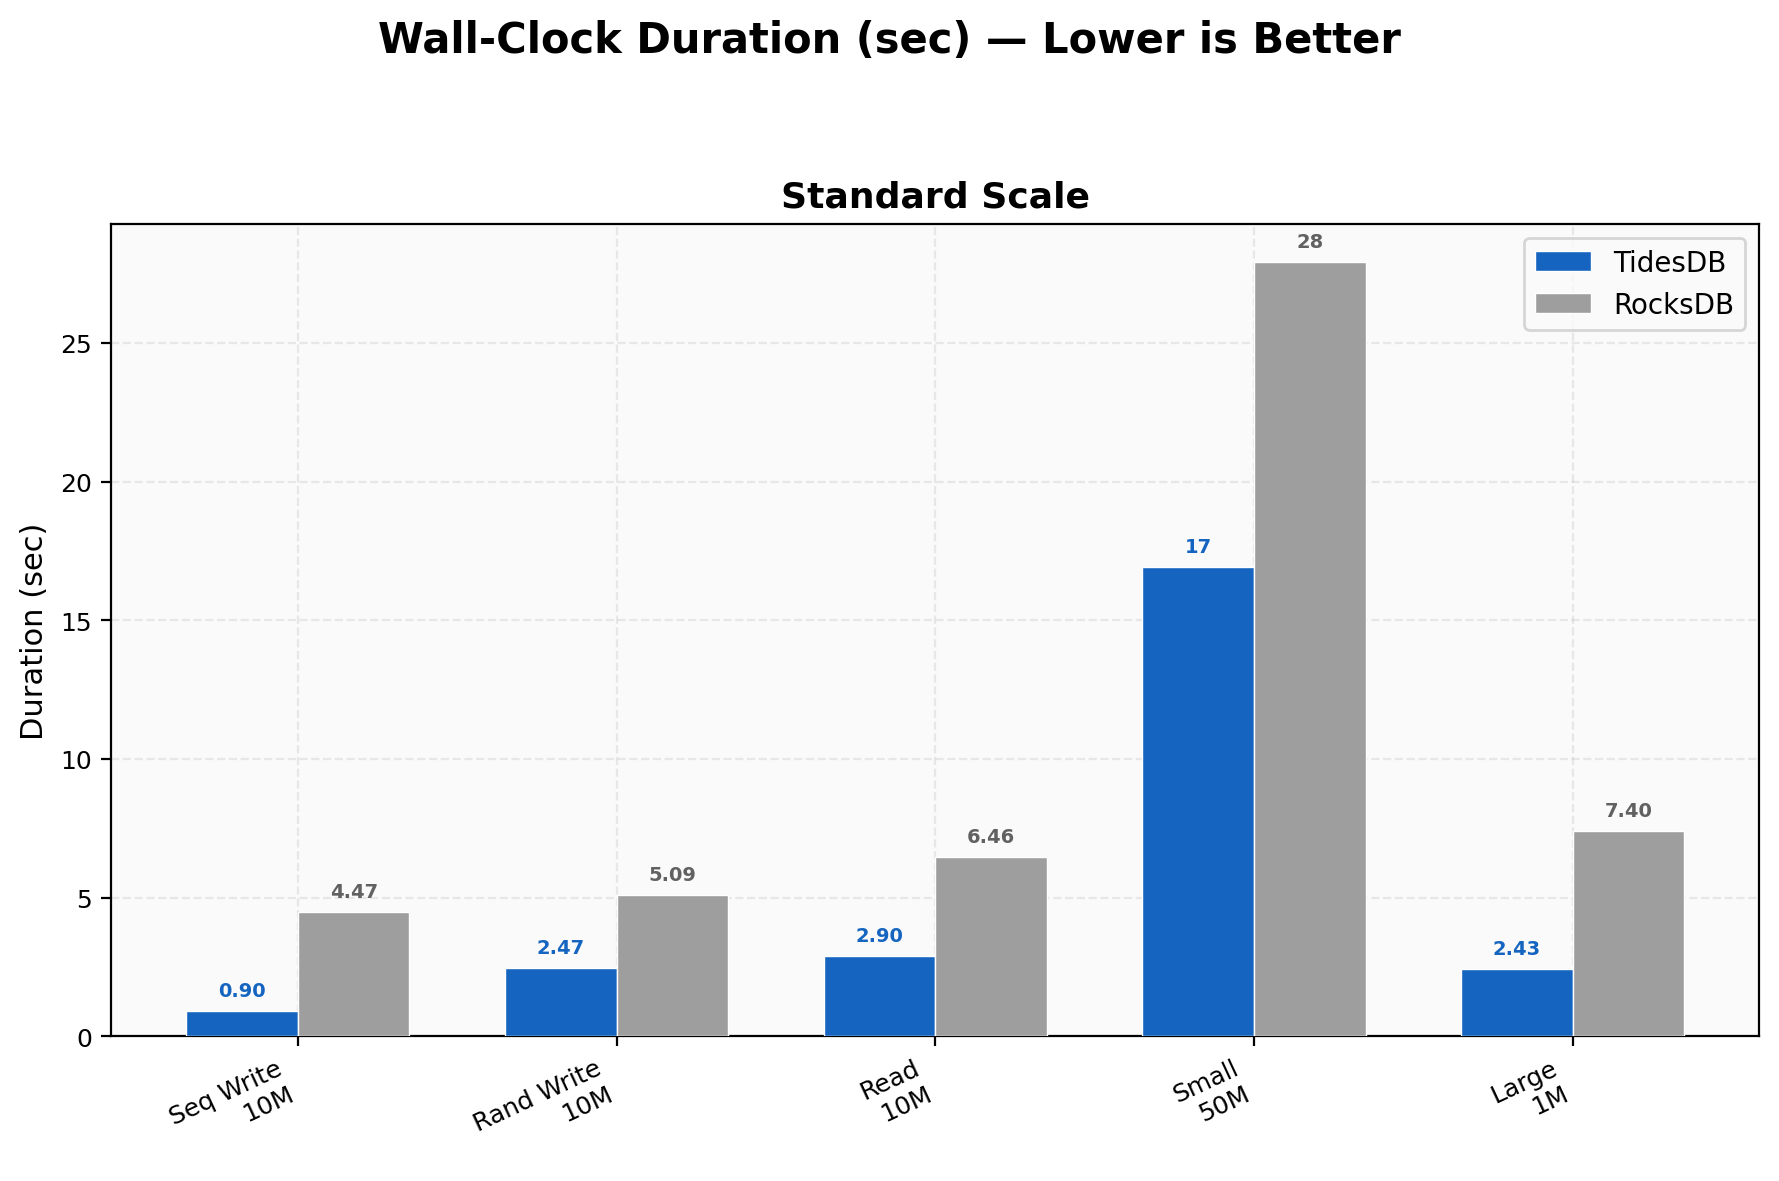
Duration Comparison
10M sequential writes finish in 0.9s vs 4.47s, 10M random writes in 2.47s vs 5.09s, 10M random reads in 2.90s vs 6.46s, 50M small-value writes in ~17s vs ~28s, and 1M large-value (4KB) in 2.43s vs 7.40s, a 3x wall-clock difference.
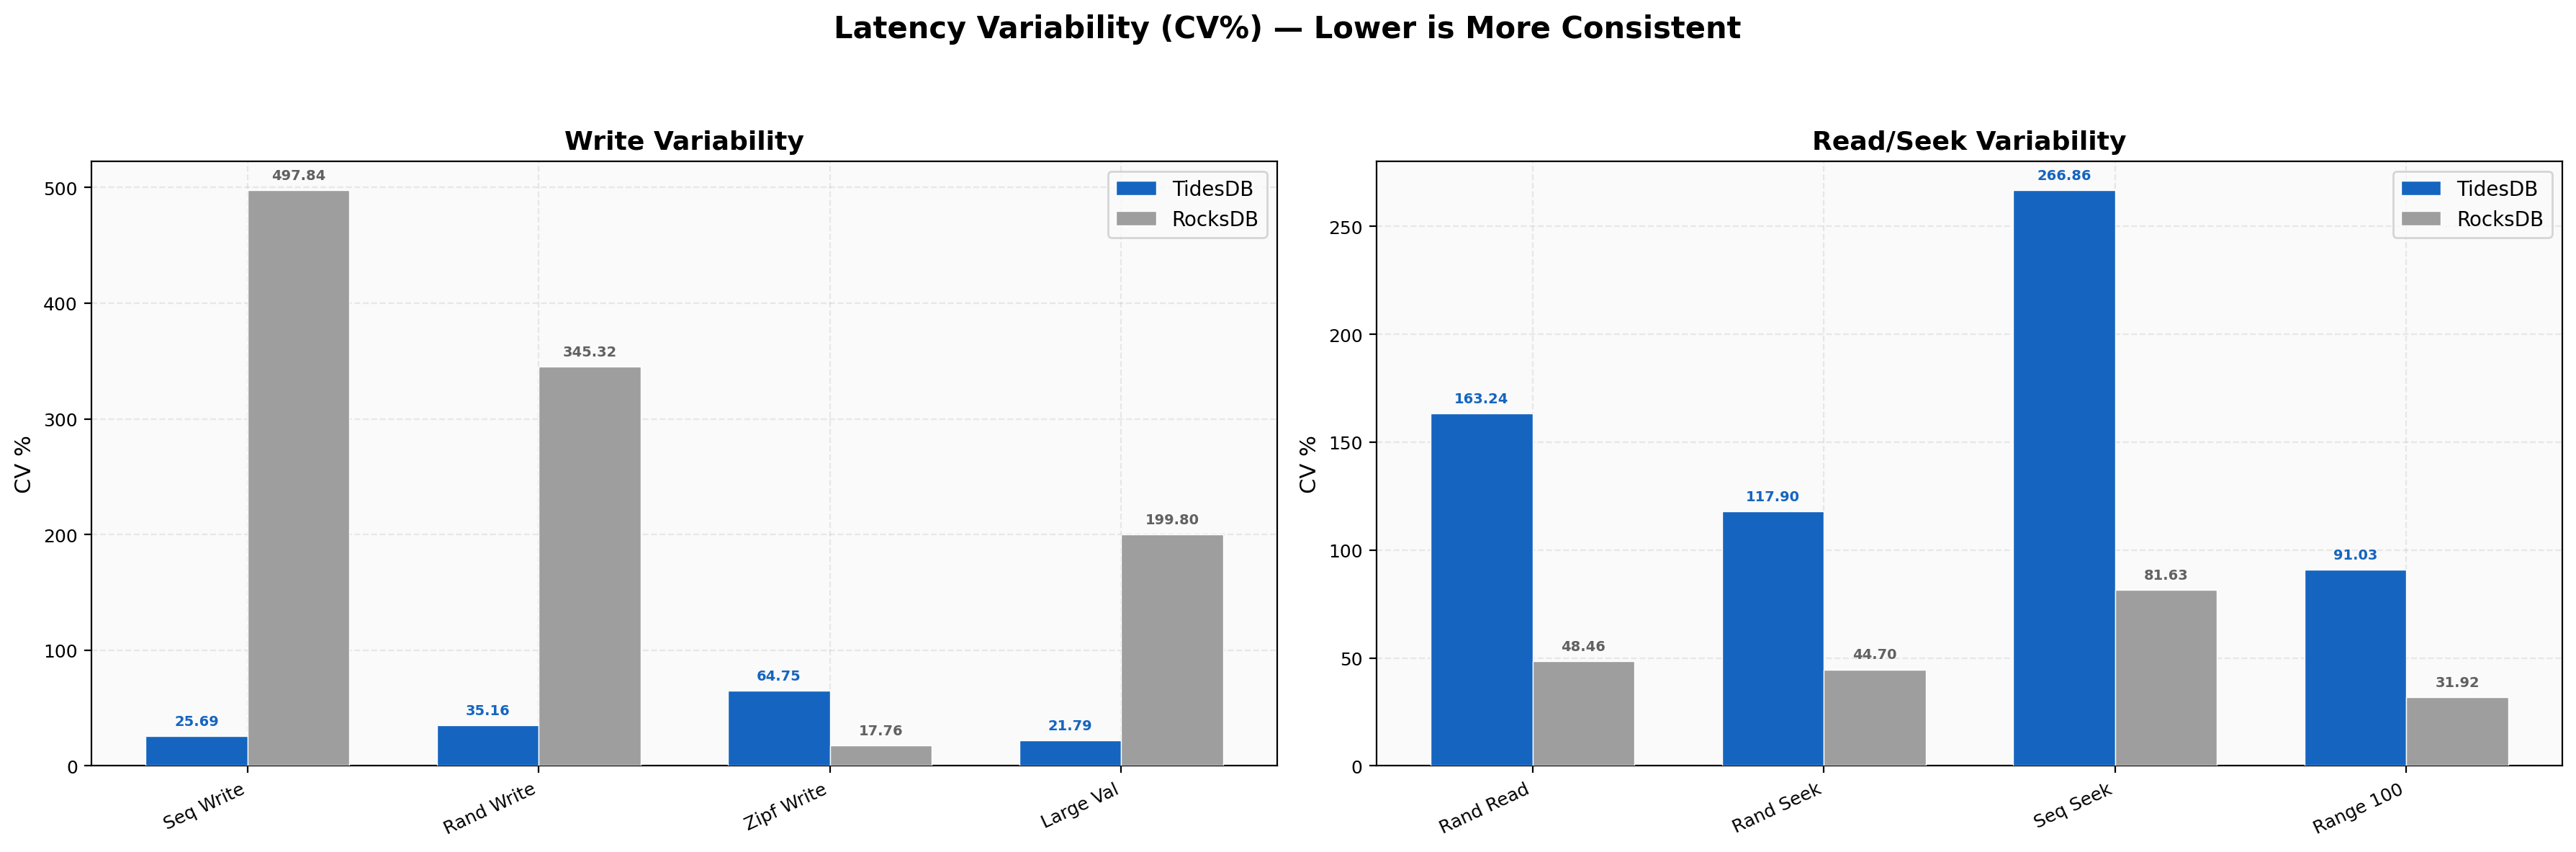
Latency Variability
Write CV is TidesDB 25-35% vs RocksDB 200-497%, making us 9-19x more consistent on writes as RocksDB’s compaction stalls create huge latency spikes. Read and seek CV reverses with RocksDB’s random read CV at 48% vs our 163%. The higher relative variability is spread around much smaller absolute numbers (2 µs vs 4.6 µs), meaning faster reads with a bit more jitter.
Environment 2
In environment 2 I run the benchtool as well but tidesdb_rocksdb.sh the standard base runner.
- AMD Ryzen Threadripper 2950X (16 cores 32 threads) @ 3.5GHz
- 128GB DDR4
- Ubuntu 22.04 x86_64
- GCC (glibc)
- XFS raw NVMe(SAMSUNG MZVLB512HAJQ-00000) w/discard, inode64, nodiratime, noatime, logbsize=256k, logbufs=8
Benchmark Results Files
| File | SHA256 Checksum |
|---|---|
| tidesdb_rocksdb_benchmark_results_20260223_085435.csv | 4ef376f7626452e0ef7cc2eb22b48655bc6dbe9693d48401252be6b25d0ae50b |
| tidesdb_rocksdb_benchmark_results_20260223_085435.txt | 6181df910962135a90804896622c31937c593f4cec696f2f1fdfba06f37999f4 |
Run
This run uses the standard base runner on the Threadripper with 128 GB RAM and NVMe storage. It covers the same 8-thread standard-scale suite as Environment 1, plus 16-thread large-scale tests (40M writes, 20M mixed/delete/seek, 4M range scans, 200M small-value writes) and synchronous write scaling from 1 to 16 threads.
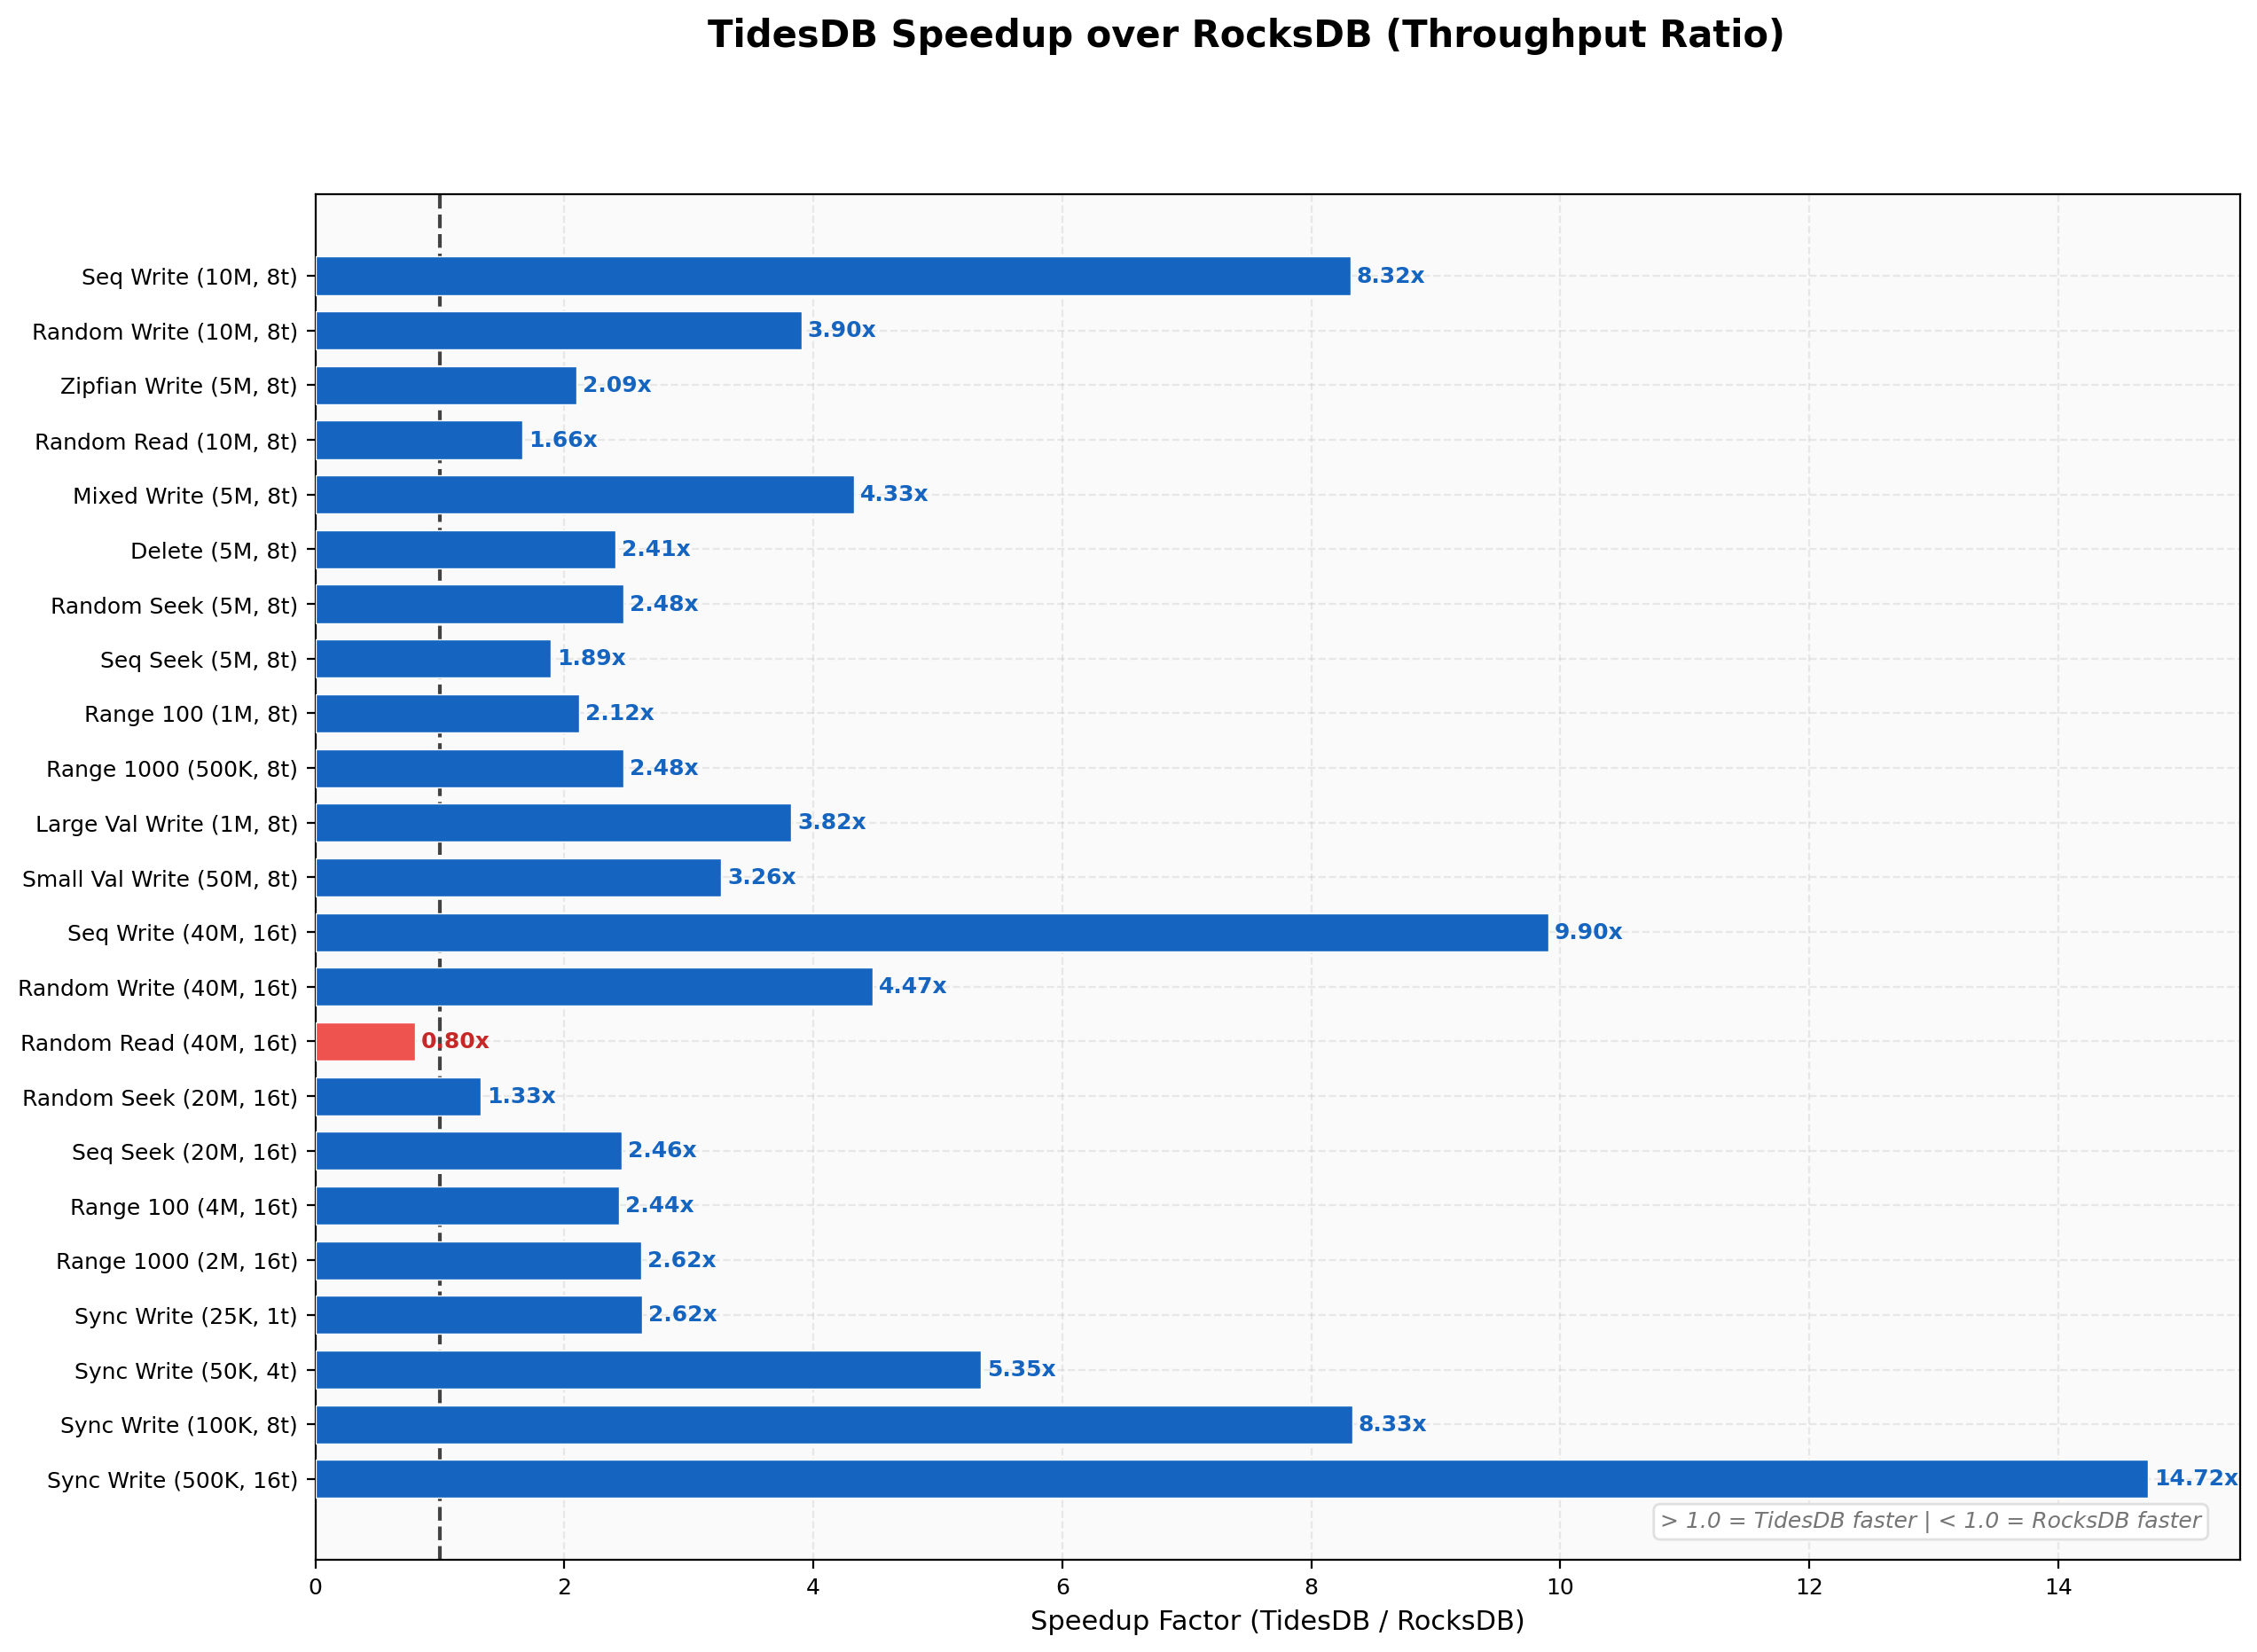
Speedup Summary
TidesDB wins the majority of tests, with the largest margins on sequential writes (8.32x at 8 threads, 9.90x at 16 threads) and sync writes (up to 14.7x at 16 threads). RocksDB takes the lead on single-key operations like batch-1 writes (0.43x) and batch-1 deletes (0.39x), and on the 40M random read test where RocksDB edges ahead at 2.24M vs 1.78M (0.80x). The mixed random GET path at 16 threads is a notable weak spot where TidesDB’s back-pressure system throttles under heavy concurrent write load.
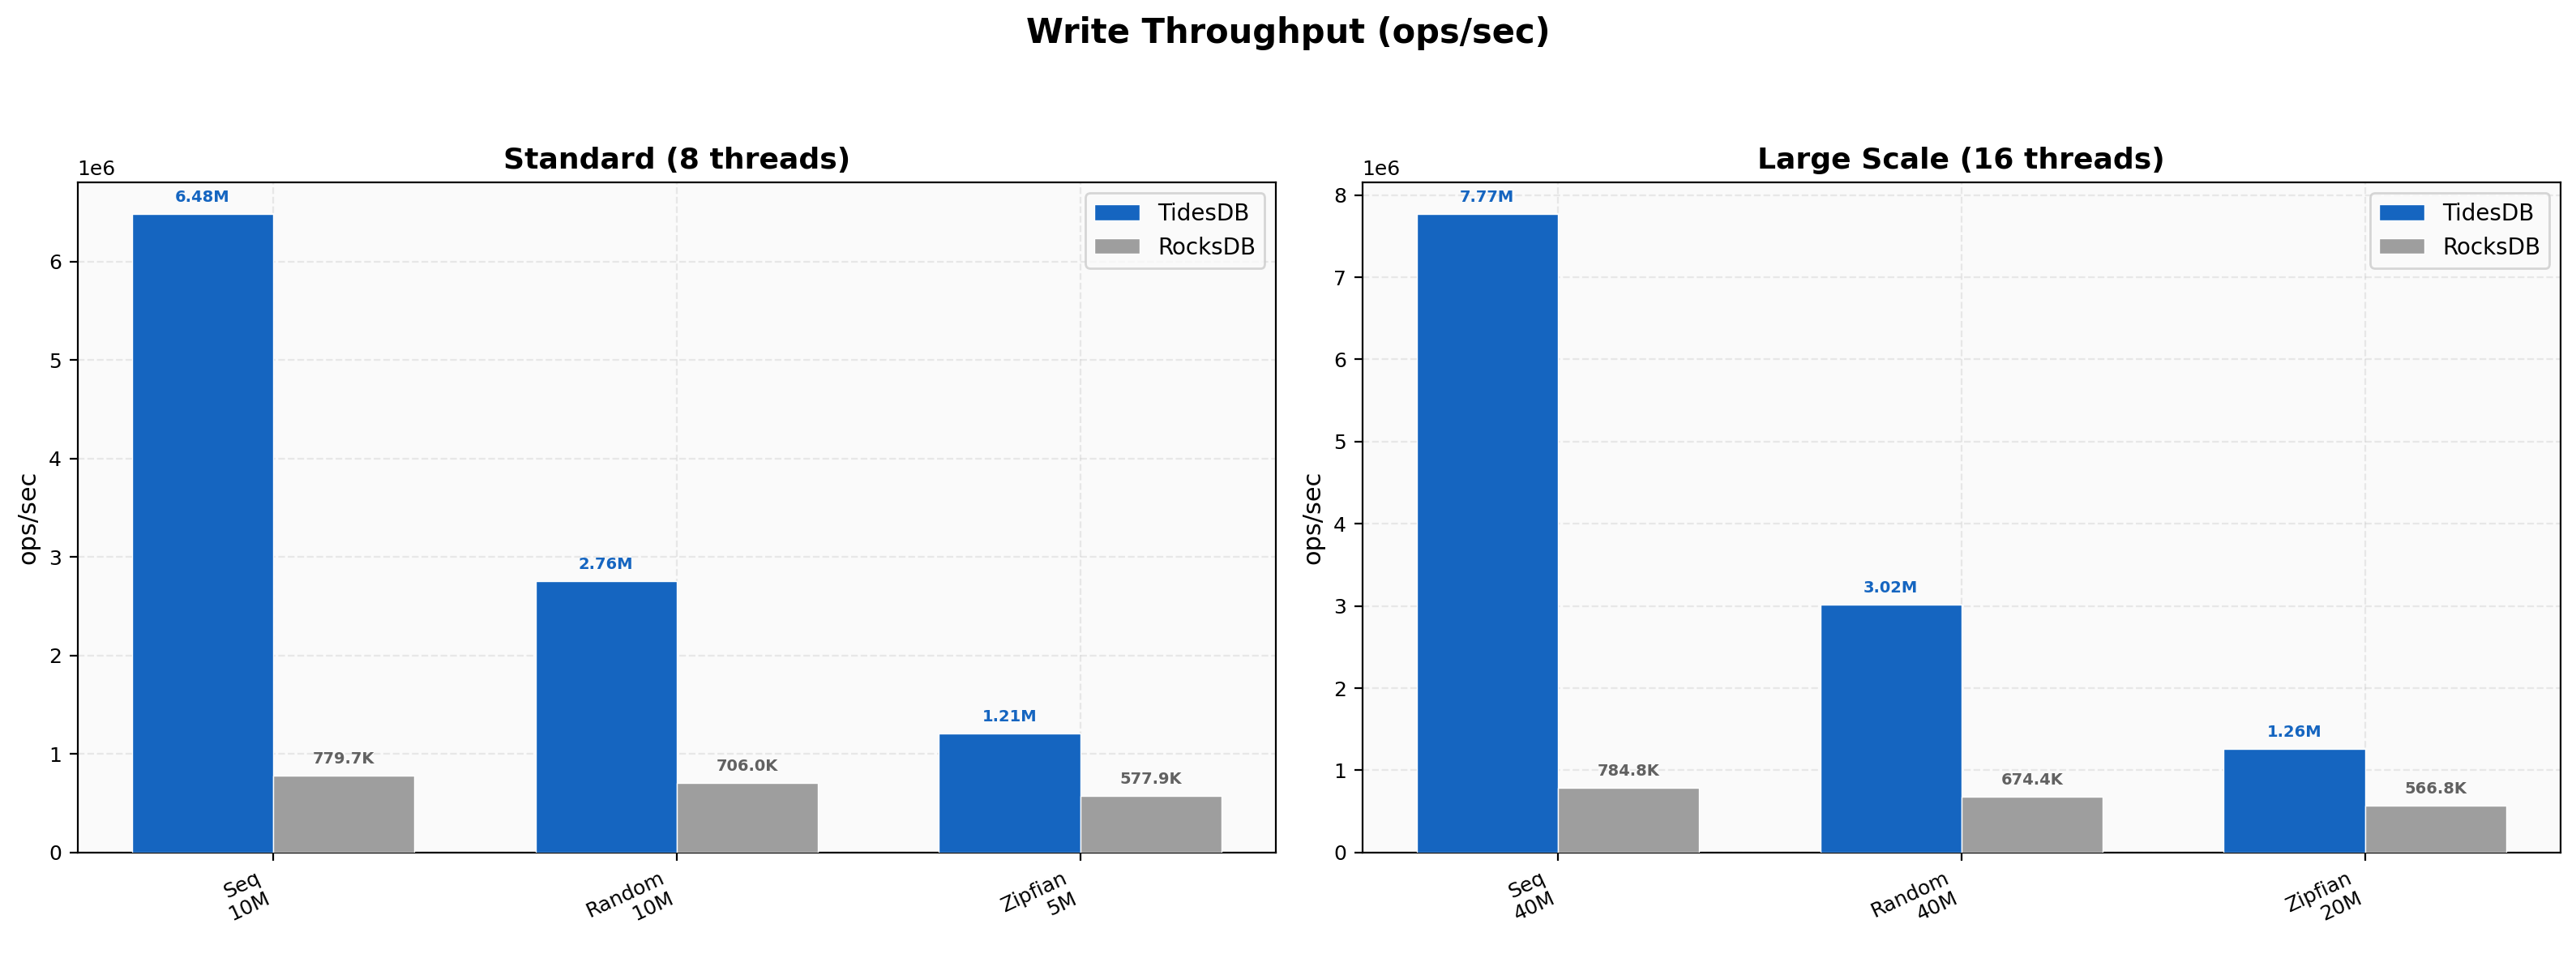
Write Throughput
Sequential writes hit 6.48M vs 780K (8.32x) at 8 threads, scaling to 7.77M vs 785K (9.90x) at 16 threads with 40M keys. Random writes land at 2.76M vs 706K (3.91x) and Zipfian at 1.21M vs 578K (2.09x).
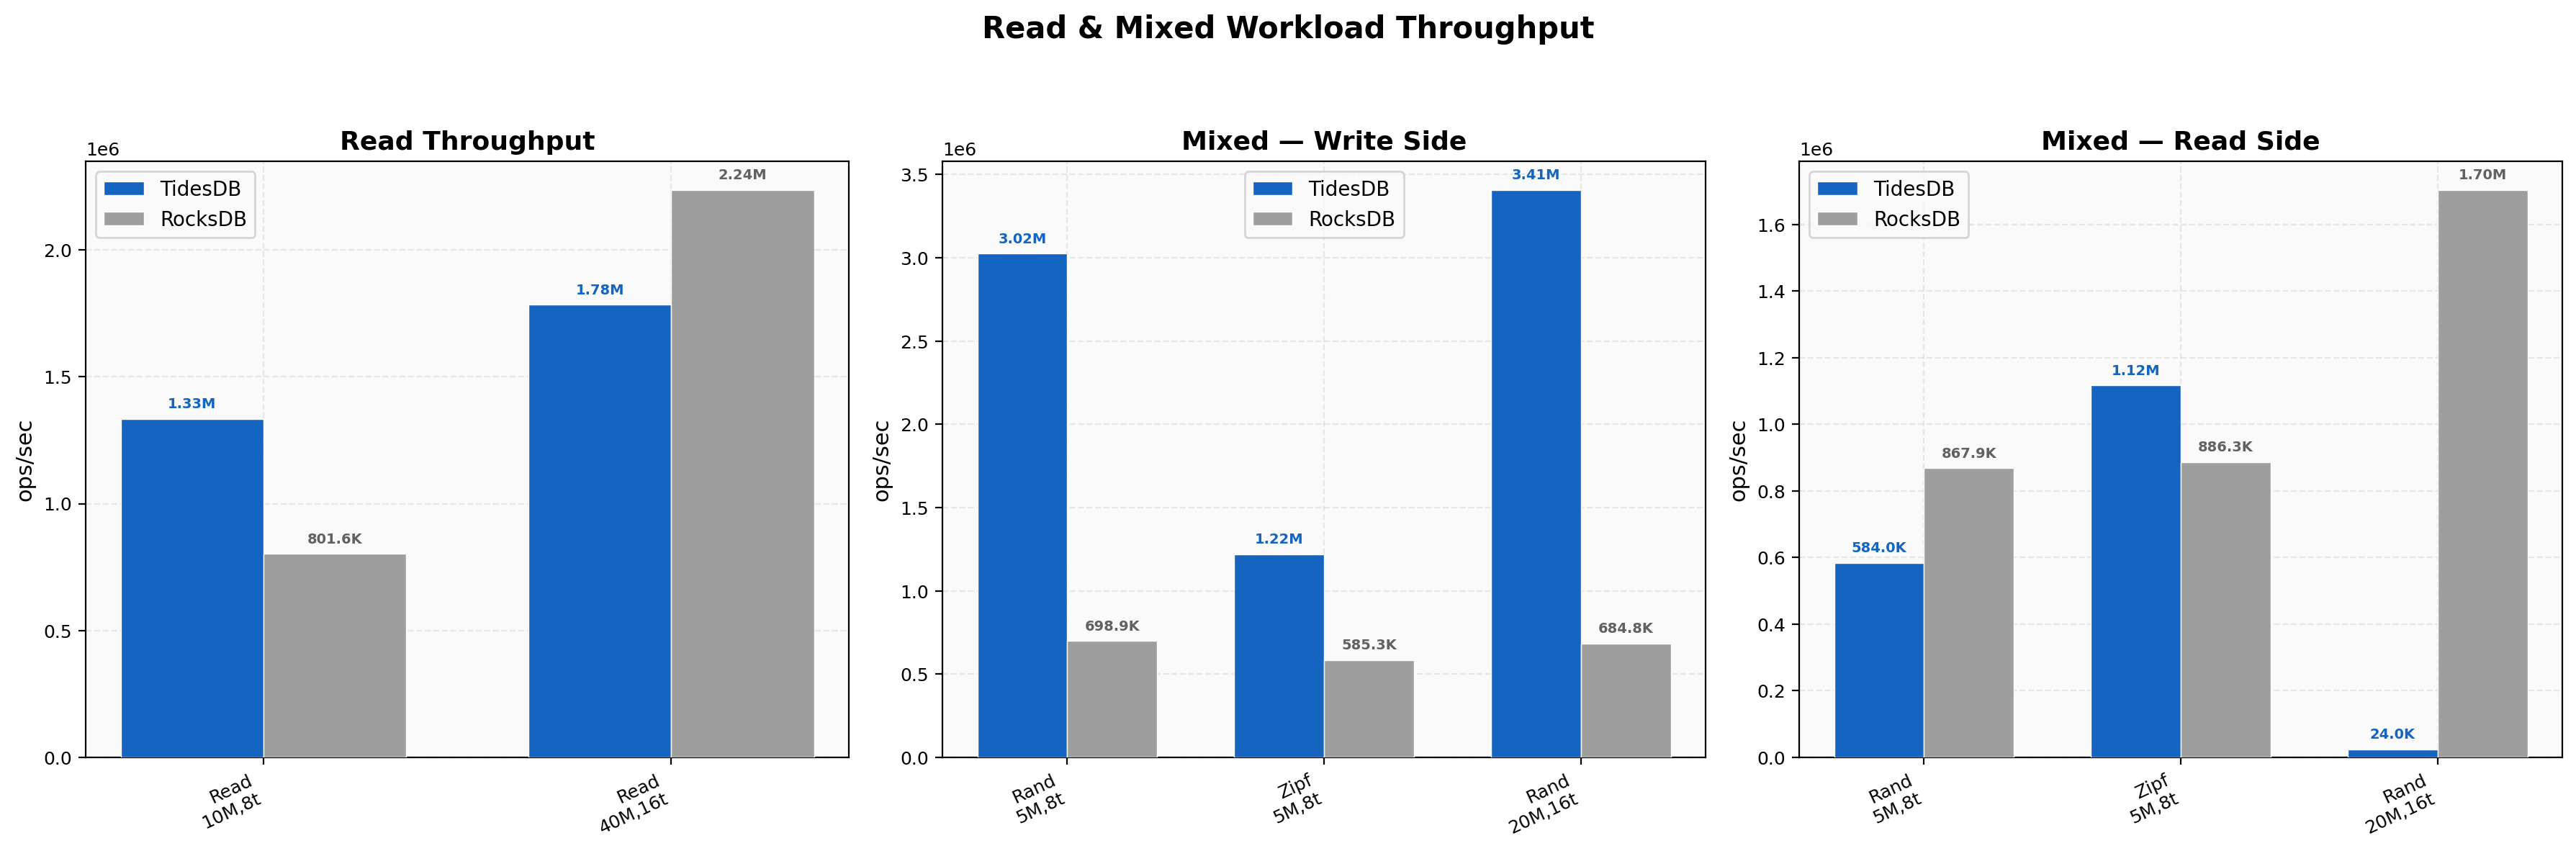
Read & Mixed Workload Throughput
Random reads at 8 threads hit 1.33M vs 802K (1.66x). At 16 threads with 40M keys, RocksDB pulls ahead at 2.24M vs 1.78M. This reversal appears to be memory-pressure related since TidesDB’s peak RSS hits 27 GB on the 40M populate phase and the subsequent read phase likely contends with residual background work. Mixed random PUT side is strong at 3.02M vs 699K (4.33x) at 8 threads, but the GET side drops to 584K vs 868K (0.67x) as concurrent writes consume bandwidth. Zipfian mixed reads remain in TidesDB’s favor at 1.12M vs 886K (1.26x).
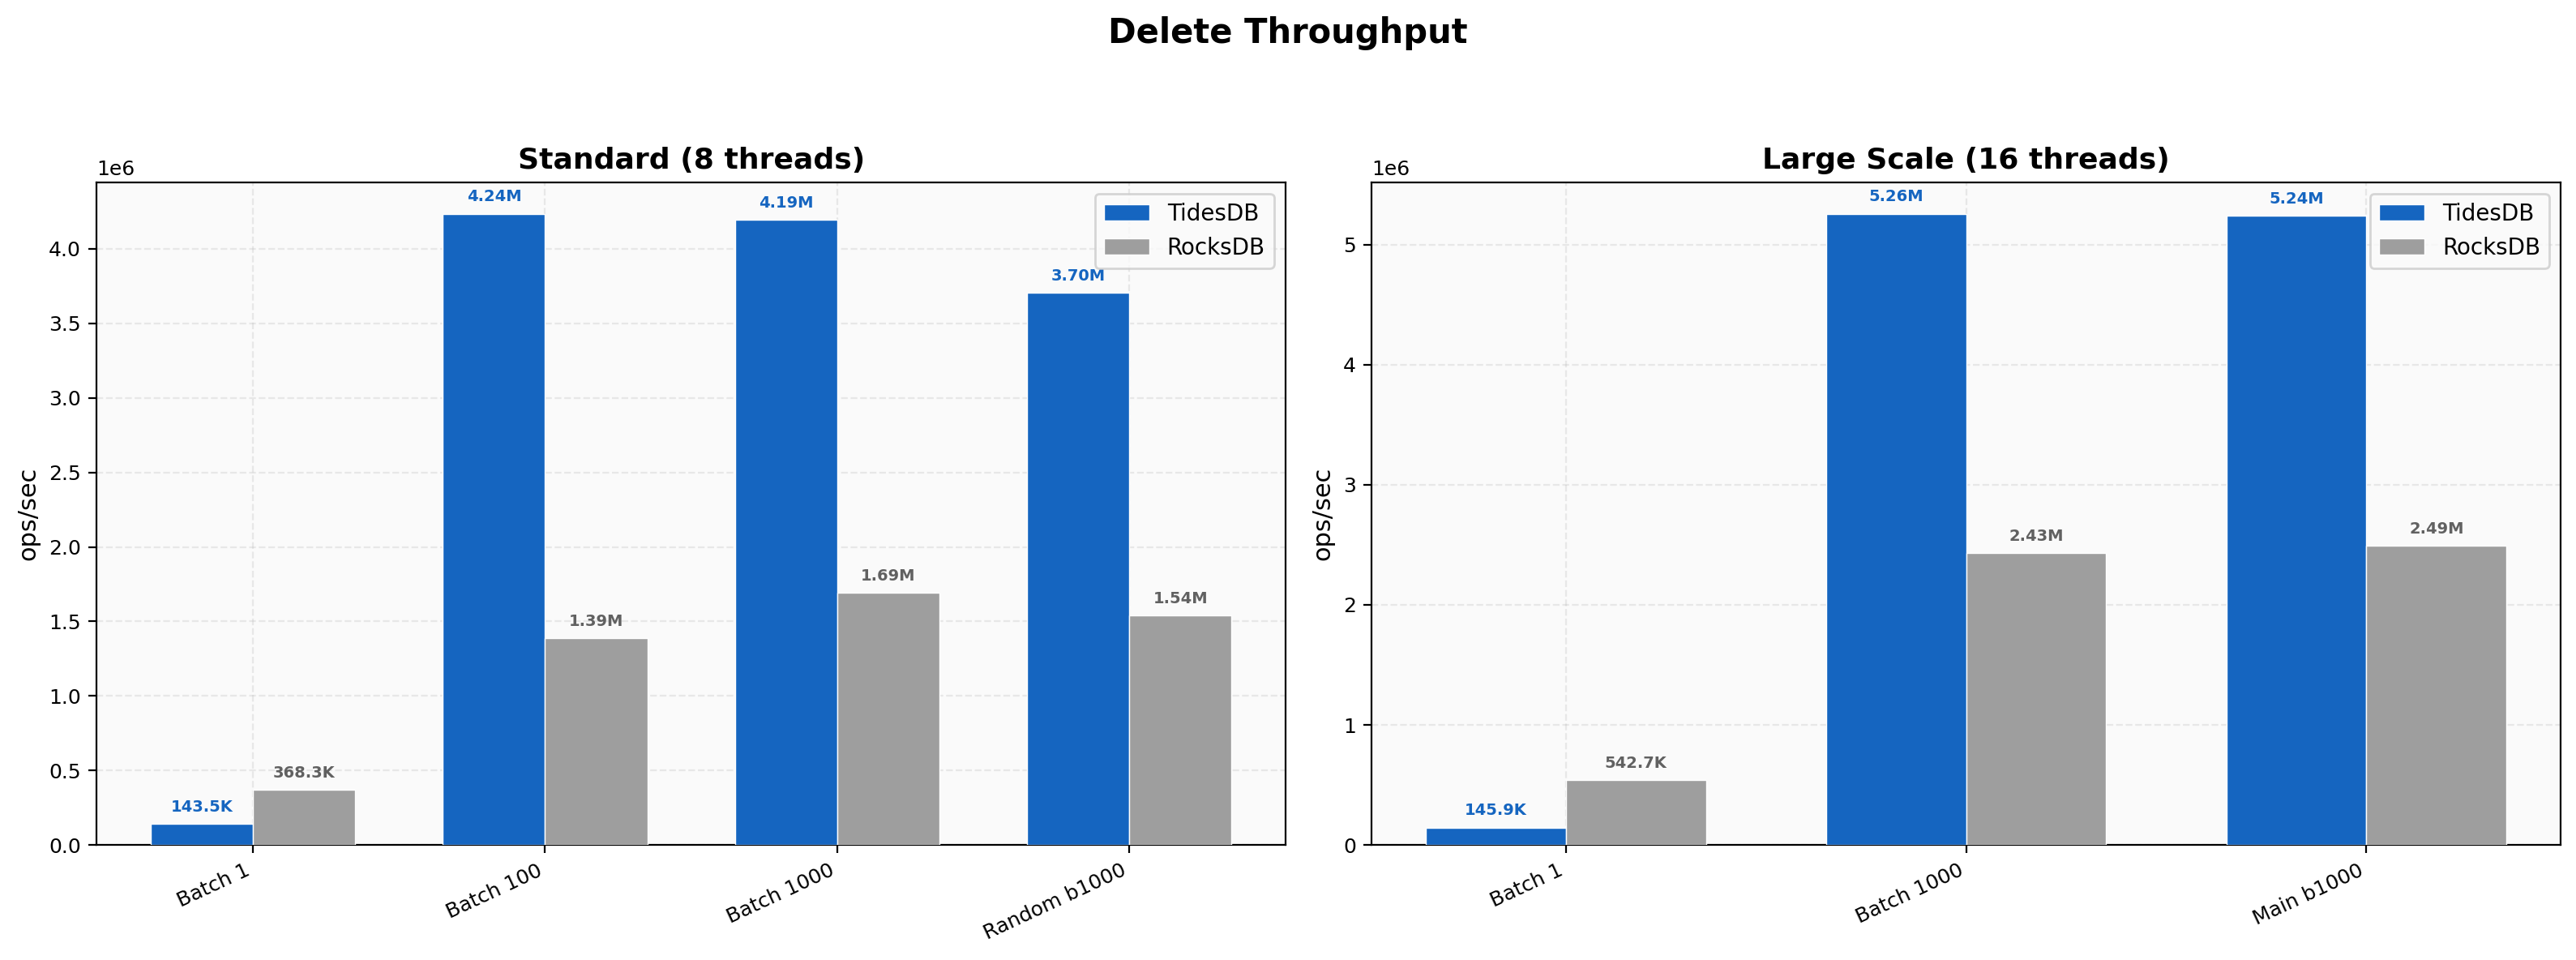
Delete Throughput
Same pattern as Environment 1 where single-key deletes favor RocksDB (144K vs 368K, 0.39x) and batched deletes favor TidesDB. Batch 100 hits 4.24M vs 1.39M (3.05x), batch 1000 hits 4.19M vs 1.69M (2.47x). At 16 threads the batch-1000 delete test hits 5.26M vs 2.43M (2.16x).
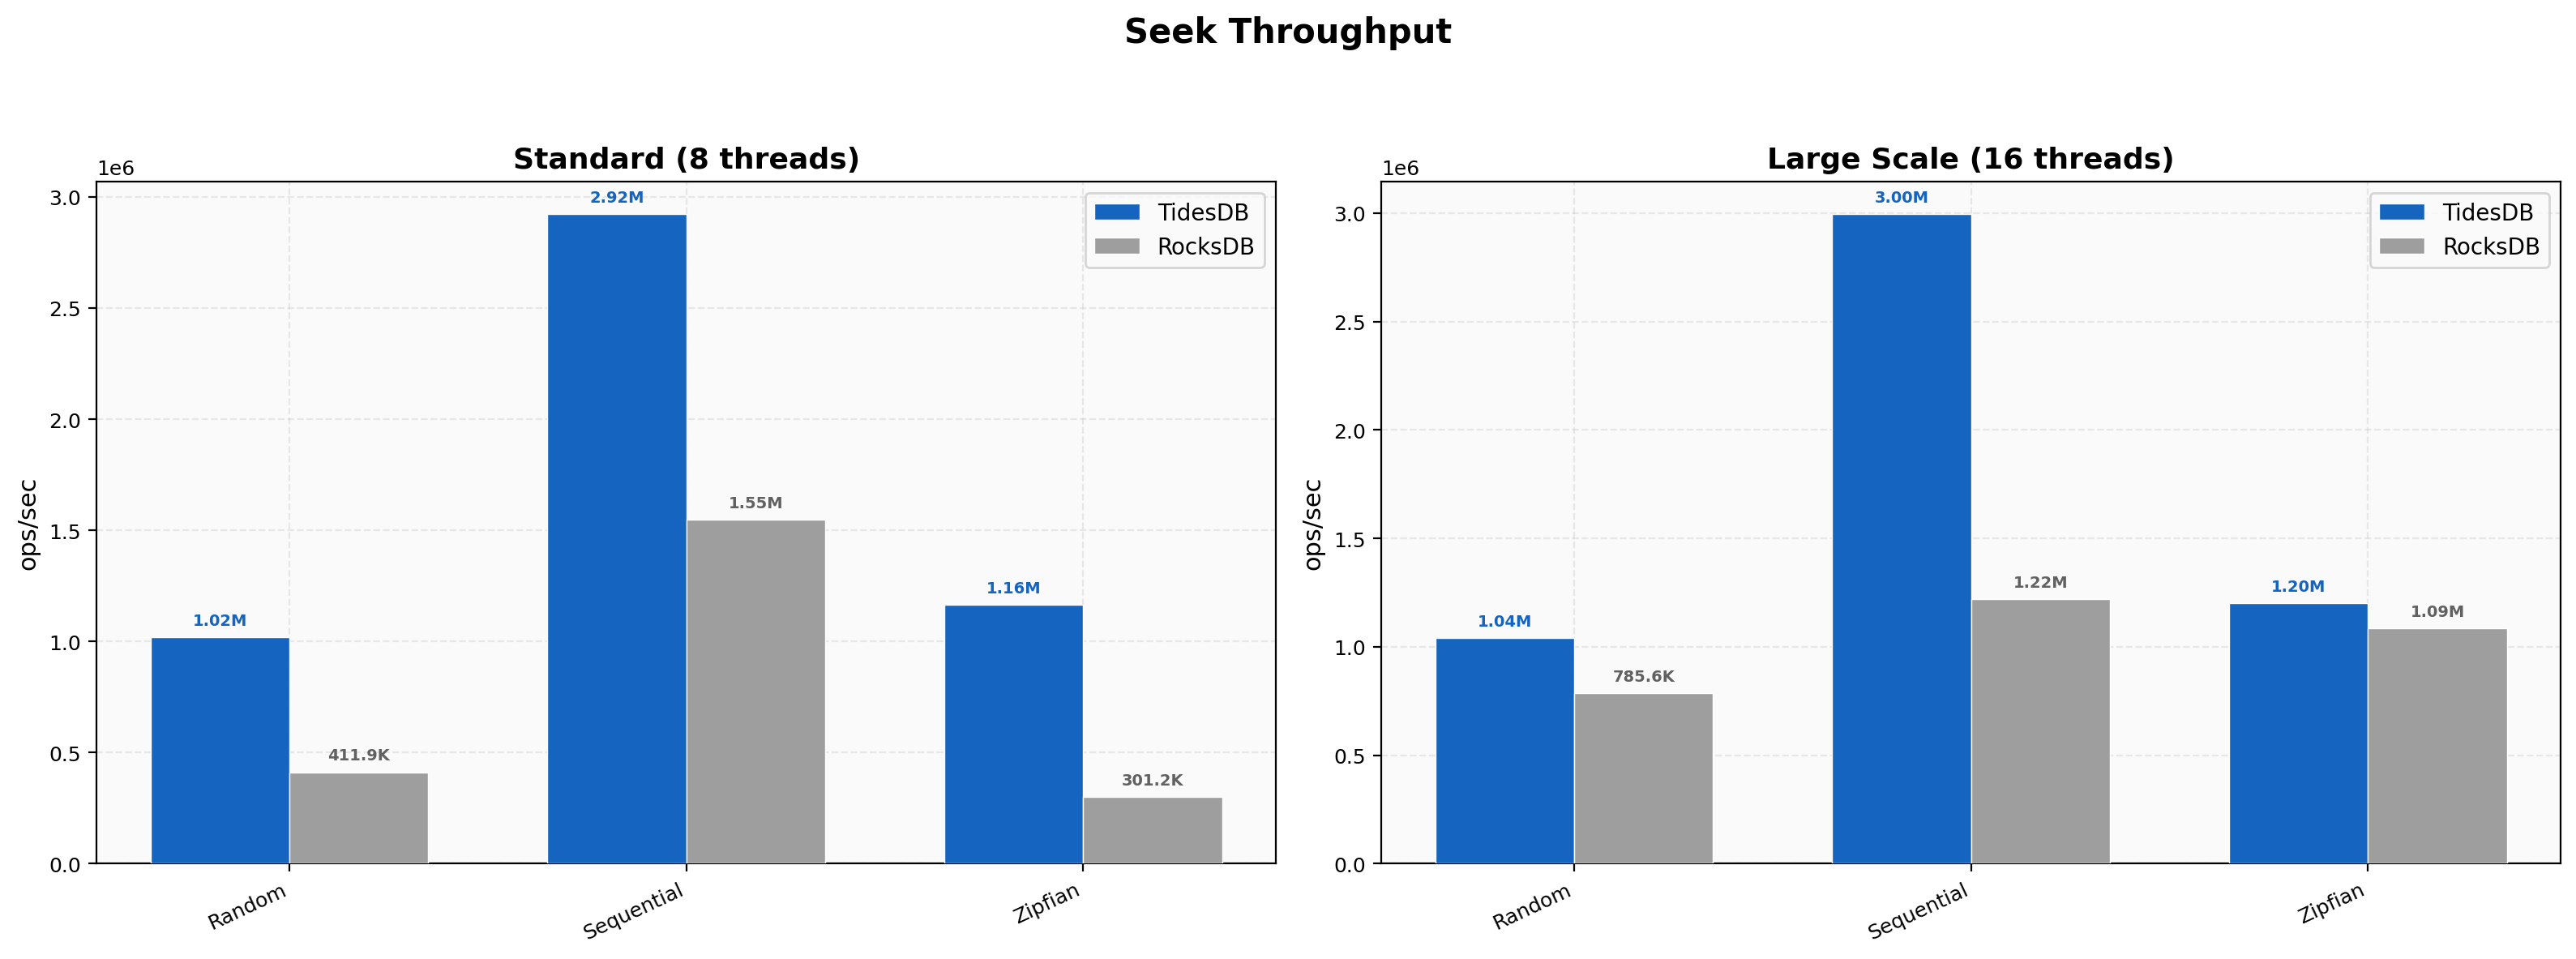
Seek Throughput
Random seeks hit 1.02M vs 412K (2.48x), sequential 2.92M vs 1.55M (1.89x), and Zipfian 1.16M vs 301K (3.87x). At 16-thread large scale, sequential seeks reach 3.00M vs 1.22M (2.46x). Zipfian seeks at 16 threads narrow to 1.20M vs 1.09M (1.11x) as RocksDB’s block cache warms up effectively on the larger dataset.
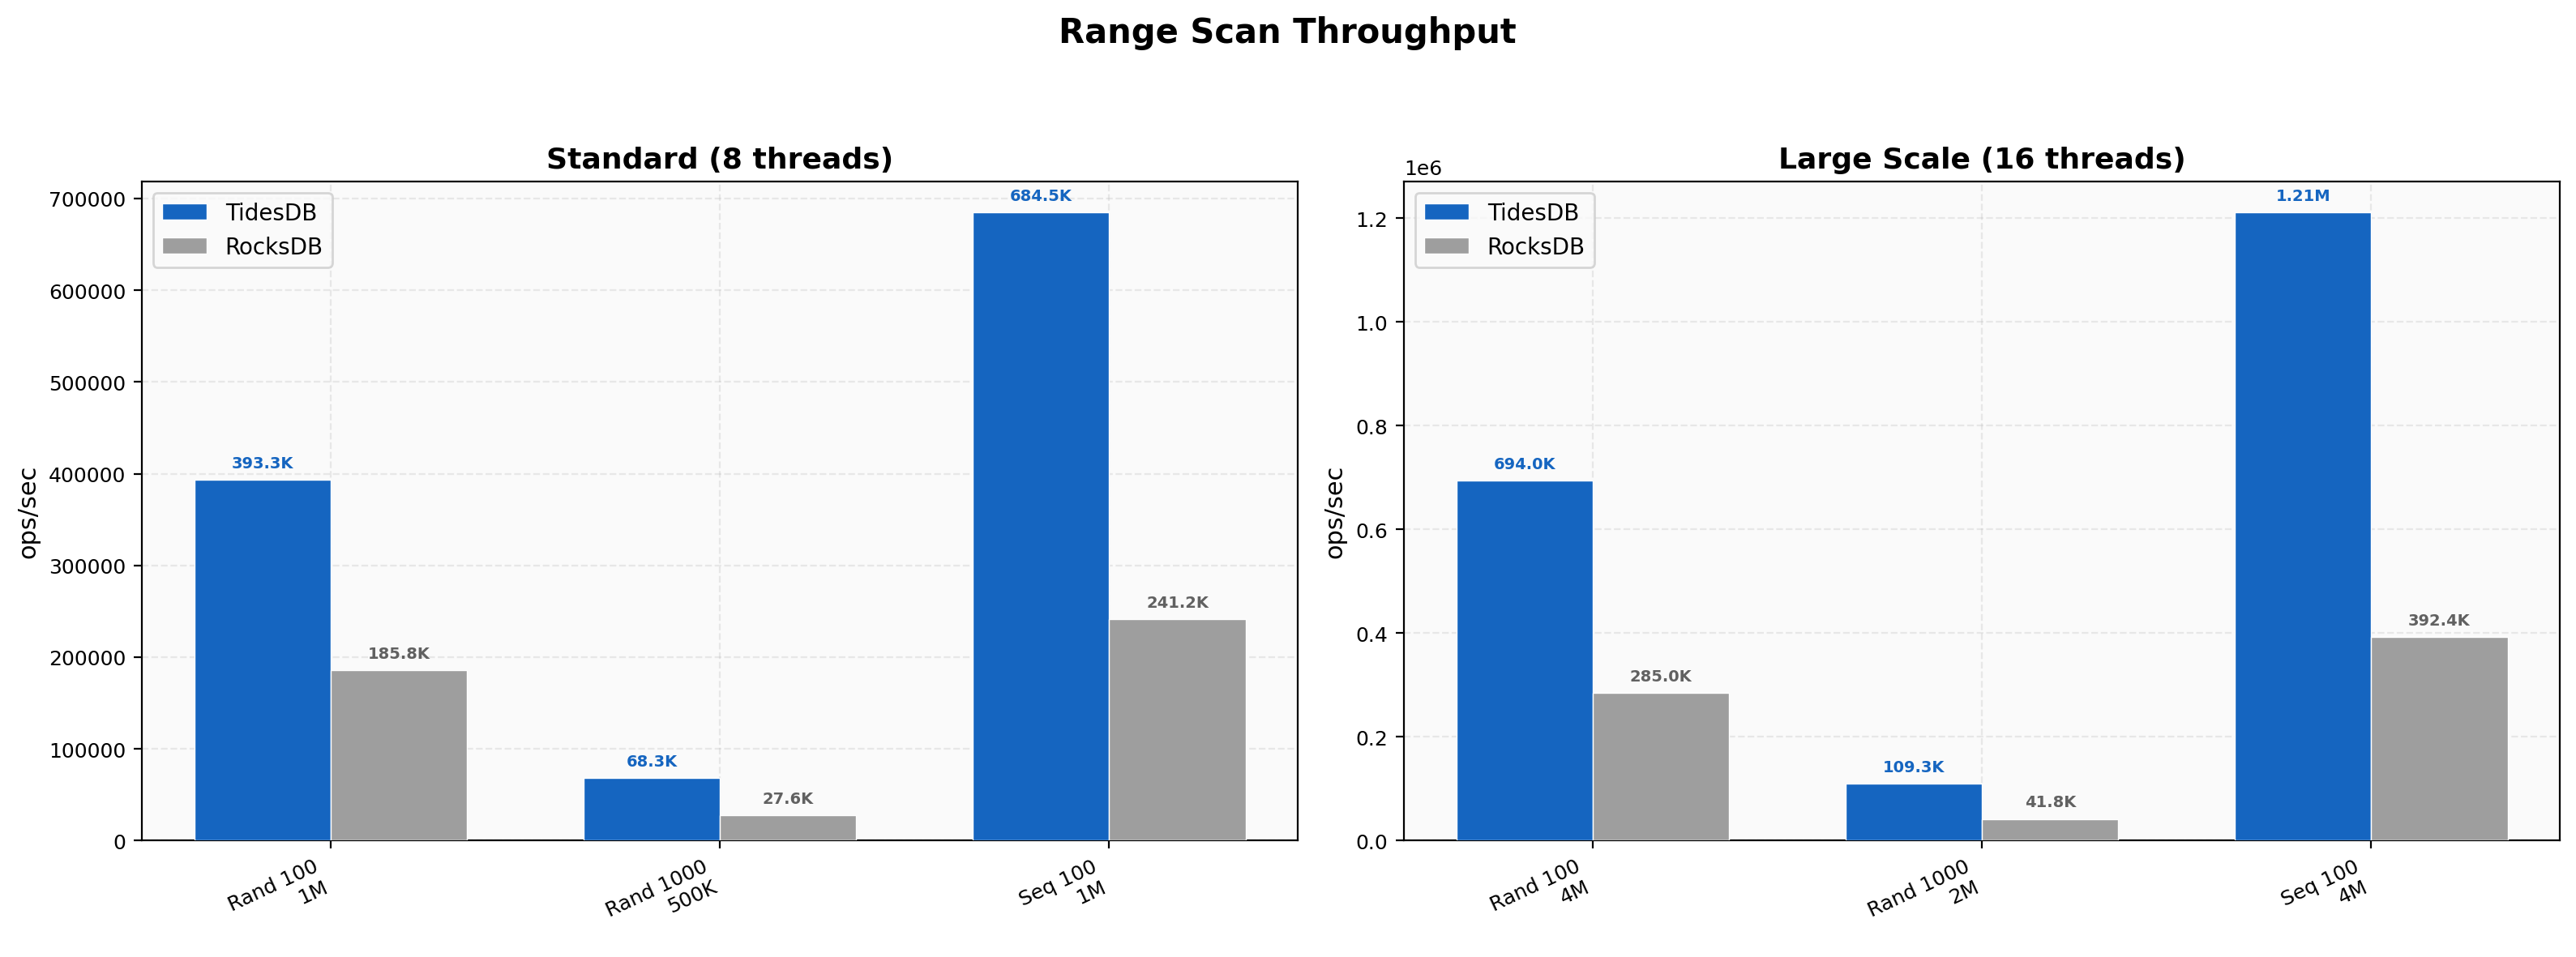
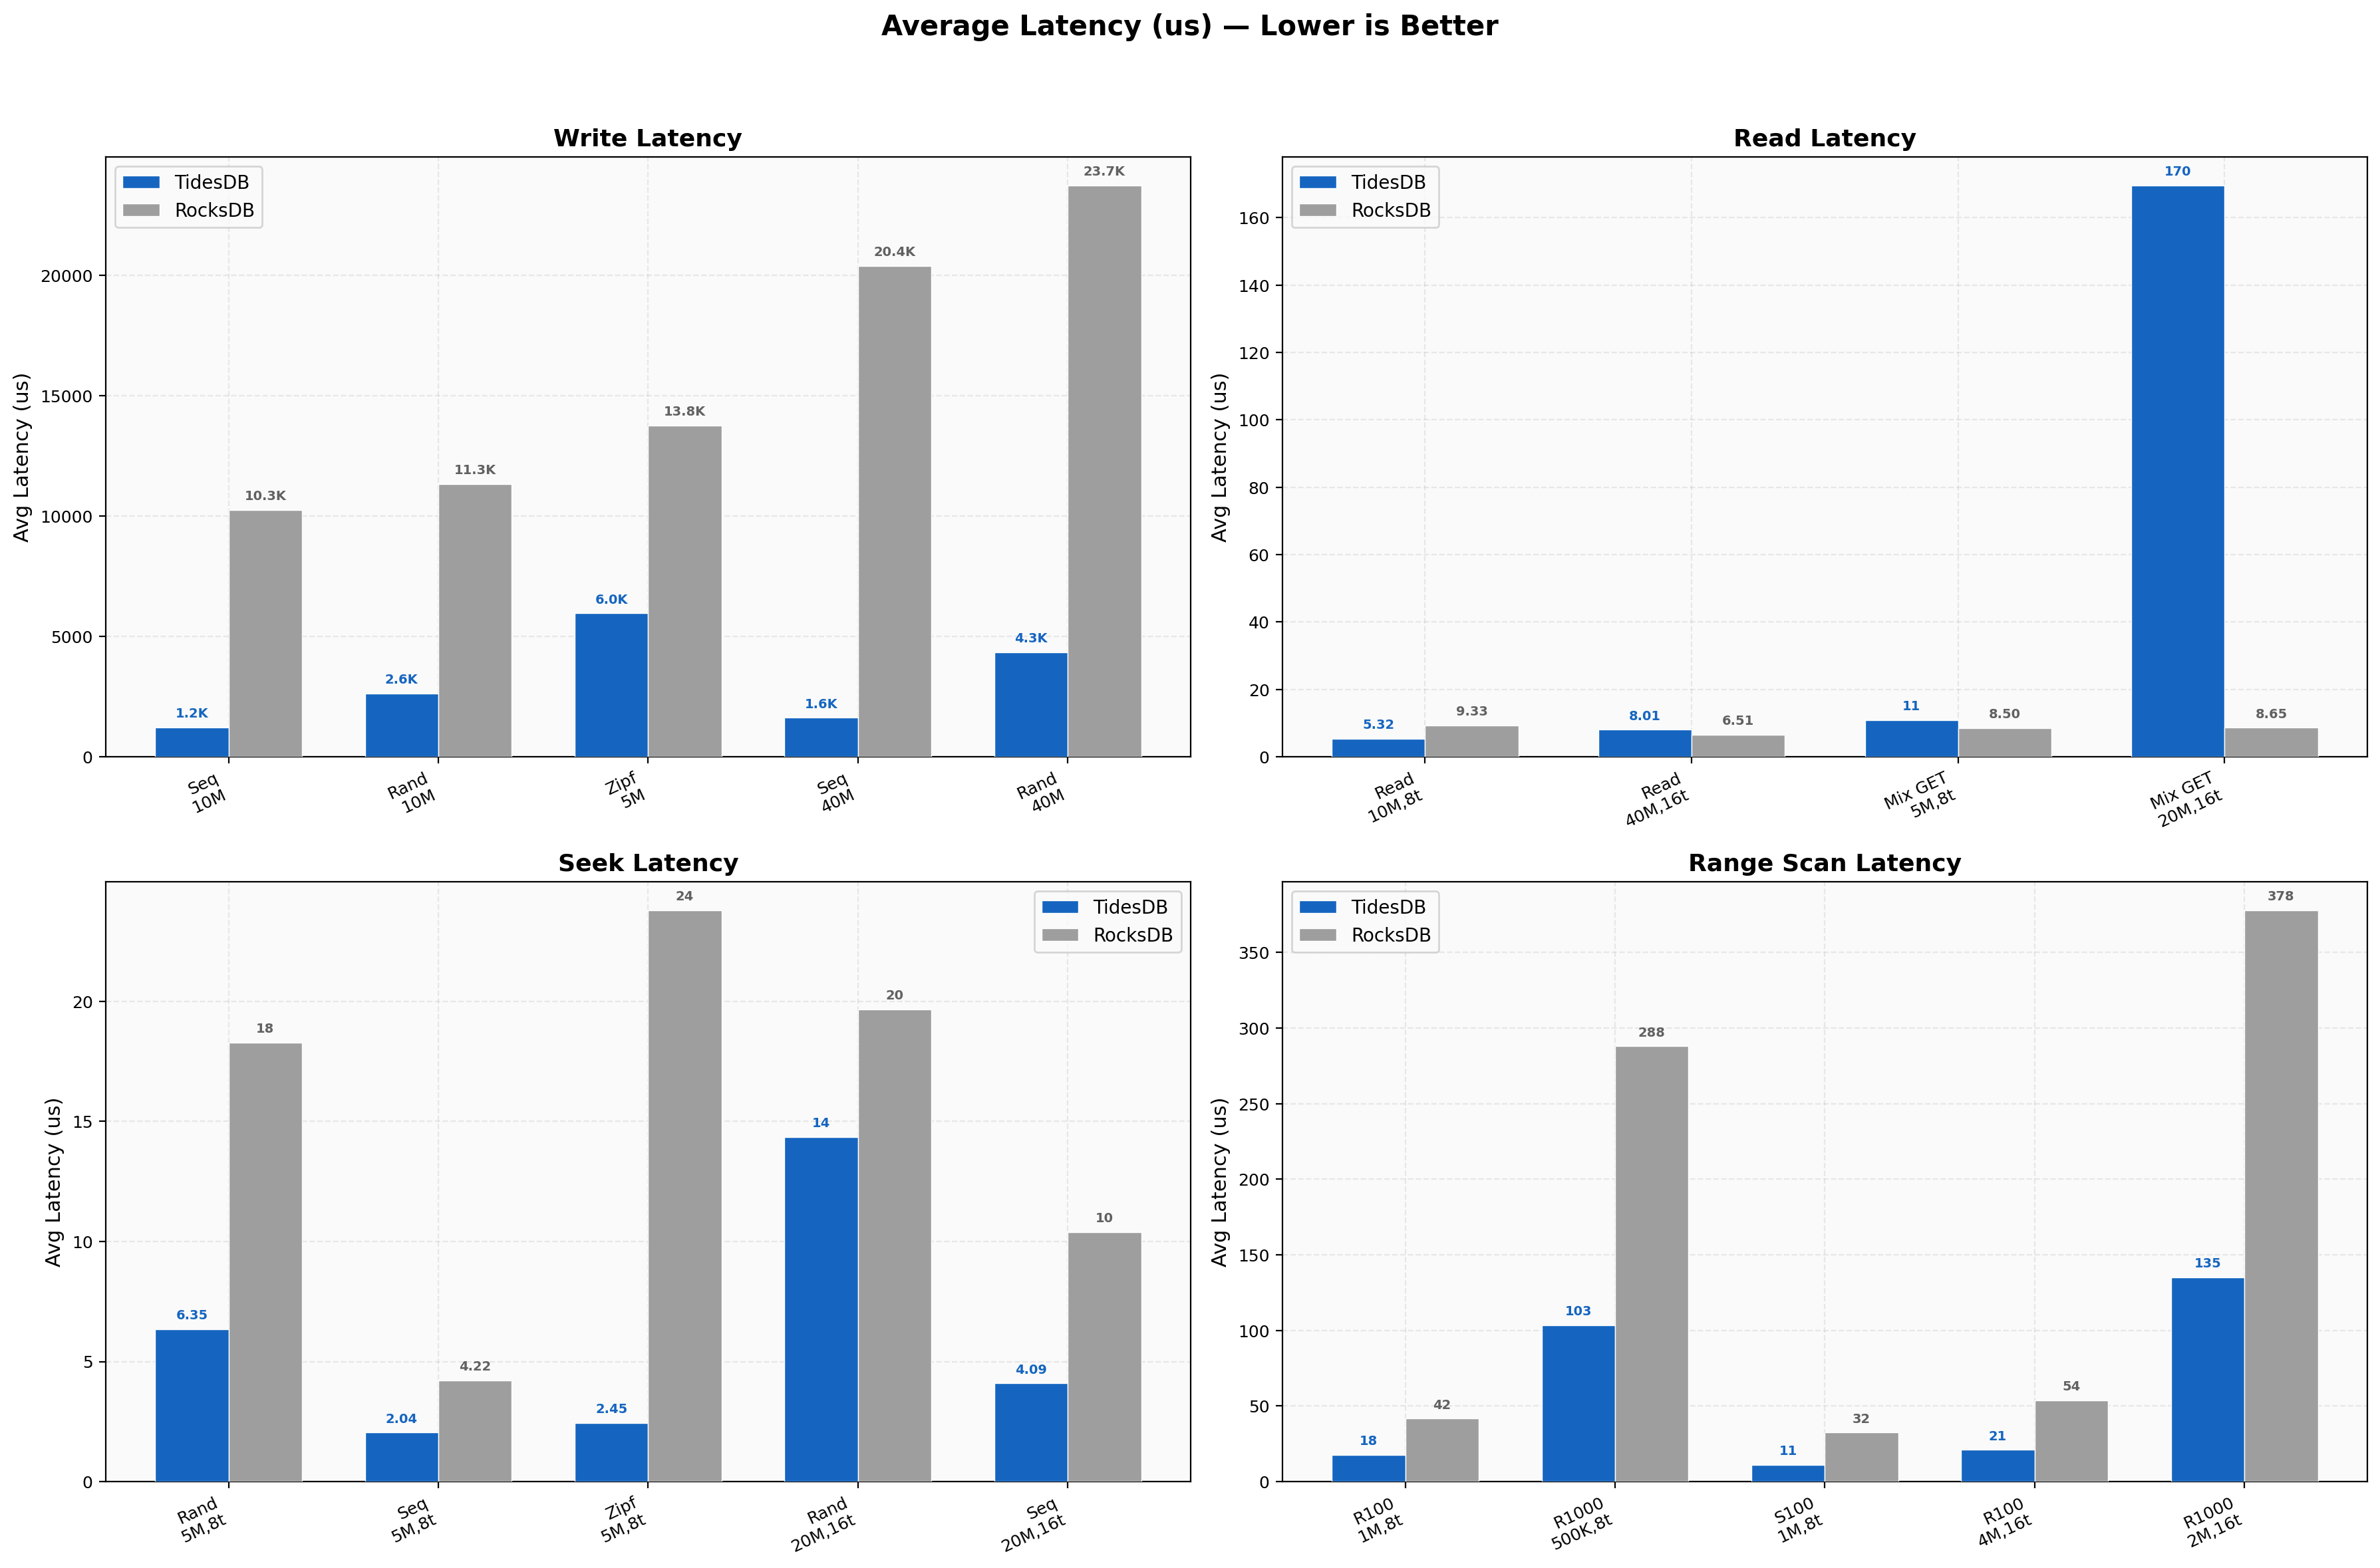
Range Scan Throughput
Random 100-key scans hit 393K vs 186K (2.12x), 1000-key 68.3K vs 27.6K (2.48x), and sequential 100-key 684K vs 241K (2.84x). At 16 threads, sequential 100-key scans scale to 1.21M vs 392K (3.09x) and random 1000-key to 109K vs 41.8K (2.62x). Range advantages hold steady or improve at scale.
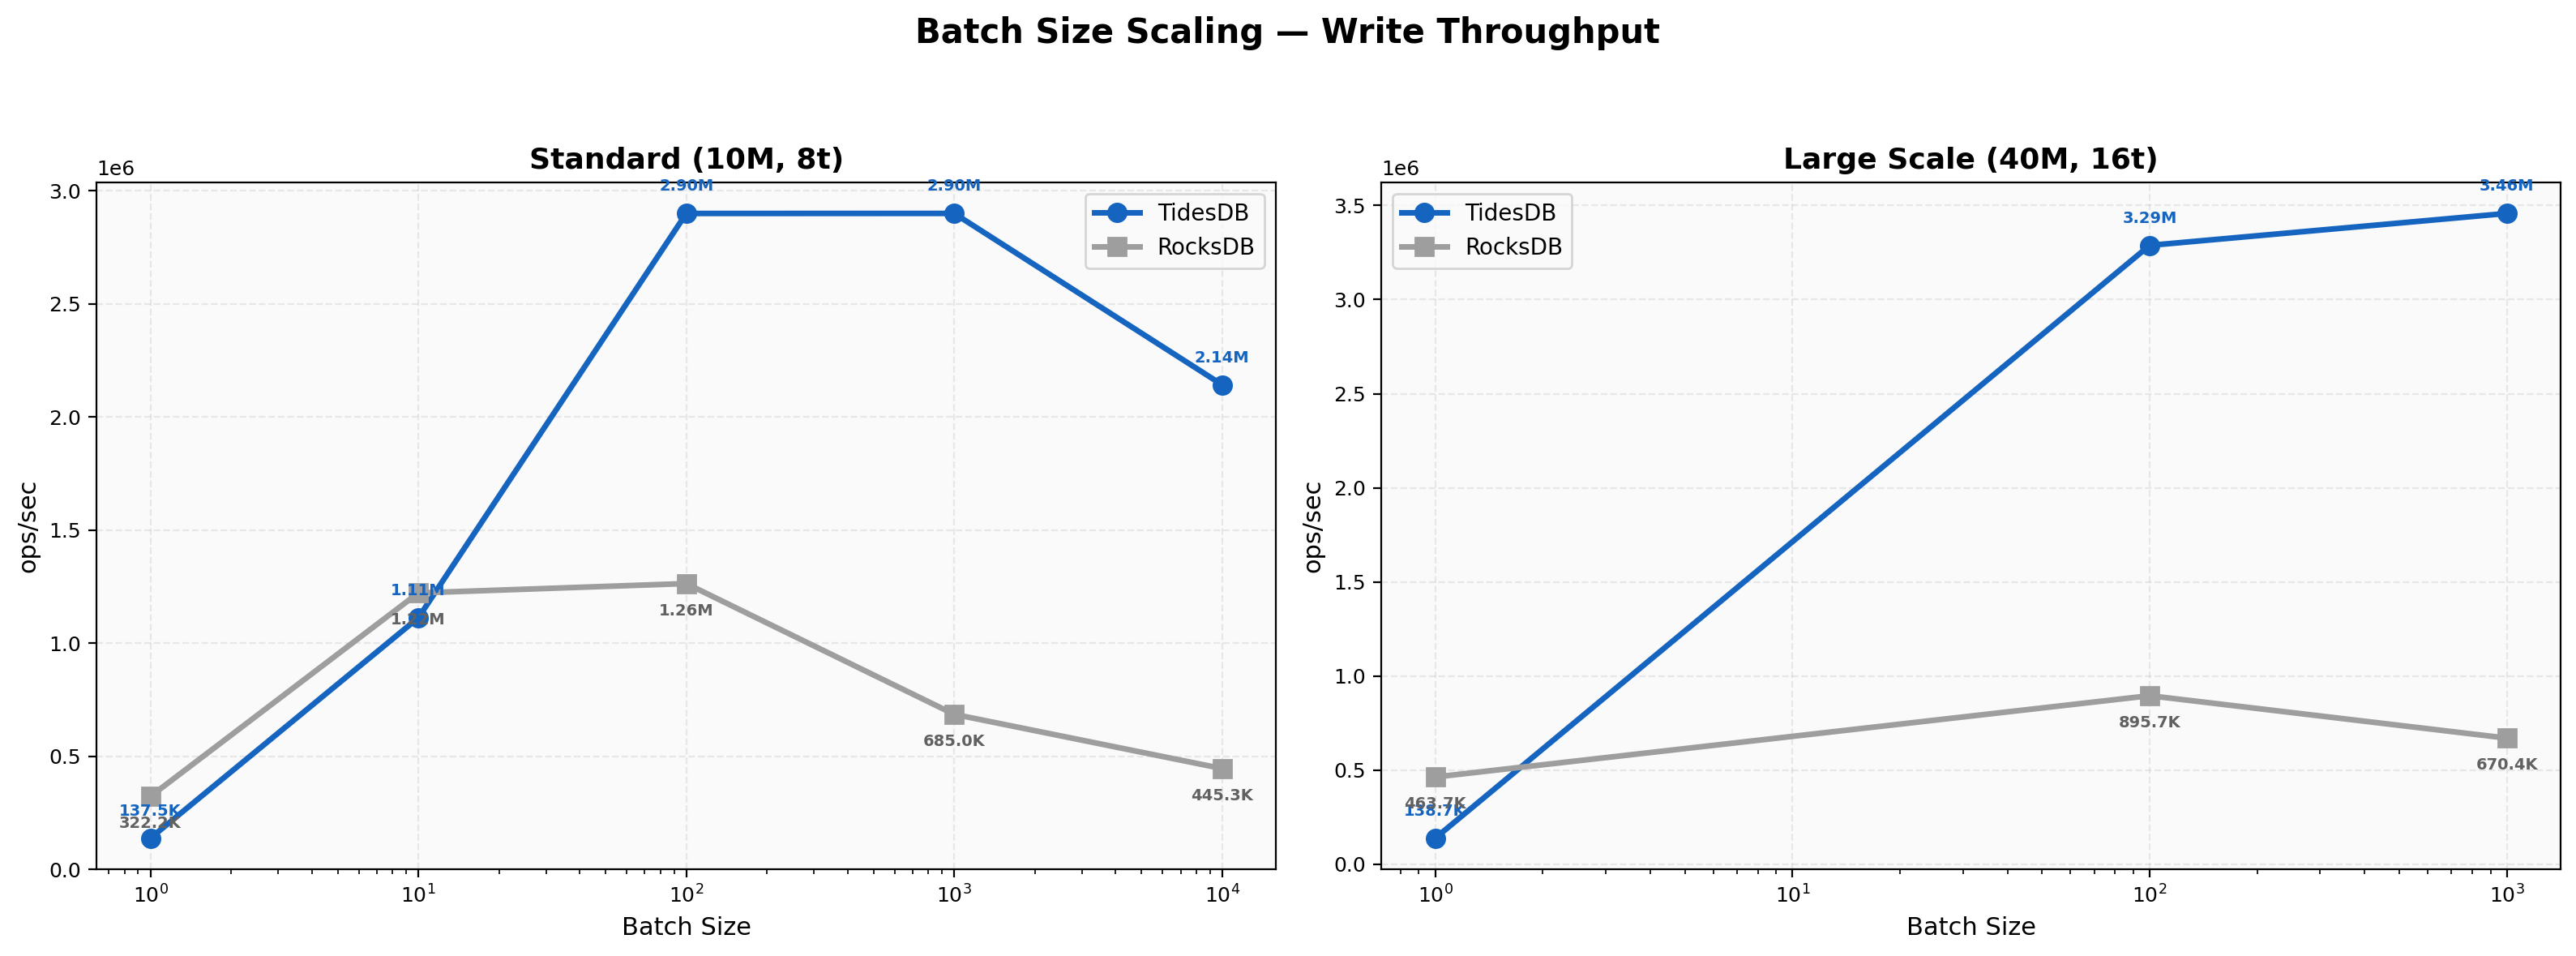
Batch Size Scaling
At batch 1, RocksDB leads at 322K vs 138K (0.43x). At batch 10, RocksDB is still slightly ahead at 1.22M vs 1.11M (0.91x). Crossover happens at batch 100 with 2.90M vs 1.26M (2.30x). The advantage keeps growing, with batch 1000 at 4.23x and batch 10000 at 4.81x. At 16 threads the ratios widen further, batch 1000 hitting 3.46M vs 670K (5.16x). The crossover point is later here than in Environment 1 (batch 100 vs batch 10), which suggests the higher thread count and NVMe speed let RocksDB’s single-key path stay rather competitive longer.
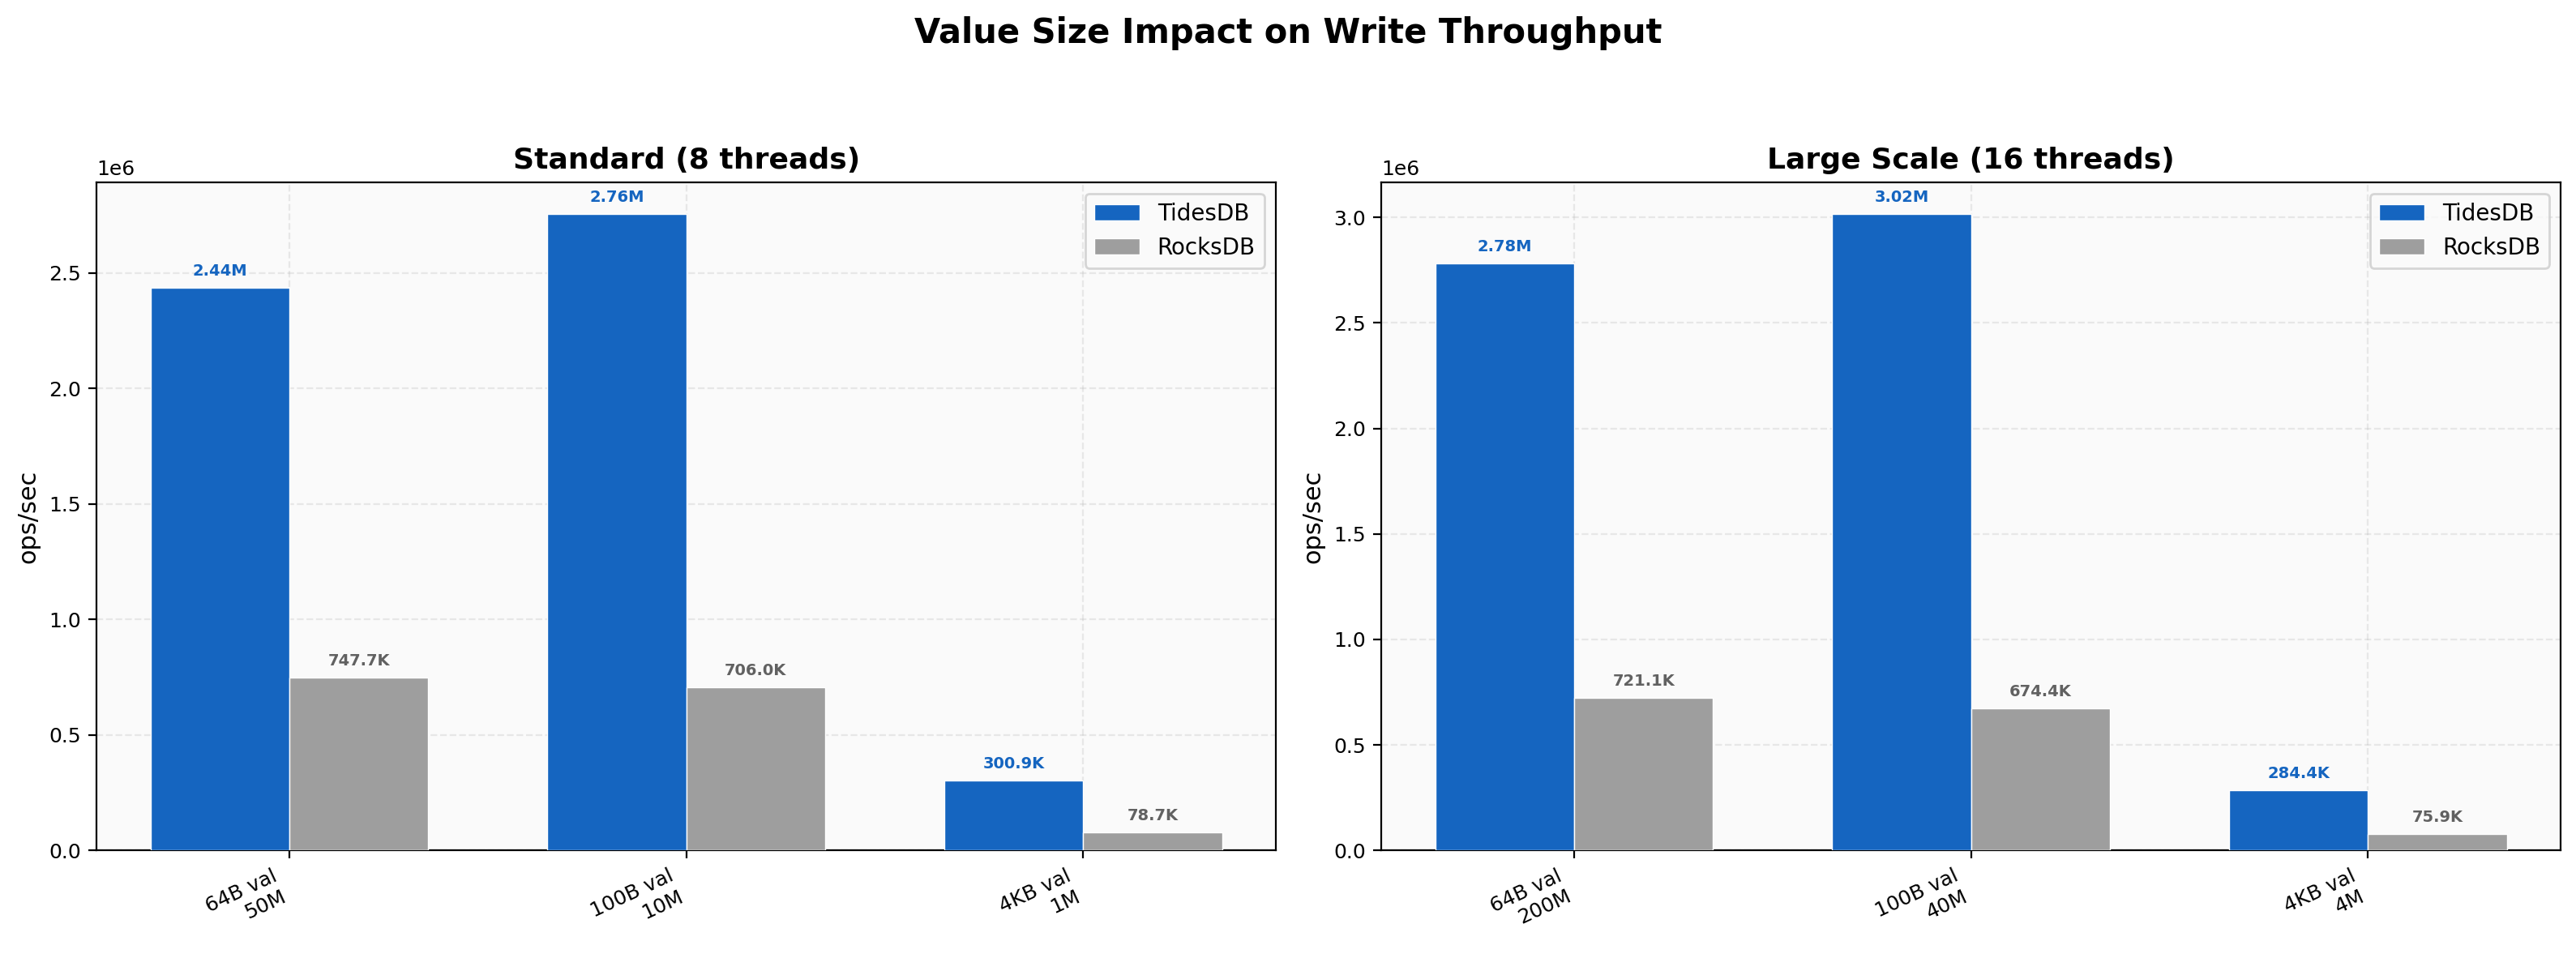
Value Size Impact
TidesDB’s advantage scales with value size, from 3.26x at 64B (50M keys) to 3.91x at 100B (10M keys) to 3.82x at 4KB (1M keys). At 16 threads the large-value test (4M keys, 4KB) hits 284K vs 75.9K (3.74x) and the 200M small-value test reaches 2.78M vs 721K (3.86x). RocksDB’s p99 on 4KB values is 876,024 µs, nearly a full second, while TidesDB’s is 55,373 µs.
Latency Overview
Write latencies for sequential average 1,223 µs vs 10,257 µs (8.4x), random 2,629 µs vs 11,326 µs. At 16 threads, sequential write latency is 1,624 µs vs 20,383 µs. Read latencies for random reads are 5.32 µs vs 9.33 µs at 8 threads. Seek latencies for random are 6.35 µs vs 18.29 µs, Zipfian 2.45 µs vs 23.79 µs (~10x). Range scans go from 17.6 µs to 103 µs for TidesDB versus 41.6 µs to 288 µs for RocksDB.
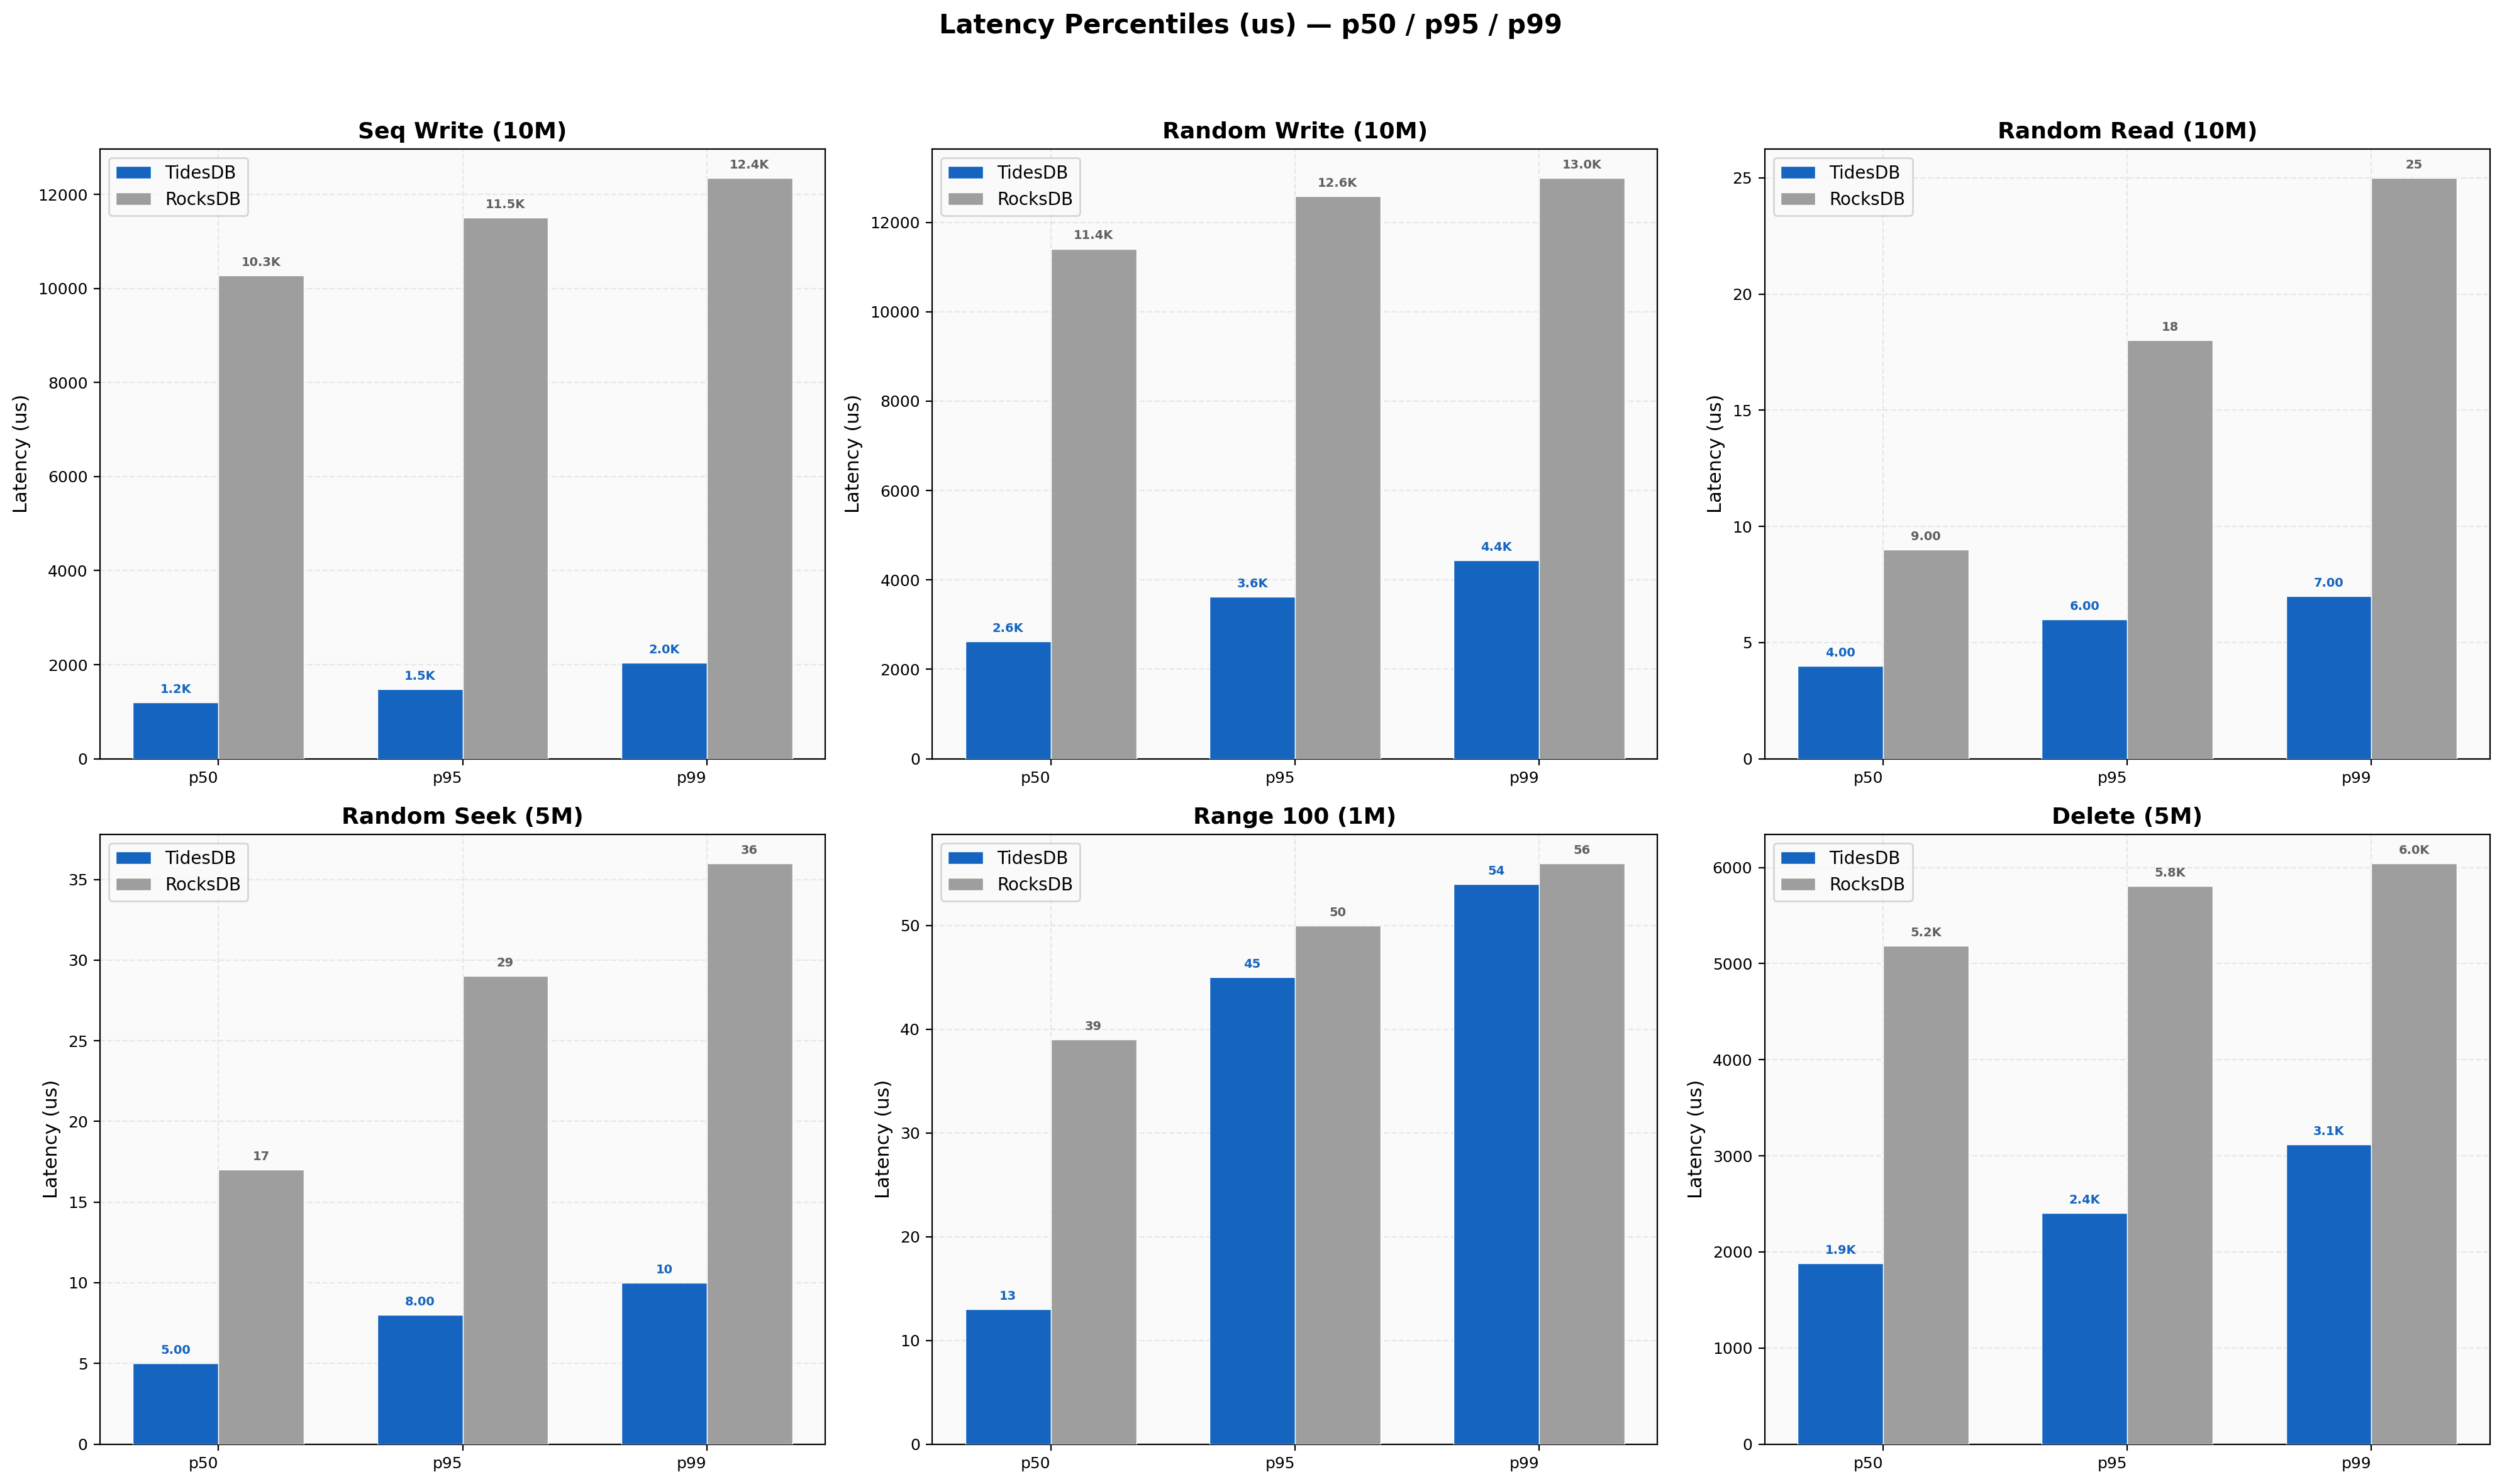
Latency Percentiles
Sequential writes at 8 threads show TidesDB p50 1,194 µs, p99 2,035 µs (ratio 1.70x) versus RocksDB p50 10,279 µs, p99 12,354 µs (ratio 1.20x). Random reads show TidesDB at 4/6/7 µs for p50/p95/p99 vs RocksDB at 9/18/25 µs. Delete batch-1 p99 is TidesDB 68 µs vs RocksDB 28 µs.
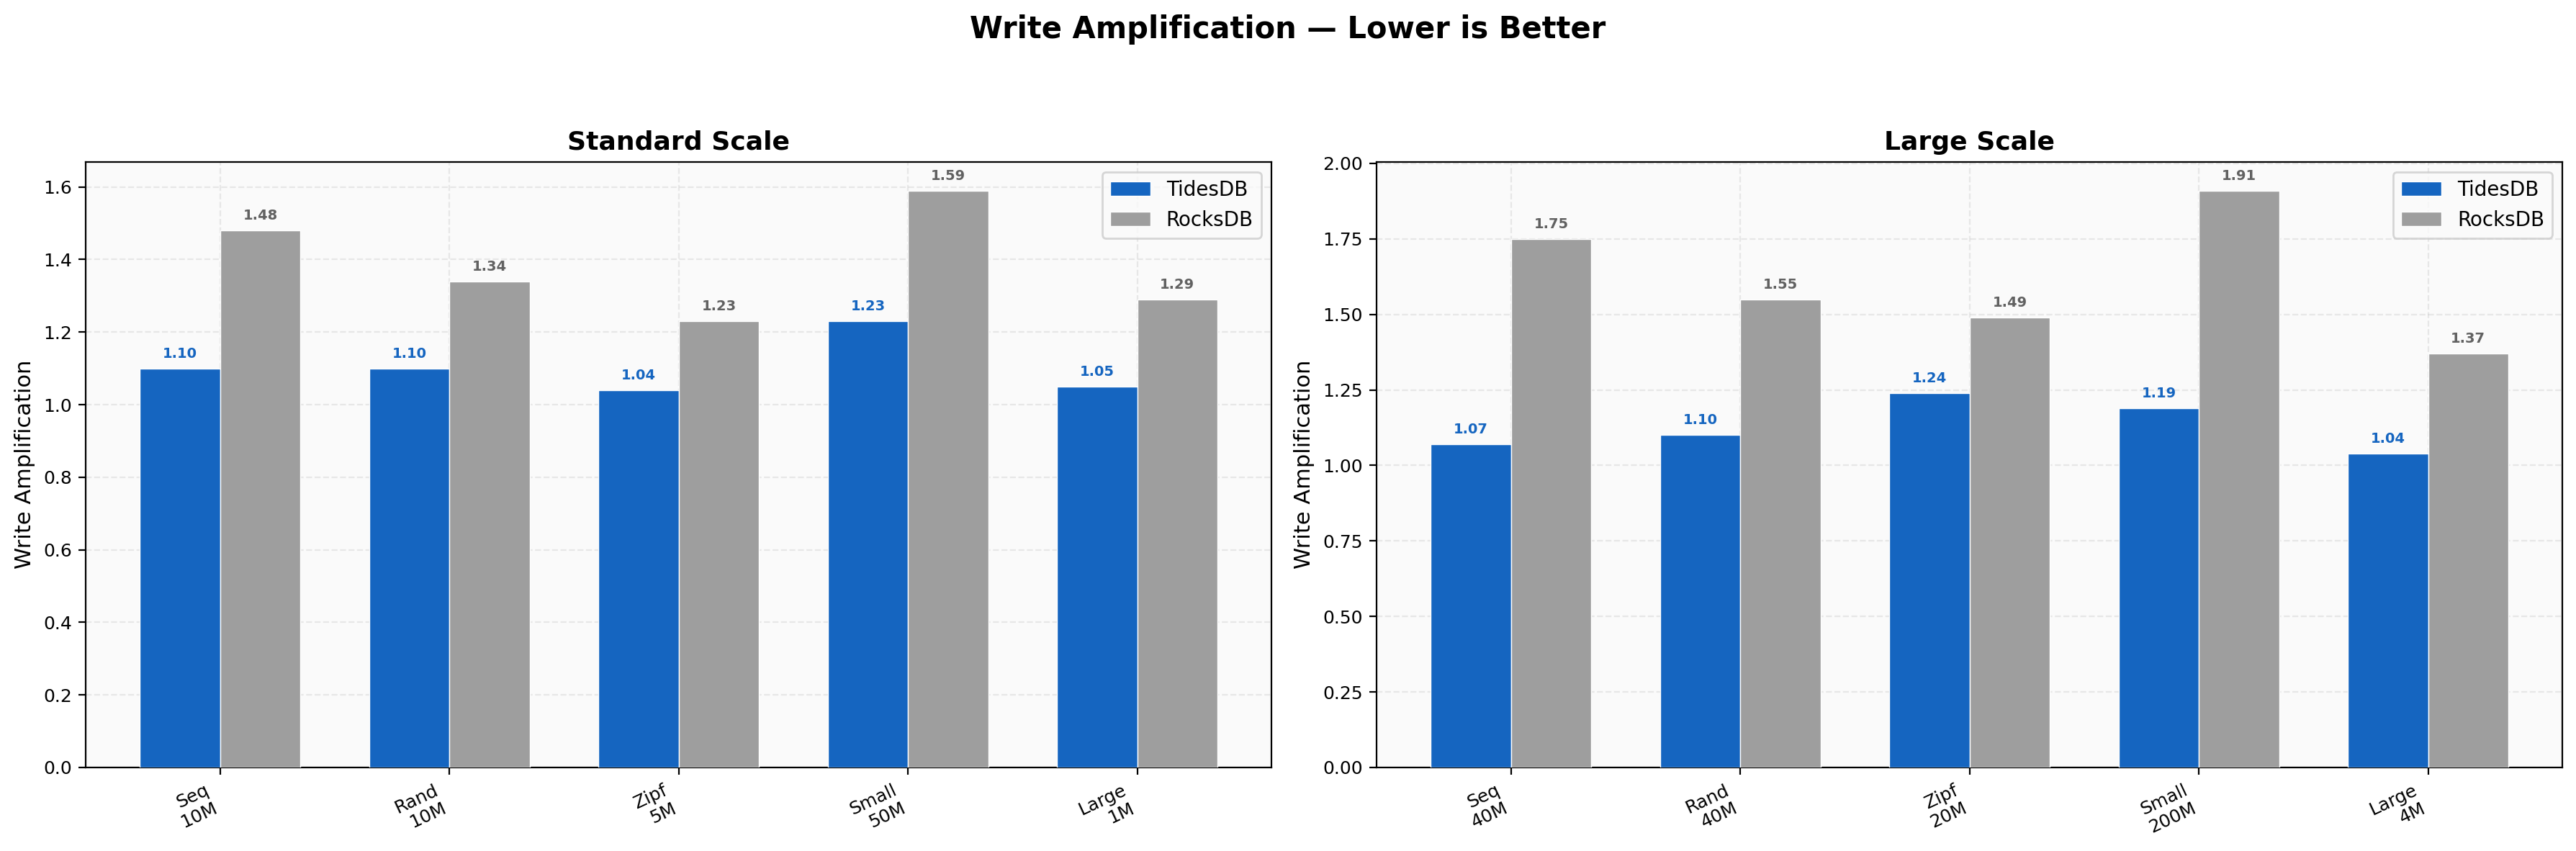
Write Amplification
TidesDB ranges 1.04-1.23 across all workloads while RocksDB ranges 1.23-1.75. The gap is wider here than in Environment 1, with RocksDB’s sequential write amplification at 16 threads hitting 1.75 (versus 1.07 for TidesDB). Zipfian remains the tightest at 1.04 for TidesDB.
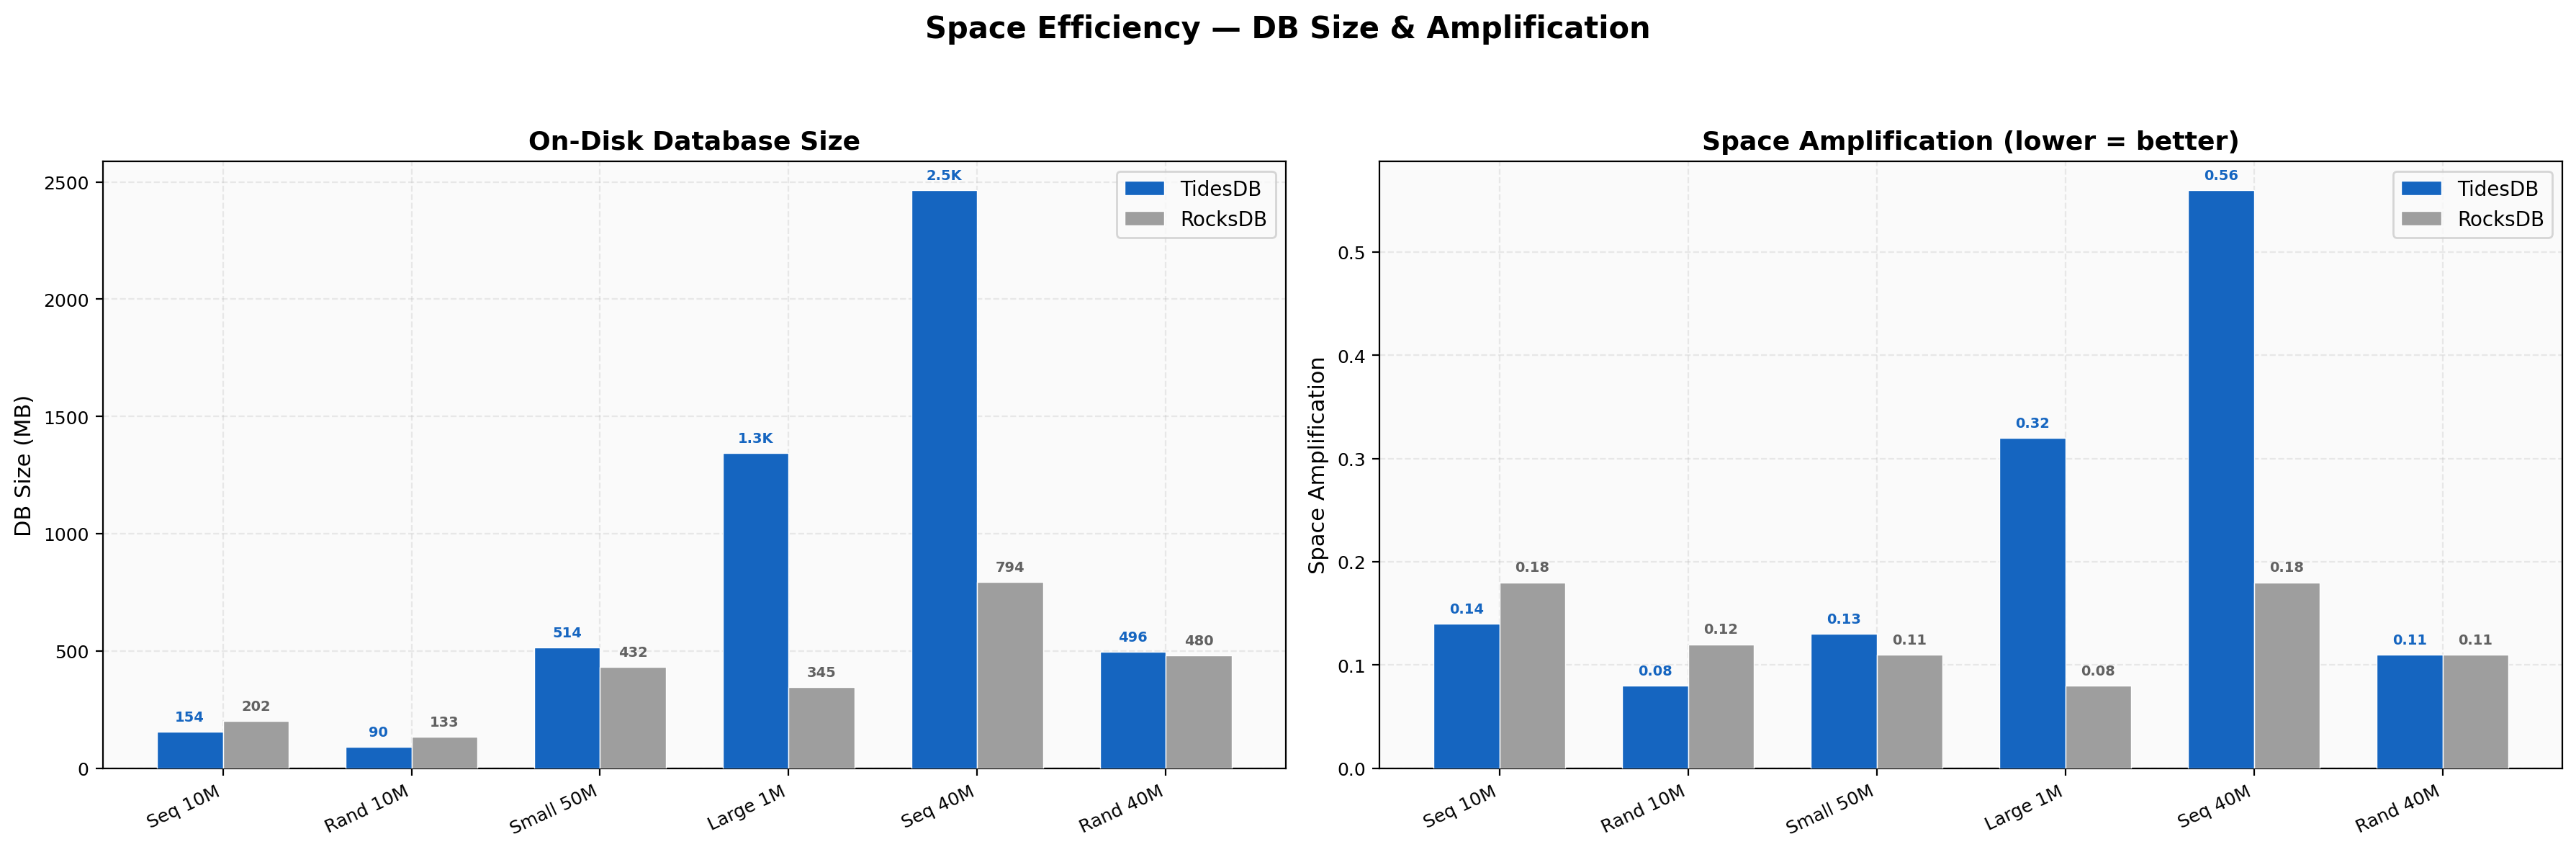
Space Efficiency
Sequential 10M shows TidesDB at 154 MB vs RocksDB at 202 MB (24% smaller), random 10M at 90 MB vs 133 MB (32% smaller). At 16-thread 40M sequential the numbers are 2,465 MB vs 794 MB, where TidesDB is larger because it retains more sorted runs before compaction catches up at high ingest rates. Small-value 50M lands at 514 MB vs 432 MB (19% larger for TidesDB). The space trade-off is more nuanced on this faster hardware since at extreme ingest speeds, TidesDB’s compaction lag shows up as transient higher disk usage.
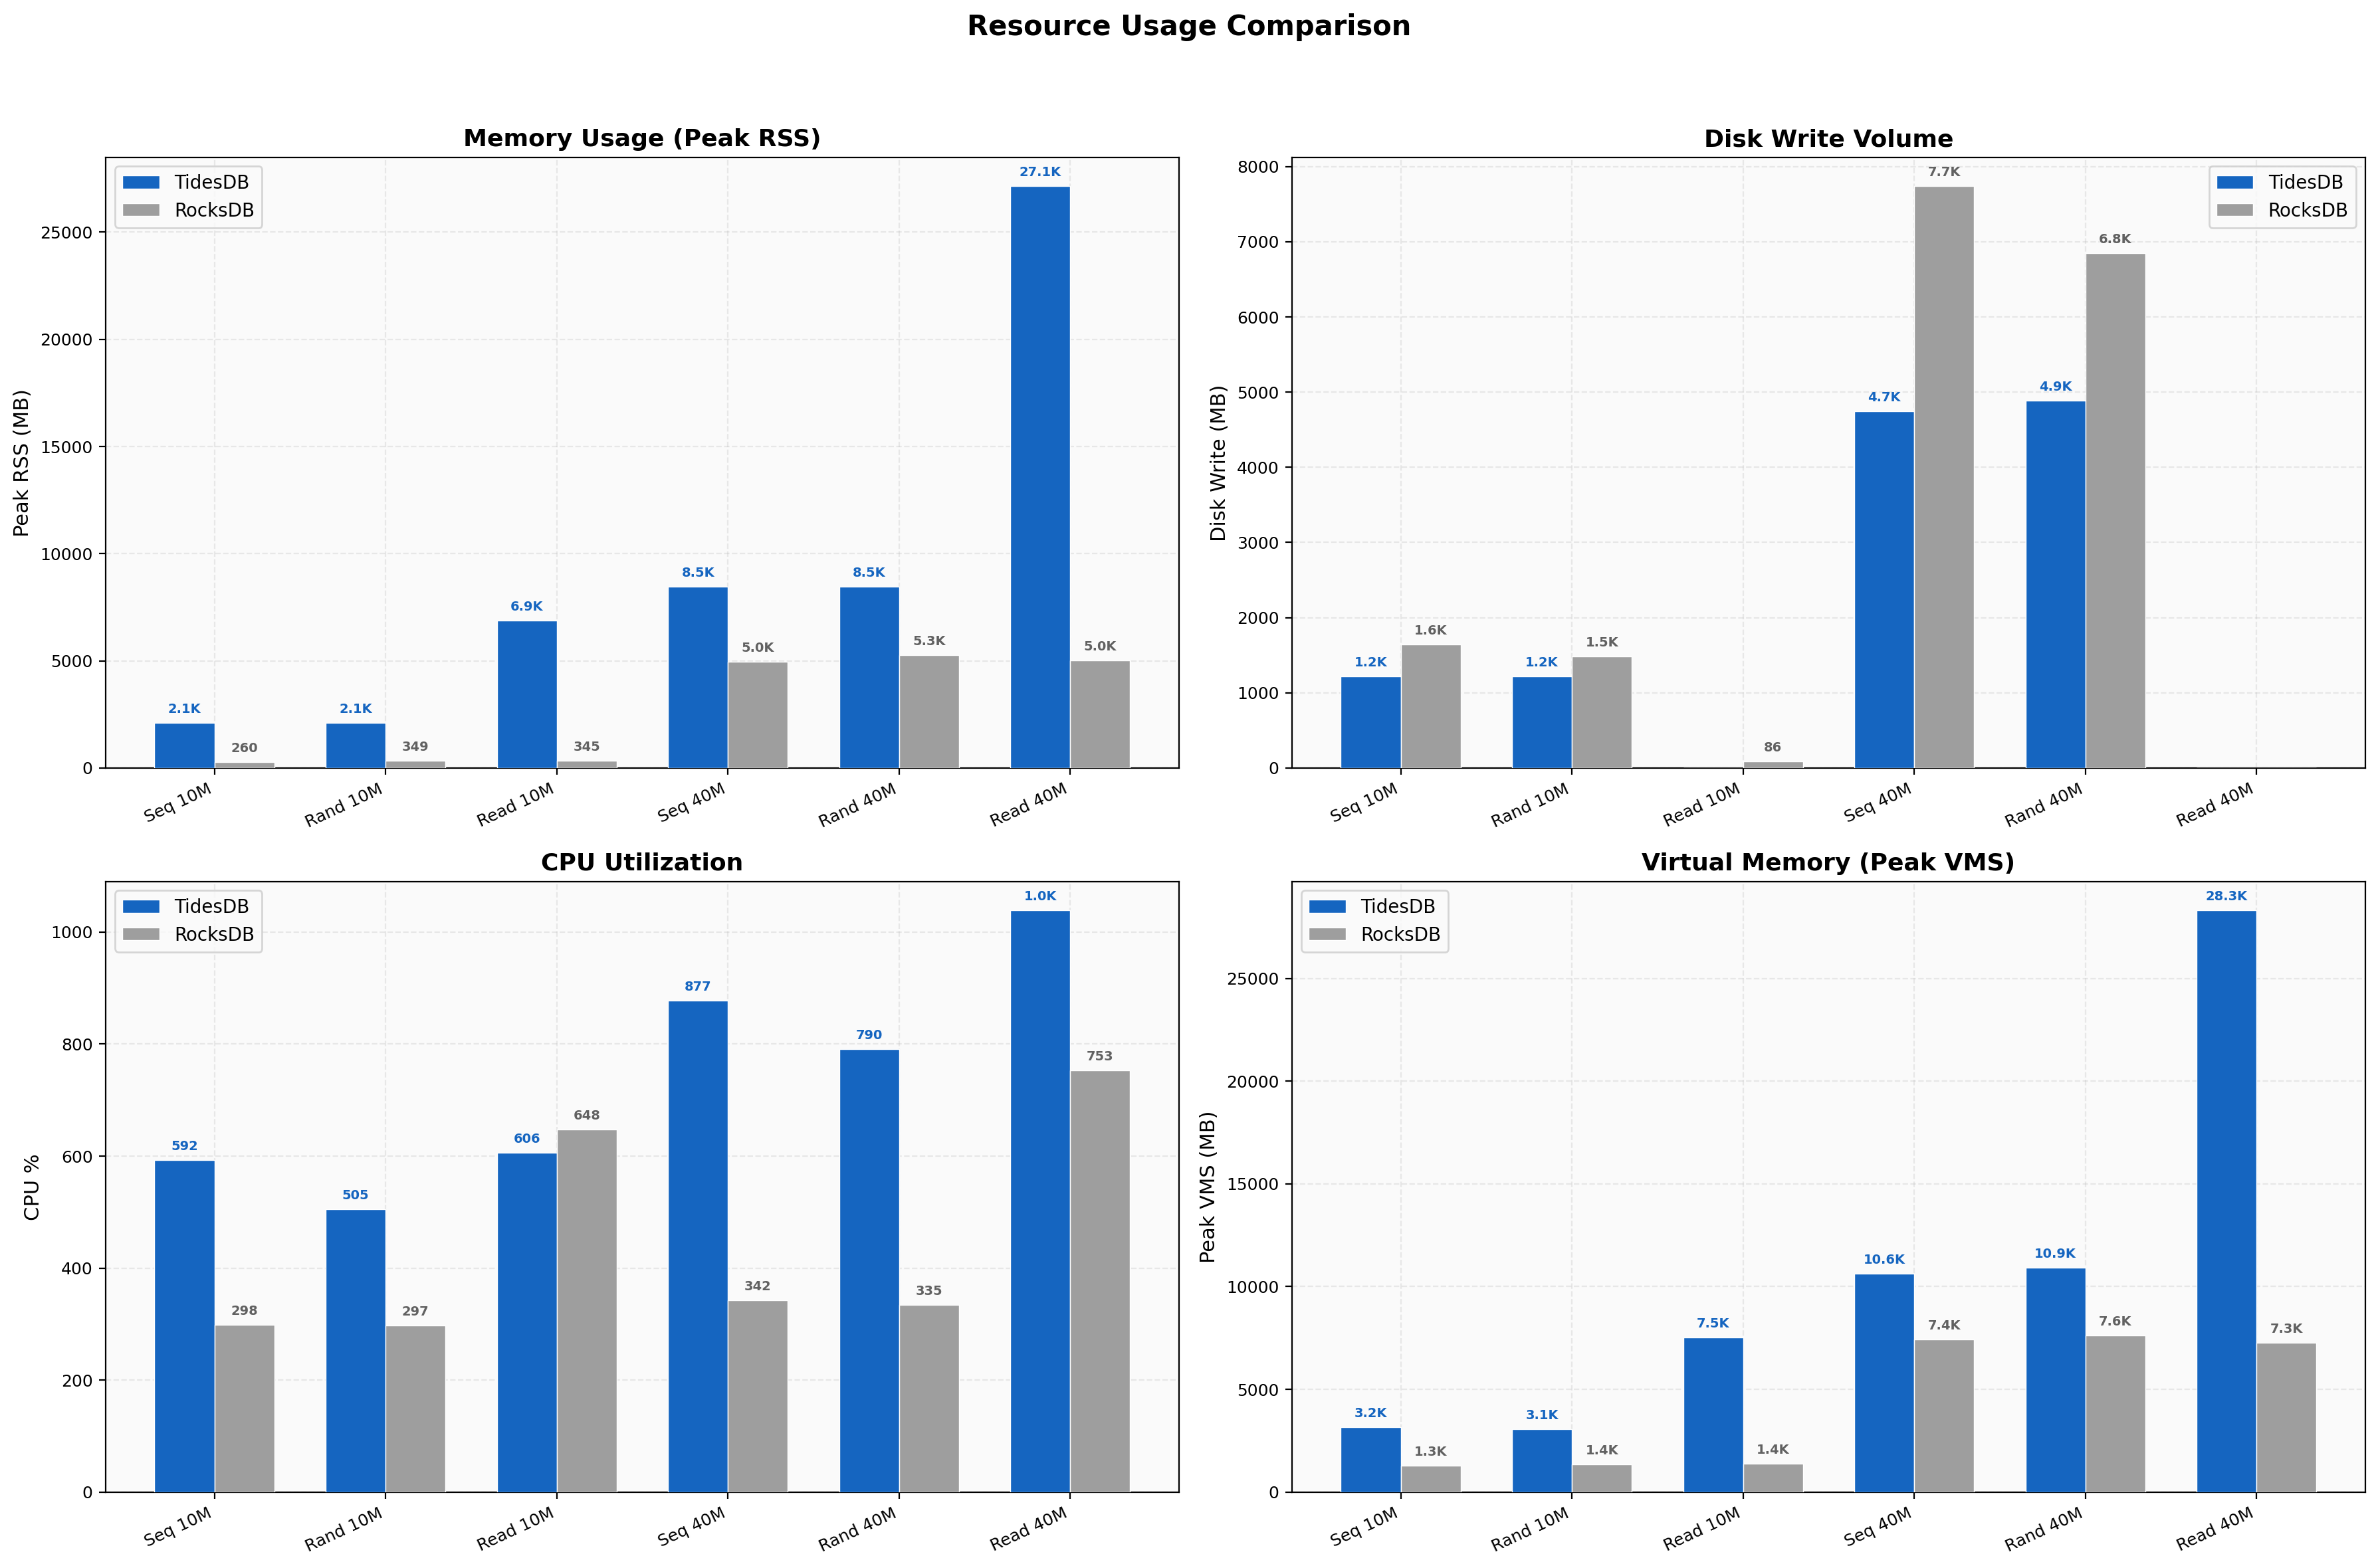
Resource Usage
8-thread peak RSS is TidesDB ~2,100 MB vs RocksDB ~350 MB (6x) and 16-thread 40M writes show TidesDB at 8,472 MB vs RocksDB at 4,961 MB (1.7x). The RSS ratio narrows at 16 threads because RocksDB’s own memory usage scales up with the larger dataset and thread count. CPU usage shows TidesDB hitting 877% on 16-thread sequential writes vs RocksDB’s 342%. Disk writes are lower for TidesDB in most tests, consistent with the write amplification numbers.
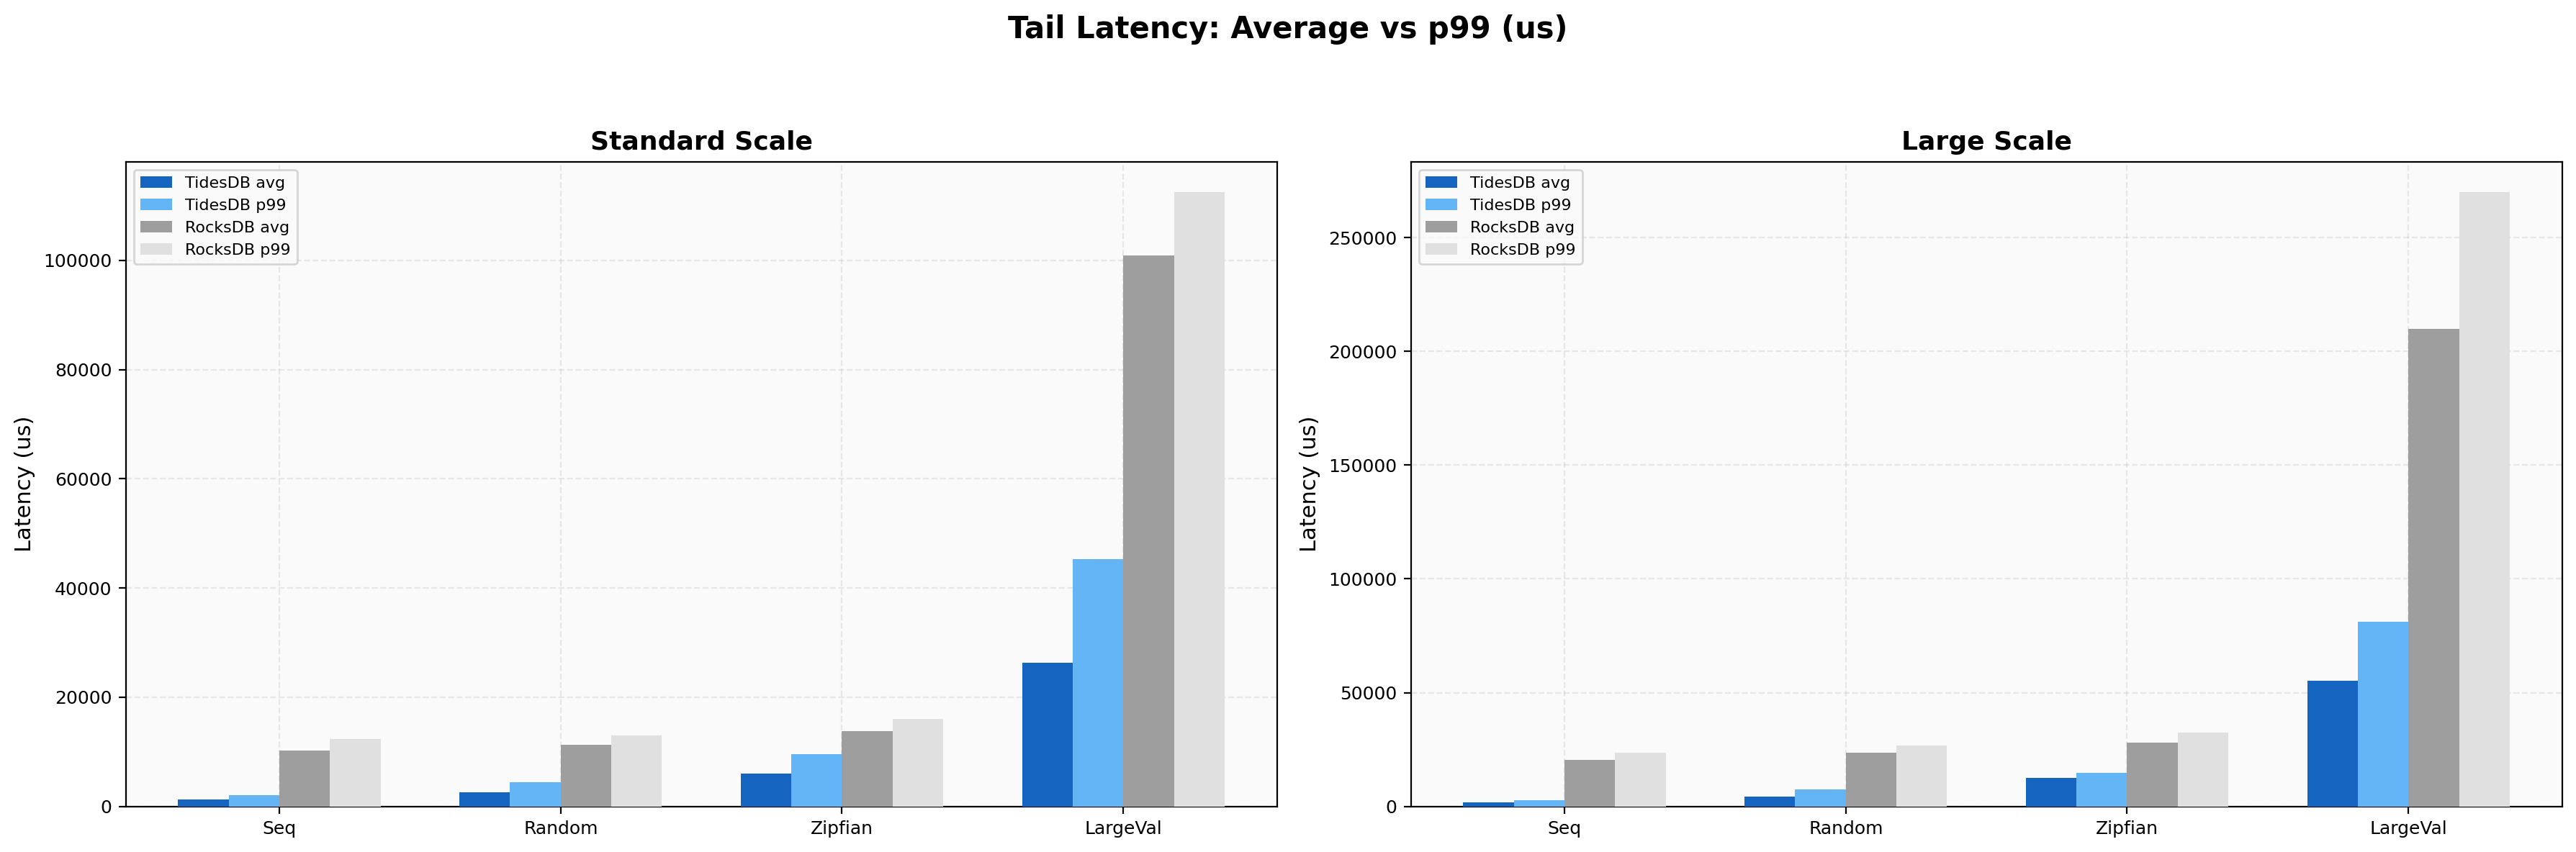
Tail Latency
On 4KB values at 8 threads, TidesDB p99/avg is 2.10x (55,373 µs / 26,342 µs) while RocksDB is 8.67x (876,024 µs / 100,903 µs). RocksDB’s tail here is nearly a full second. At 16 threads the pattern holds, with sequential write p99/avg for TidesDB staying under 2x while RocksDB’s large-value compaction stalls continue to dominate the tail. Sync writes show the cleanest tail behavior with TidesDB’s p99 ratios staying under 1.5x across all thread counts.
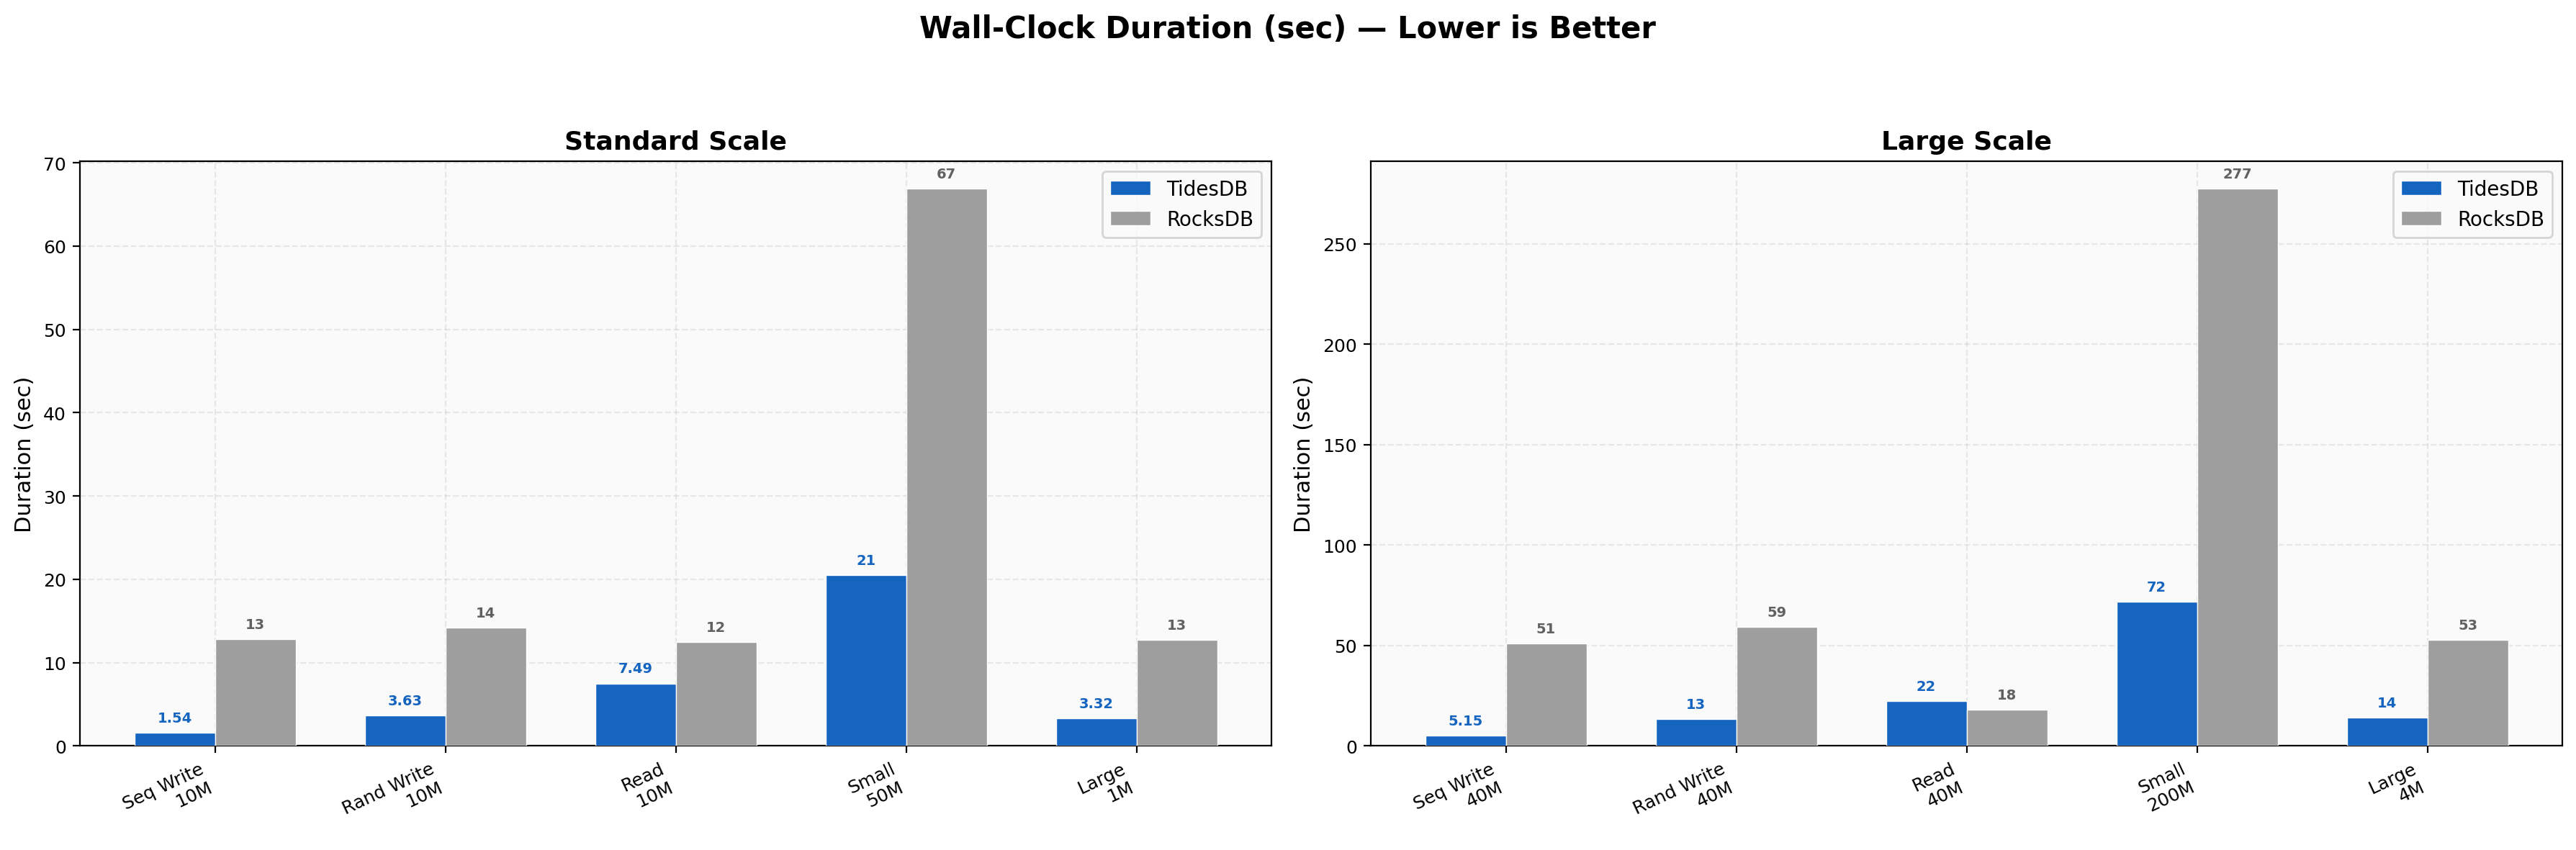
Duration Comparison
10M sequential writes finish in 1.54s vs 12.83s, 10M random writes in 3.63s vs 14.16s, 10M random reads in 7.49s vs 12.48s, 40M sequential at 16 threads in 5.15s vs 50.97s (9.9x wall-clock difference), and 200M small-value writes in 71.9s vs 277.4s.
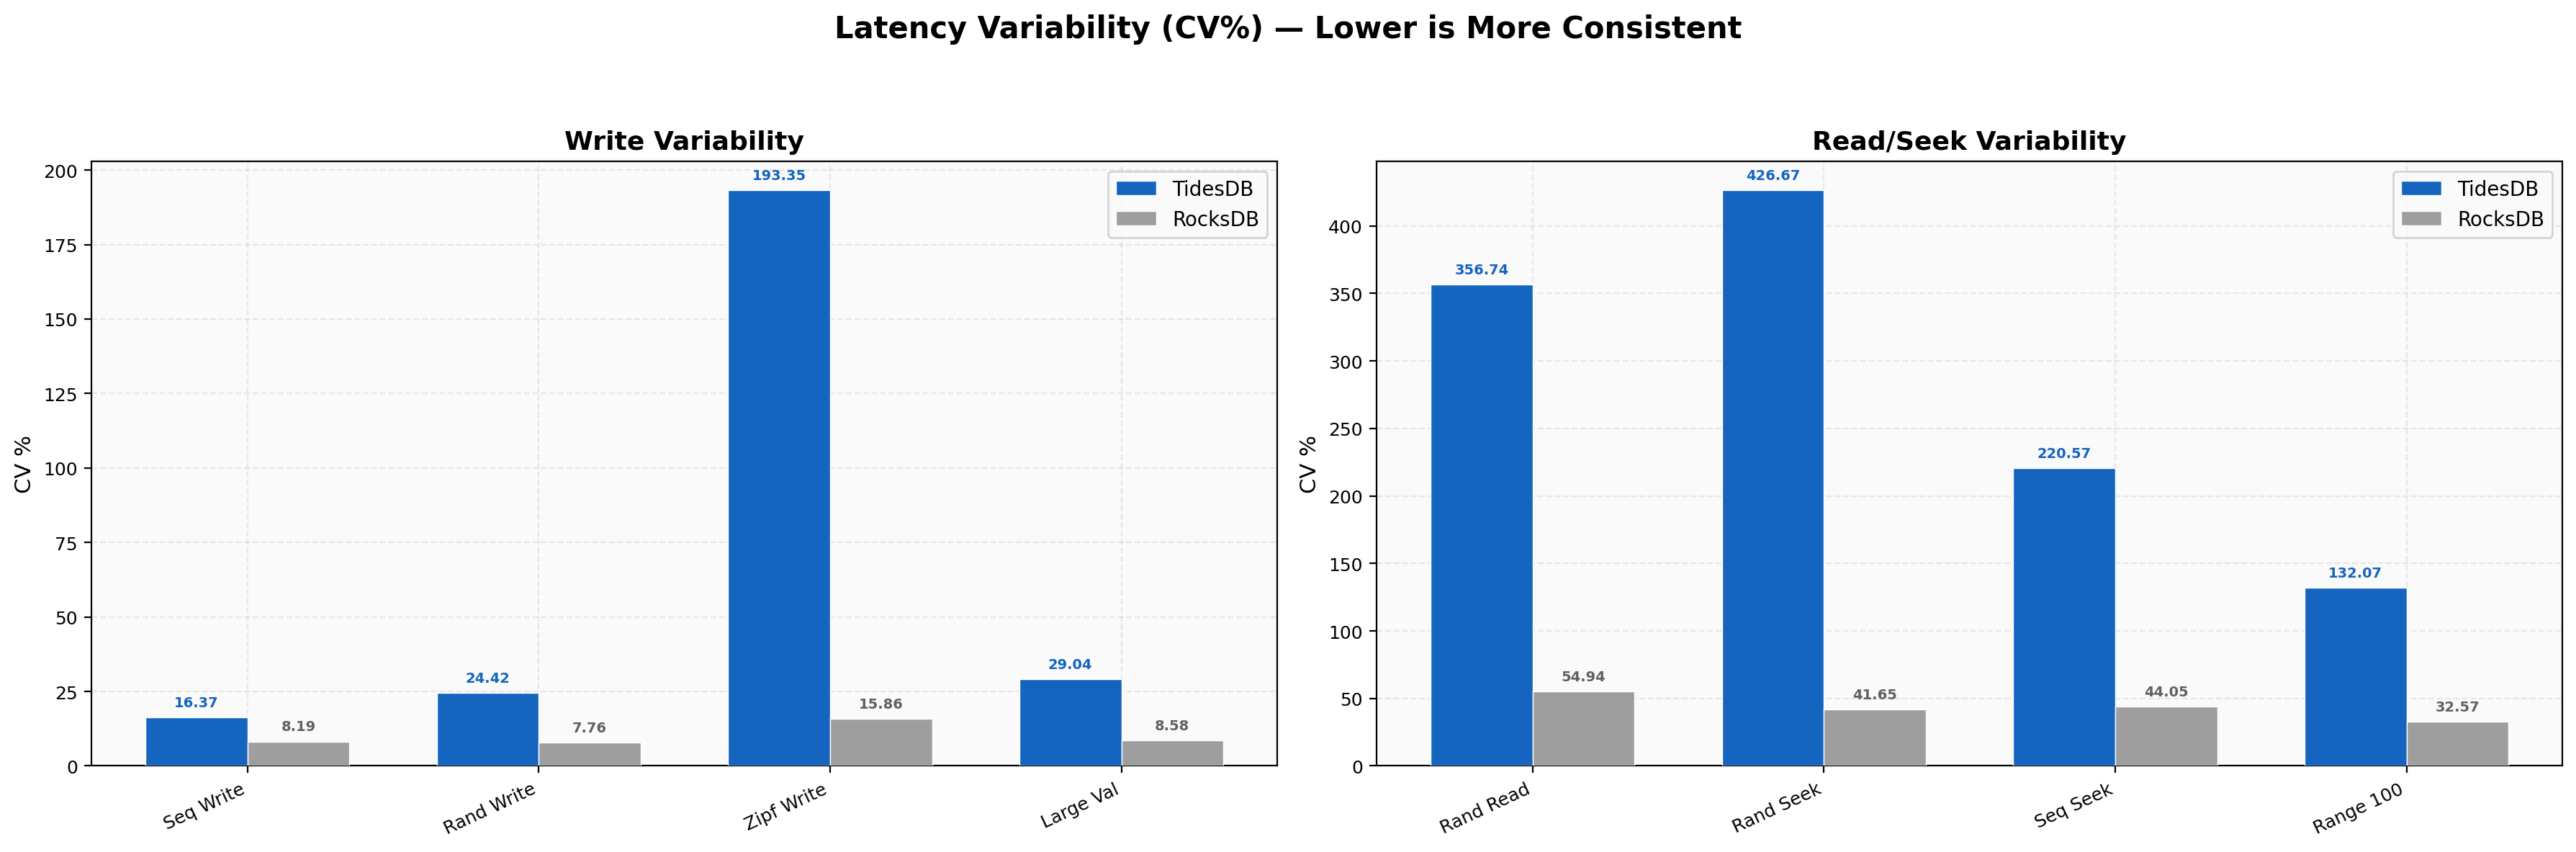
Latency Variability
Write CV for TidesDB sequential is 16.4% vs RocksDB at 8.2%, and interestingly RocksDB is more uniform on this hardware for standard sequential writes because it’s consistently slow rather than bursty. However, at 16 threads sequential writes, TidesDB’s CV spikes to 505% due to occasional graduated back-pressure stalls during the 40M key ingest. Zipfian write CV is 193% for TidesDB vs 15.9% for RocksDB, where hot-key contention triggers more variable back-pressure responses. Read CV remains higher for TidesDB (357% random read vs 55% for RocksDB), consistent with the Environment 1 pattern.
Summary
Cross-Environment Findings
TidesDB v8.6.0 outperforms RocksDB v10.10.1 across the vast majority of workloads on both environments. On Environment 1 (i7-11700K, 48 GB, SATA SSD, 8 threads), speedups range from 1.27x to 4.97x with a geometric mean around 2.2x. On Environment 2 (Threadripper 2950X, 128 GB, NVMe, 8 + 16 threads), the same workloads show wider margins, with sequential write speedups reaching 8.32x at 8 threads and 9.90x at 16 threads, and synchronous writes scaling to 14.7x at 16 threads.
The consistent strengths across both environments include sequential and batched writes (5-10x), range scans (2-3x), seeks with skewed access patterns (3-5x), large-value writes (3-4x with dramatically better tail latency), and low write amplification (1.03-1.23 vs 1.22-1.75). The consistent weaknesses include single-key writes and deletes without batching (RocksDB wins by 1.5-2.5x), read/seek latency variability (RocksDB delivers more uniform timing despite higher absolute latencies), and higher memory usage (~4-6x RSS at 8 threads, narrowing to ~1.7x at 16 threads).
Environment 2 also exposed a new weak spot not visible at 8 threads. Under extreme concurrent write pressure at 16 threads, the mixed random GET path drops as the back-pressure systems over-throttle operations.
Regression Check
I compared the current v8.6.0 results against prior-release in article Benchmark Analysis on TidesDB v8.5.0 and RocksDB v10.10.1.
Environment 1 shows no regressions.
Environment 2 is similarly stable. Sequential writes, batch scaling, range scans, and small/large value tests are all within ±3% of the prior release.
No major regressions were found.
That’s all for now.
Thank you for reading!