Benchmark Analysis on TidesDB v7.4.4 & RocksDB v10.9.1

published on February 1st, 2026
Micro optimizations! I find myself almost every day performance testing components and different configurations to identify opportunities for optimization and then applying them. This includes optimizing for throughput, lower latency, space efficiency, and other aspects of performance. In this patch, I focused on reducing syscalls and CPU cycles, improving fast paths for comparisons, and enhancing cache locality. I worked on the bloom filter, the block manager skip list, and the core read paths within TidesDB.
I ran the benchmarks using tidesdb_rocksdb.sh within the benchtool repo on the specifications described below.
Environment
- Intel Core i7-11700K (8 cores, 16 threads) @ 4.9GHz
- 48GB DDR4
- Western Digital 500GB WD Blue 3D NAND Internal PC SSD (SATA)
- Ubuntu 23.04 x86_64 6.2.0-39-generic
- TidesDB v7.4.3 & v7.4.4
- RocksDB v10.9.1
- GCC (glibc)
Gains from v7.4.3
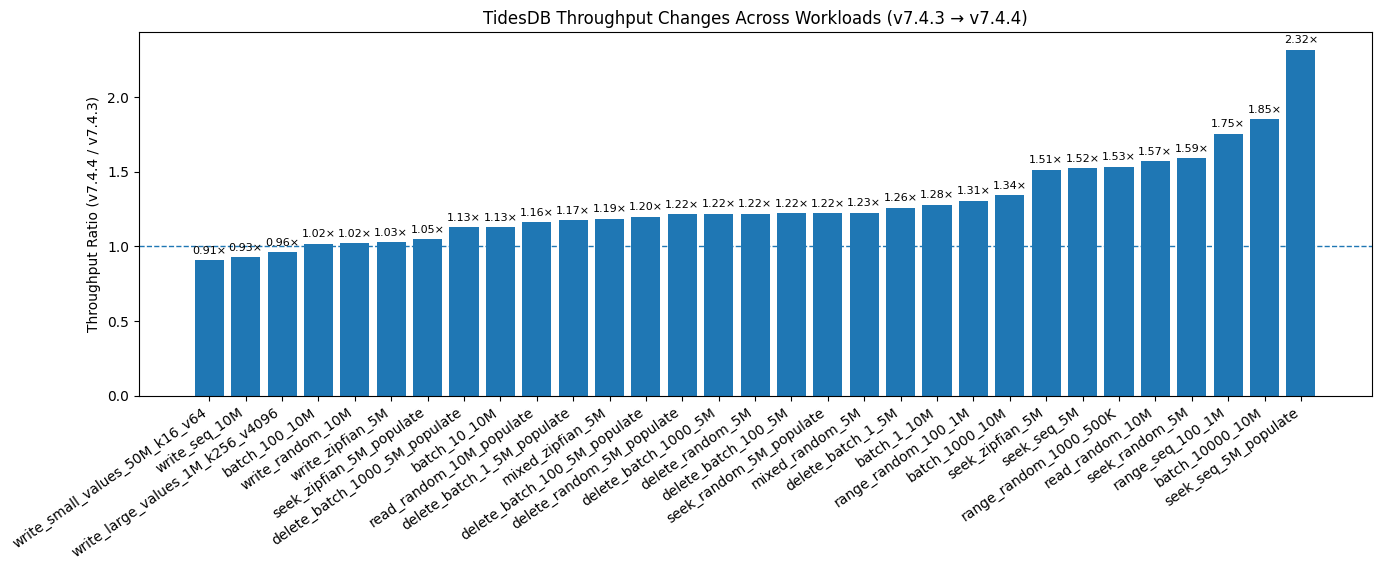
Overall, v7.4.4 delivers consistent and often substantial performance gains across the majority of workloads. Many read-, seek-, and range-oriented workloads show improvements in the 1.2x-1.6x range, with the largest gains exceeding 2.3x.
TidesDB v7.4.4 & RocksDB v10.9.1 Comparisons
Sequential Put Throughput
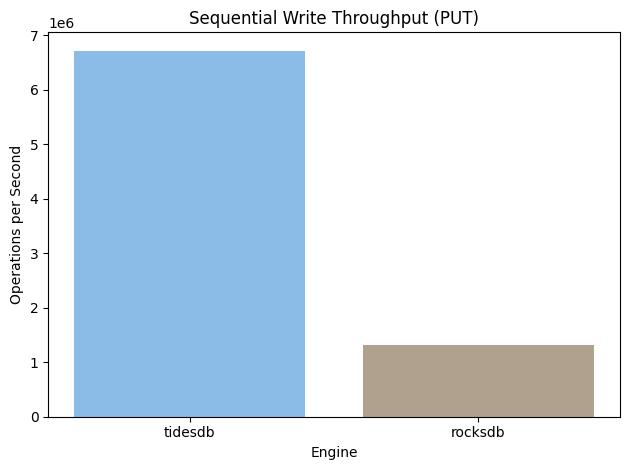 TidesDB achieves substantially higher write throughput, sustaining approximately 6.7 million operations per second, compared to ~1.3 million operations per second for RocksDB.
Random Put Throughput
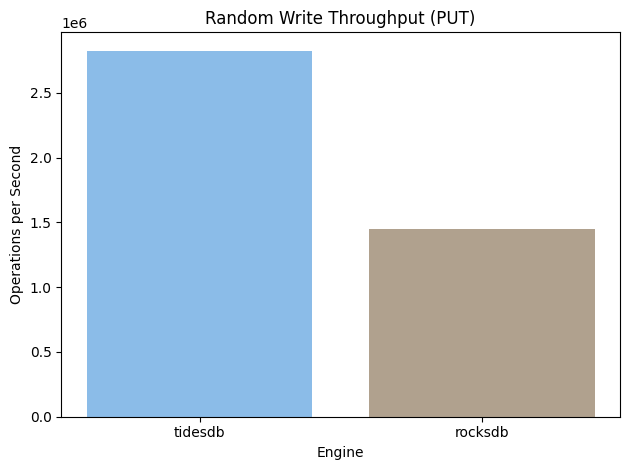 Random write performance shows a similar but less pronounced advantage for TidesDB. Under a randomized key distribution, TidesDB sustains roughly 2.8 million operations per second, while RocksDB reaches approximately 1.4 million operations per second. Although both systems experience a throughput reduction relative to sequential writes, the degradation is noticeably smaller for TidesDB.
Random Read Throughput
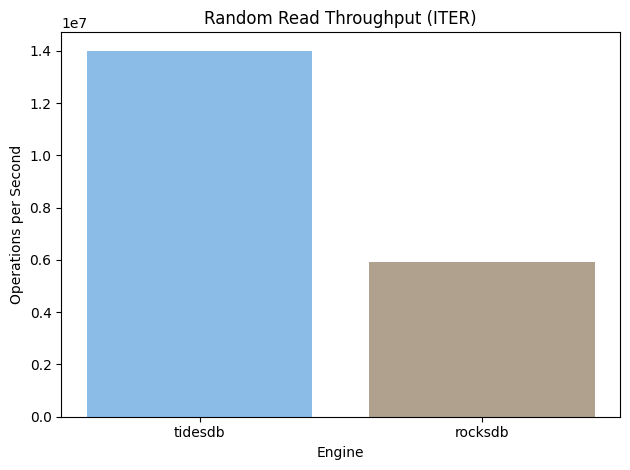 Random read throughput highlights a significant divergence between the two systems. TidesDB delivers close to 14 million iterator operations per second, exceeding RocksDB’s ~5.9 million operations per second by more than a factor of two.
Range Scan Throughput
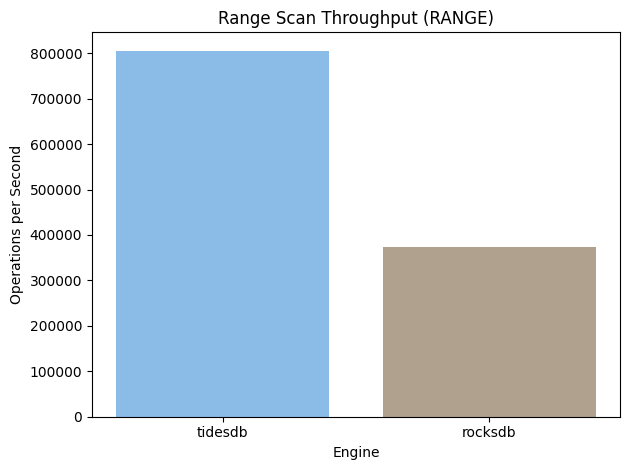 Range scan performance further reinforces the observed trend. TidesDB achieves approximately 800k range operations per second, while RocksDB reaches around 370k operations per second under the same configuration.
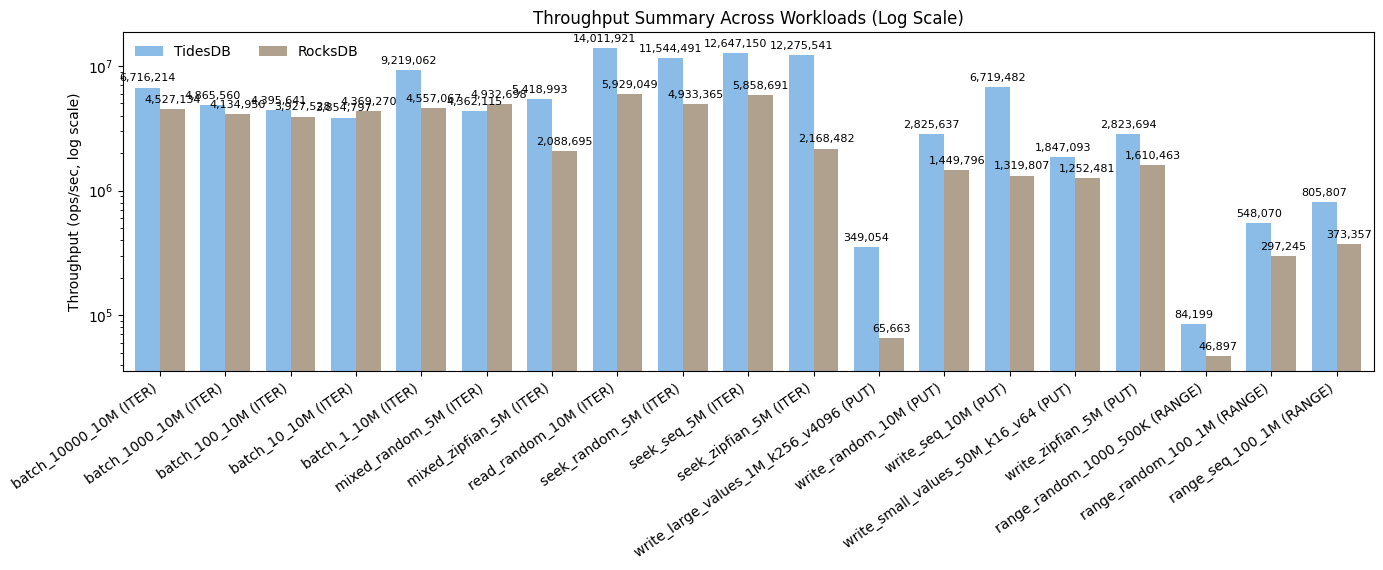
Throughput Summary Across Workloads
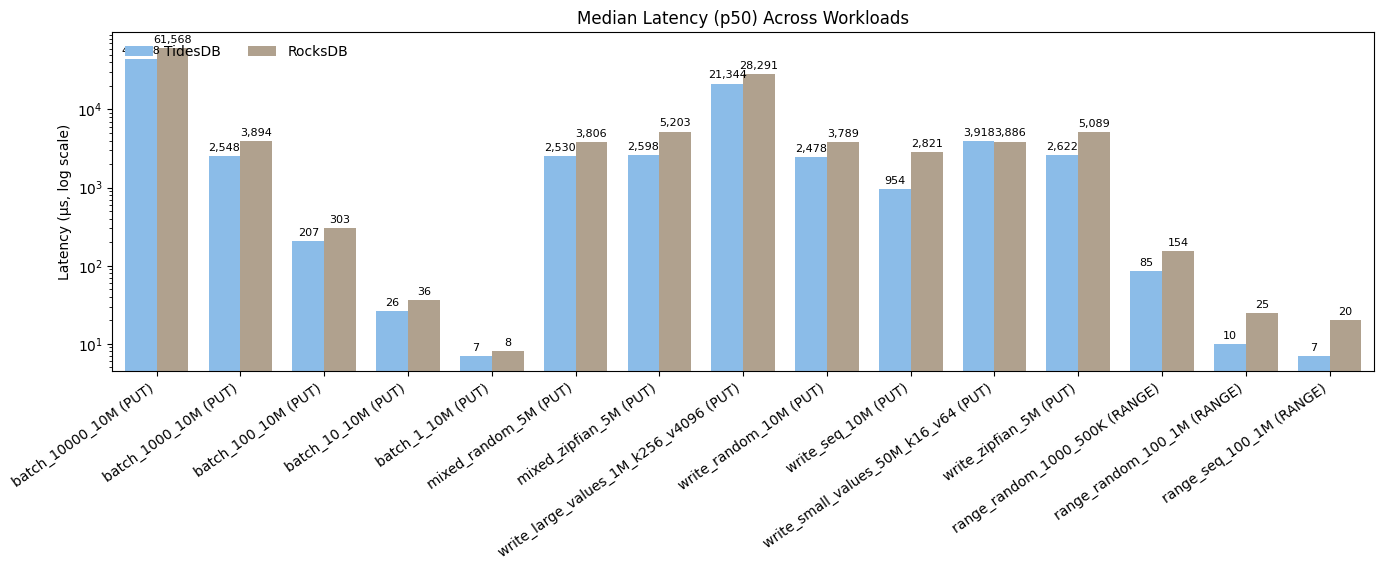
Median Latency (p50) Across Workloads
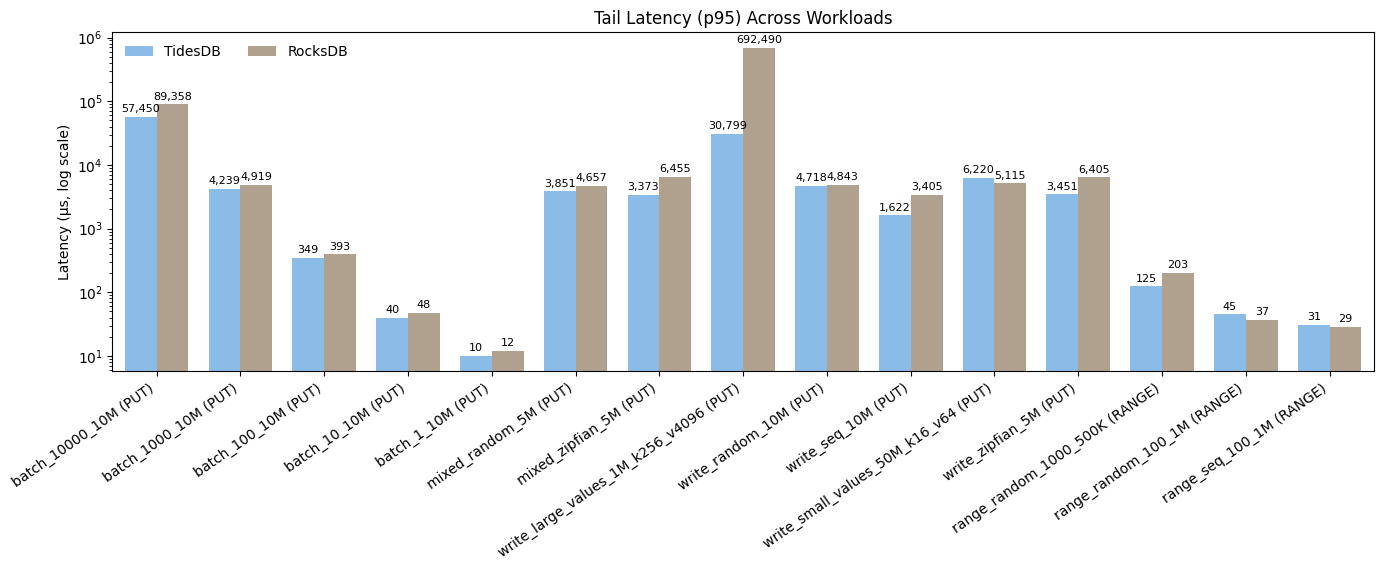
Tail Latency (P95) Across Workloads
Extreme Tail Latency (p99) Across Workloads
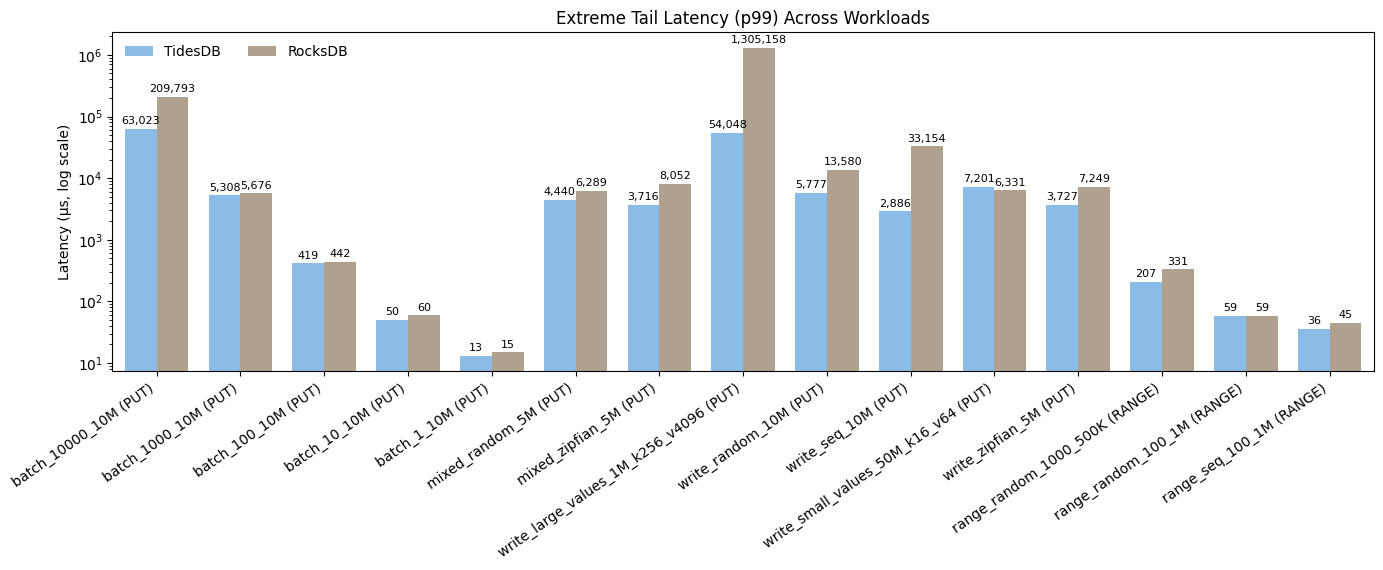
Taken together, the figures show a consistent performance advantage for TidesDB over RocksDB across a wide range of workloads. The log-scale throughput summary demonstrates that TidesDB sustains higher operations per second in most cases, with especially large gains in iterator-heavy reads and several write configurations, indicating that its advantages are broad rather than workload-specific. The median (p50) latency results show that TidesDB generally delivers lower typical request latency for PUT operations and remains competitive or better for range scans, reflecting lower baseline per-request overhead. RocksDB experiences higher and more variable tail latencies in multiple write workloads, due to background activity surfacing in the request paths, while TidesDB maintains lower, more stable tails. Even at the extreme tail (p99), TidesDB exhibits fewer severe outliers, better isolation of maintenance work and a more predictable service-time profile overall.
Write / Space Amplification Across Write Workloads
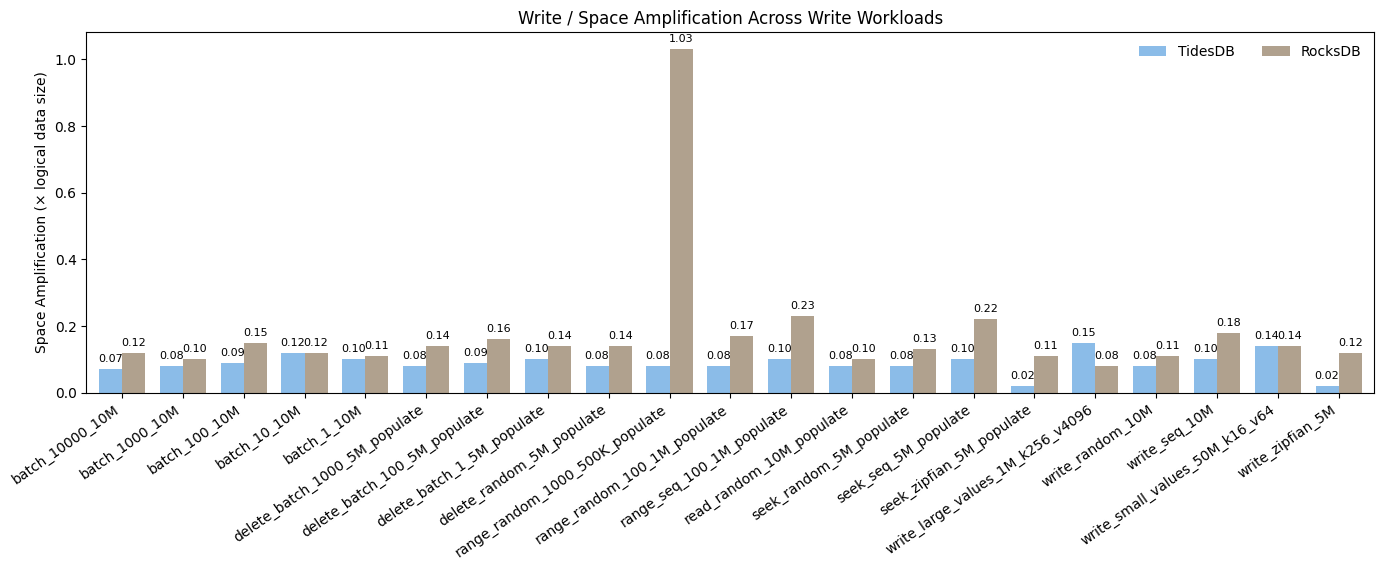 TidesDB’s lower amplification in these scenarios is due to aggressive space reclamation that reduces the lifetime of overwritten data. TidesDB converts write throughput advantages into tangible storage efficiency gains, reducing disk footprint and, by extension, long-term I/O and compaction pressure.
This is all for this article, I hope you found it useful! To download the latest patch you can go to this page.
Thanks for reading!
Want to learn about how TidesDB works? Check out this page.
For raw benchtool data, see below: