Benchmark Analysis on TidesDB v8.7.1 and RocksDB v11.0.3

published on March 9th, 2026
Back with another article, it’s been a while since the last, but there has been lots of work done on TidesDB. The focus has been on profiling and improving lower level aspects like the block manager, corrections to clock cache memory usage bounds, and a refactor to cache raw bytes instead of structures. Overall the latest minor for TidesDB v8.7.0 has brought some nice improvements and consistency on stability. In this article we will be comparing TidesDB v8.7.1 against RocksDB v11.0.3 across multiple workloads to see how they perform. This isn’t a long article, just a quick run down.
Environment
The specs for the environment are
- Intel Core i7-11700K (8 cores, 16 threads) @ 4.9GHz
- 48GB DDR4
- Western Digital 500GB WD Blue 3D NAND Internal PC SSD (SATA)
- Ubuntu 23.04 x86_64 6.2.0-39-generic
- GCC (glibc)
I ran the TidesDB benchtool program using script tidesdb_rocksdb_old.sh.
Benchmark Results Files
| File | SHA256 Checksum |
|---|---|
| tidesdb_rocksdb_benchmark_results_20260309_122442.csv | a6be475c2775462d0020113c7536d8995a529a292daadc3450bfcd72253f073a |
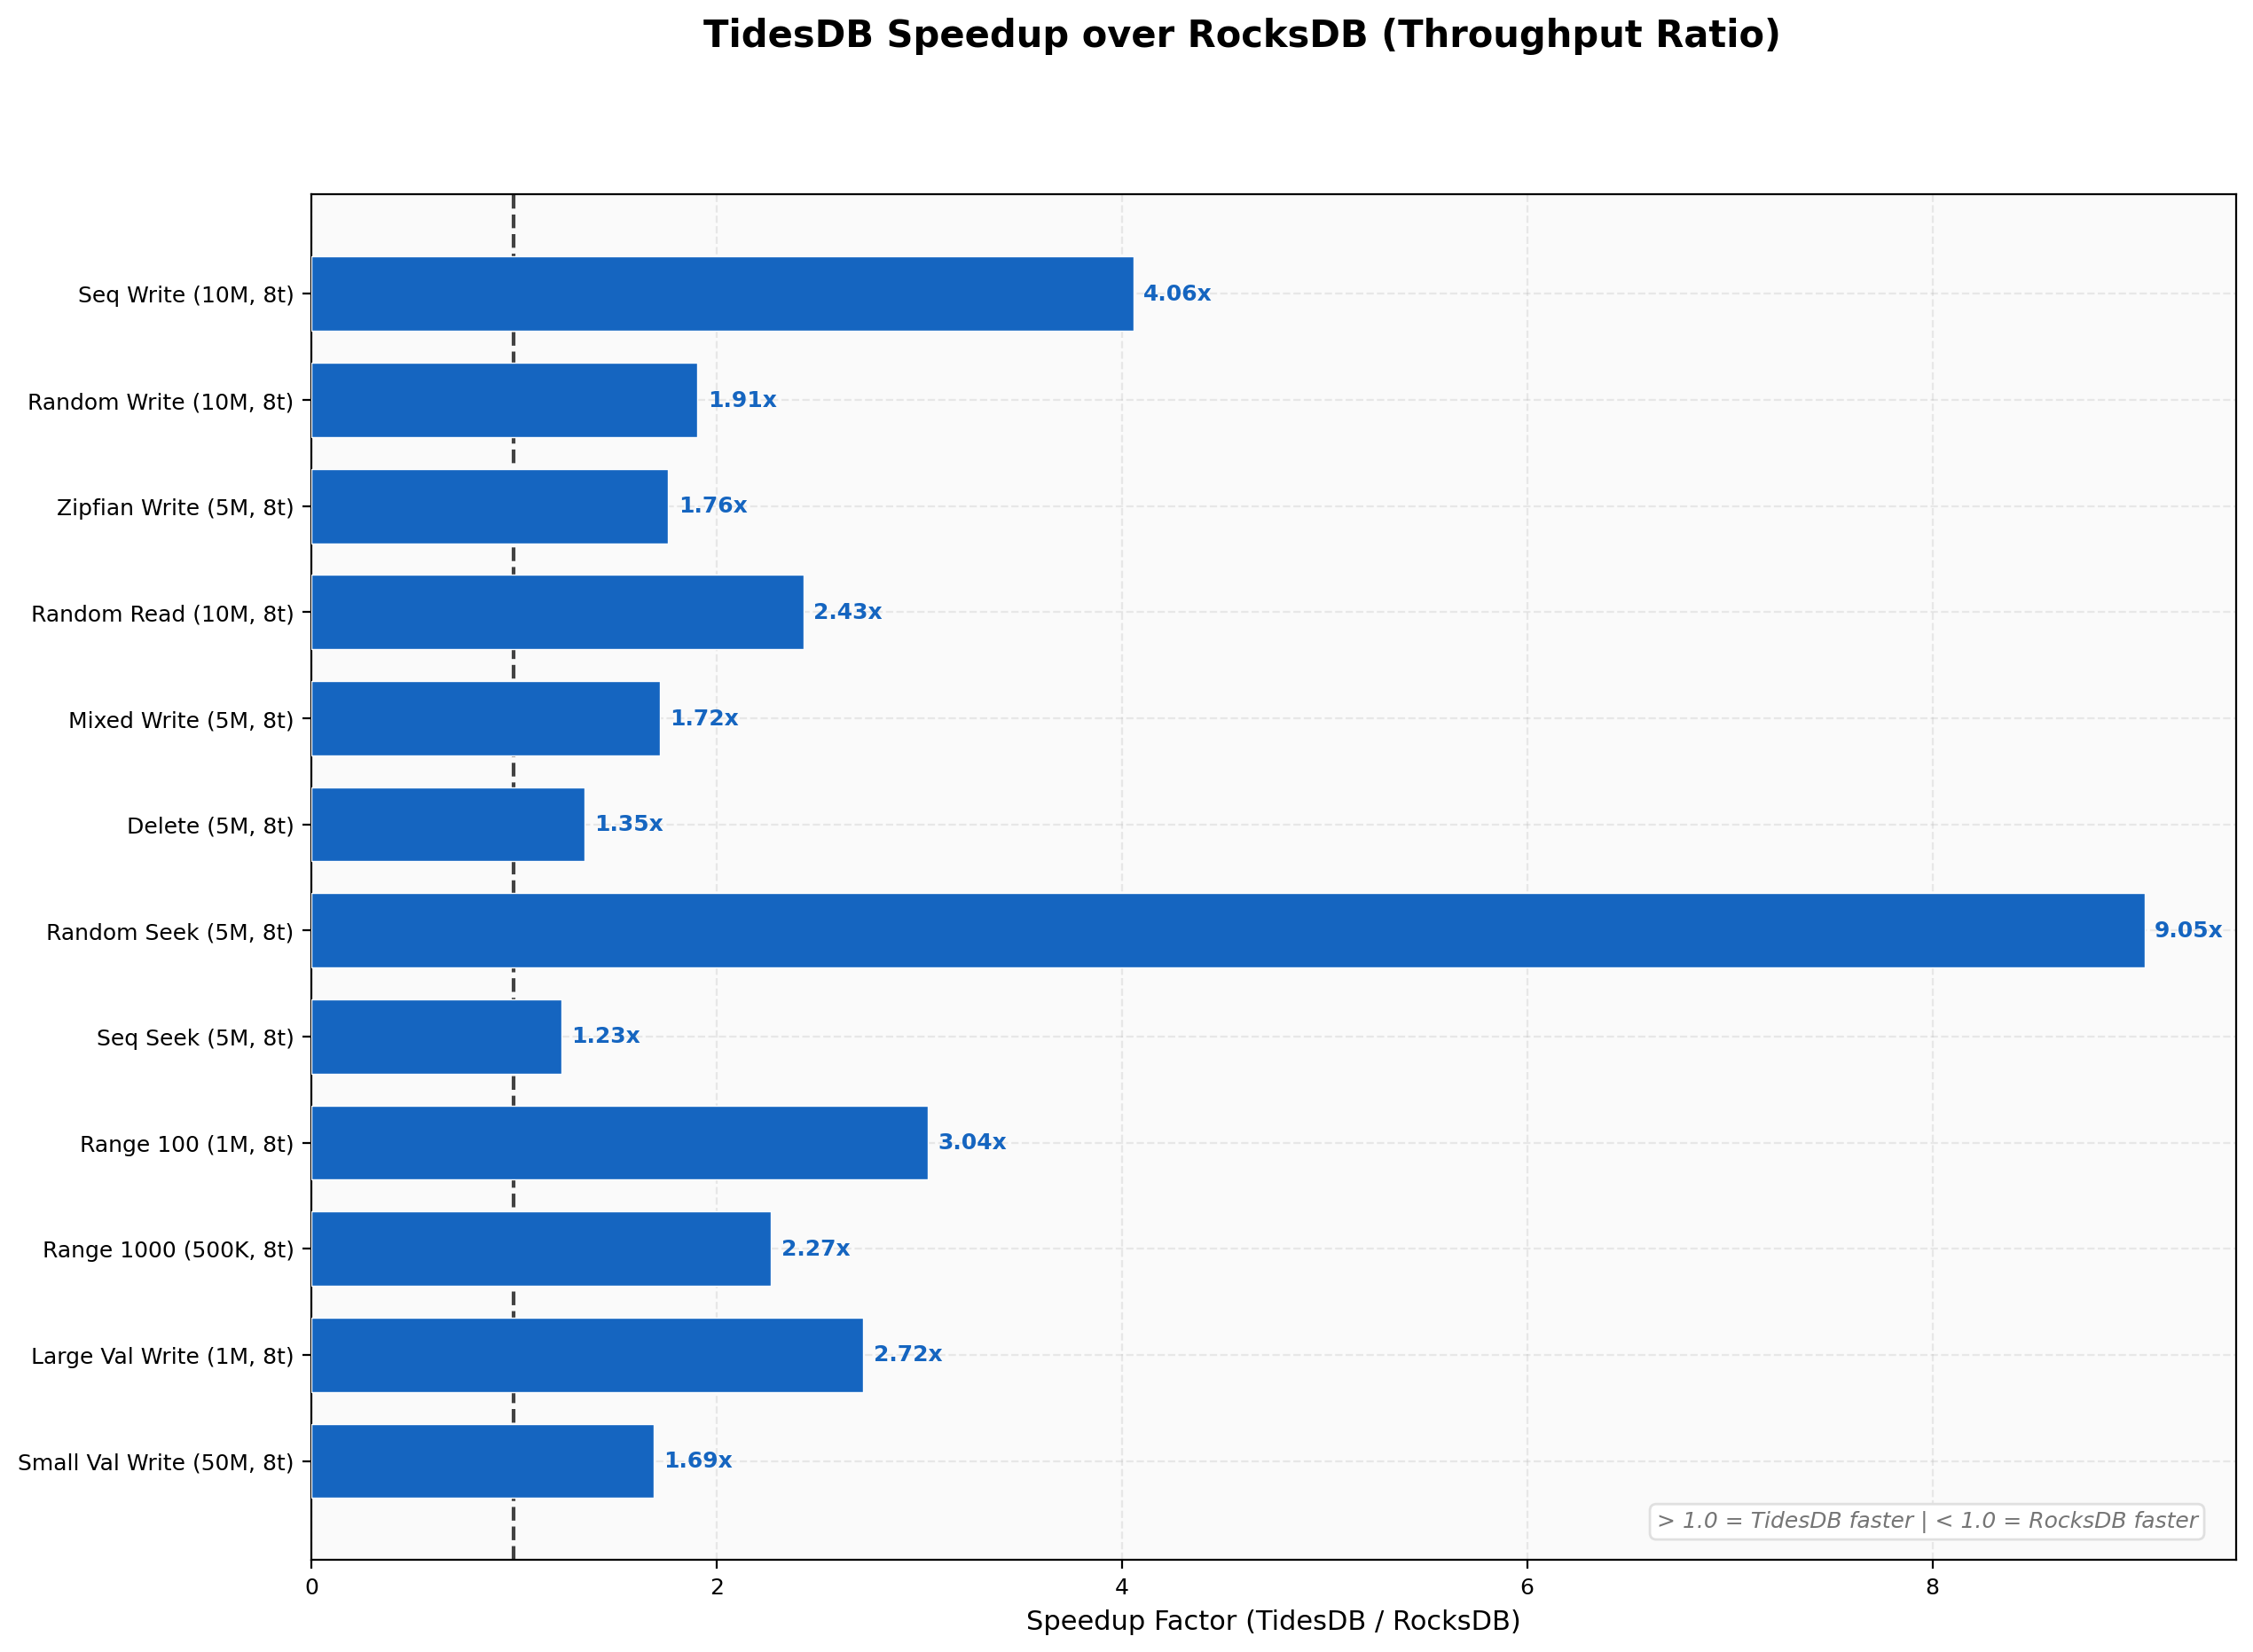
So first we will start off with the speed up summary. Across all workloads in this runner TidesDB won across the board. The changes made to the clock cache and block manager have helped improve read performance especially random read.
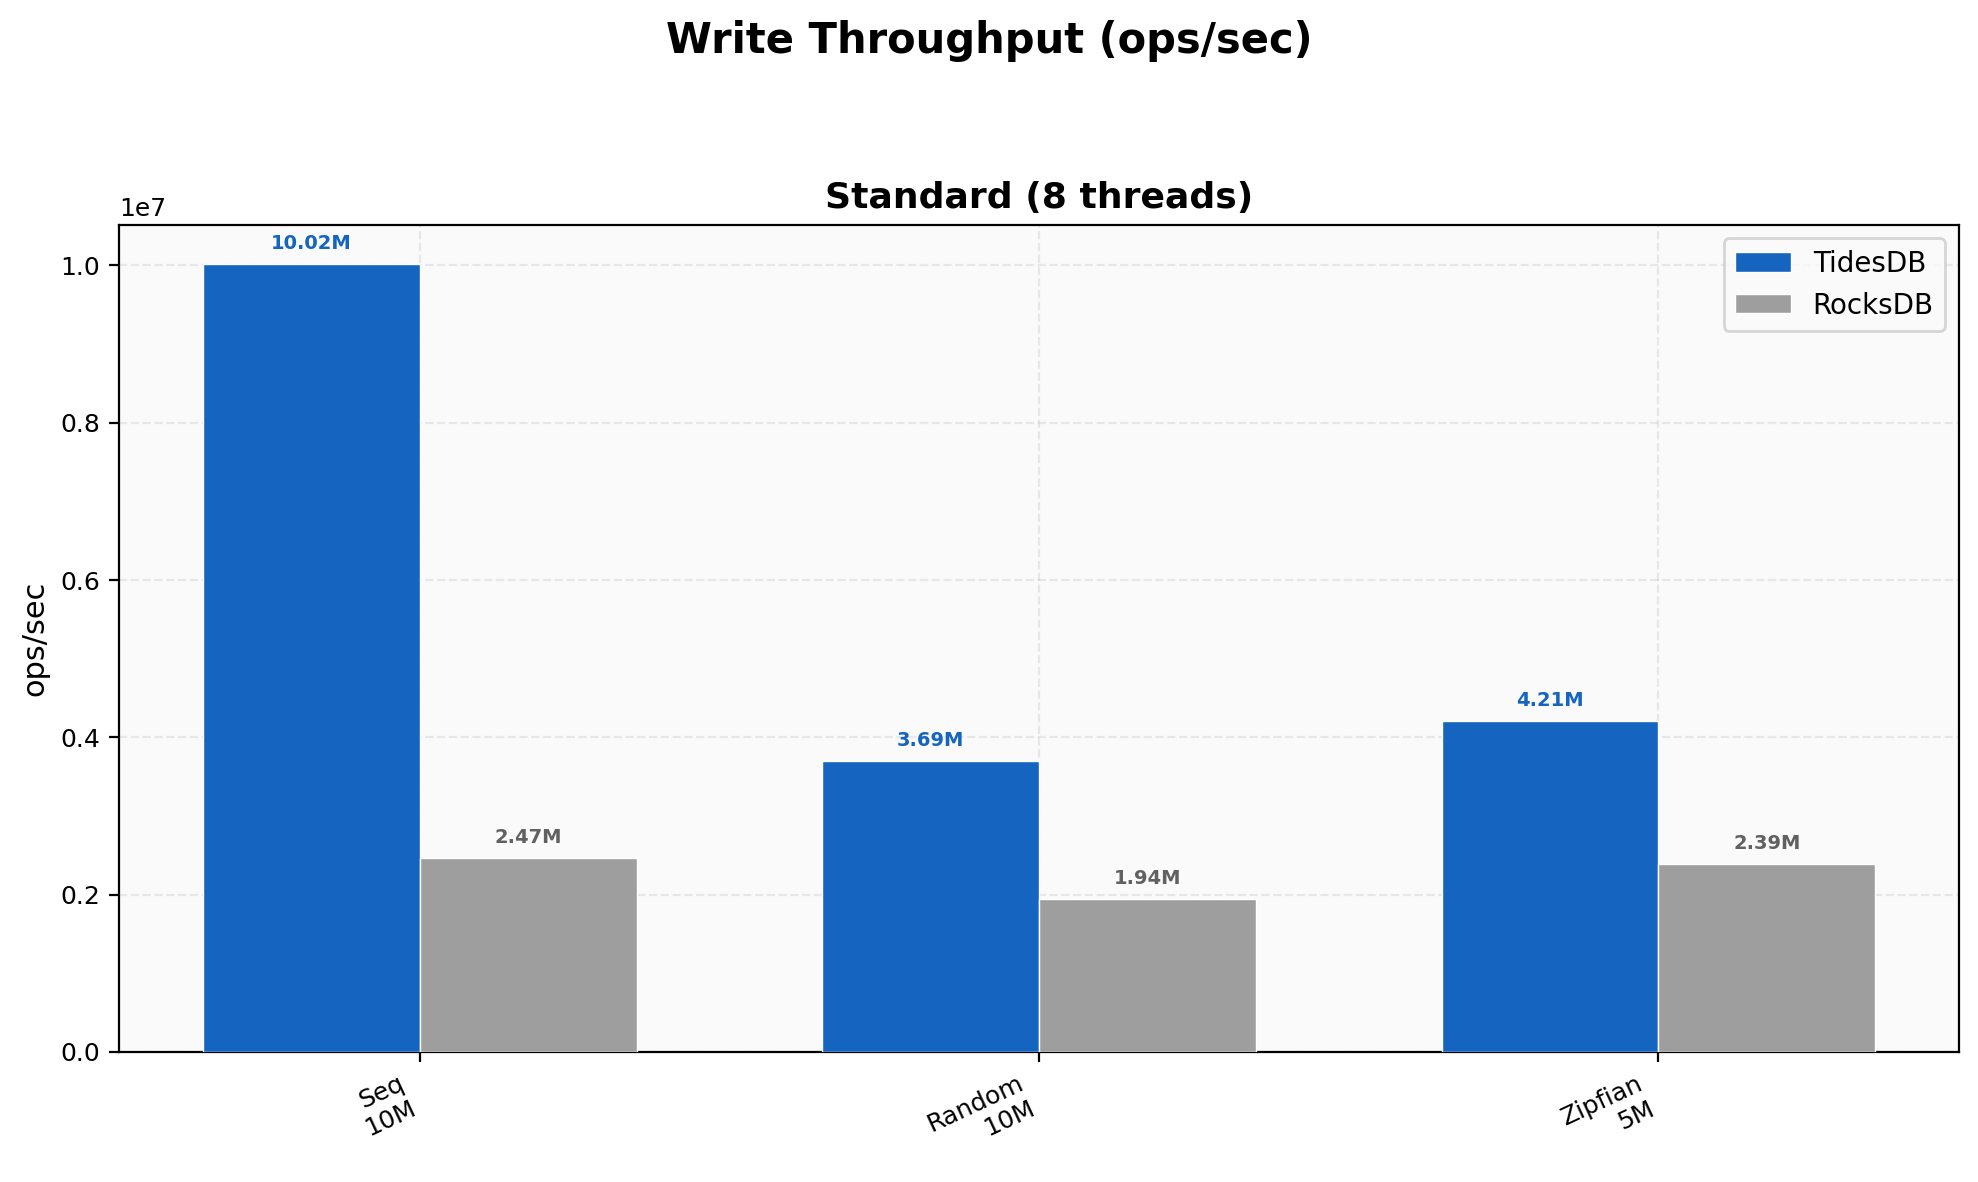
Write Throughput
Sequential writes hit 10.02M ops/sec versus RocksDB’s 2.47M (4.06x), random writes land at 3.69M vs 1.94M (1.91x), and Zipfian at 4.21M vs 2.39M (1.76x). The sequential number is strong here, the pwritev change in the block manager cuts syscalls per write and the sorted run path stays clean.
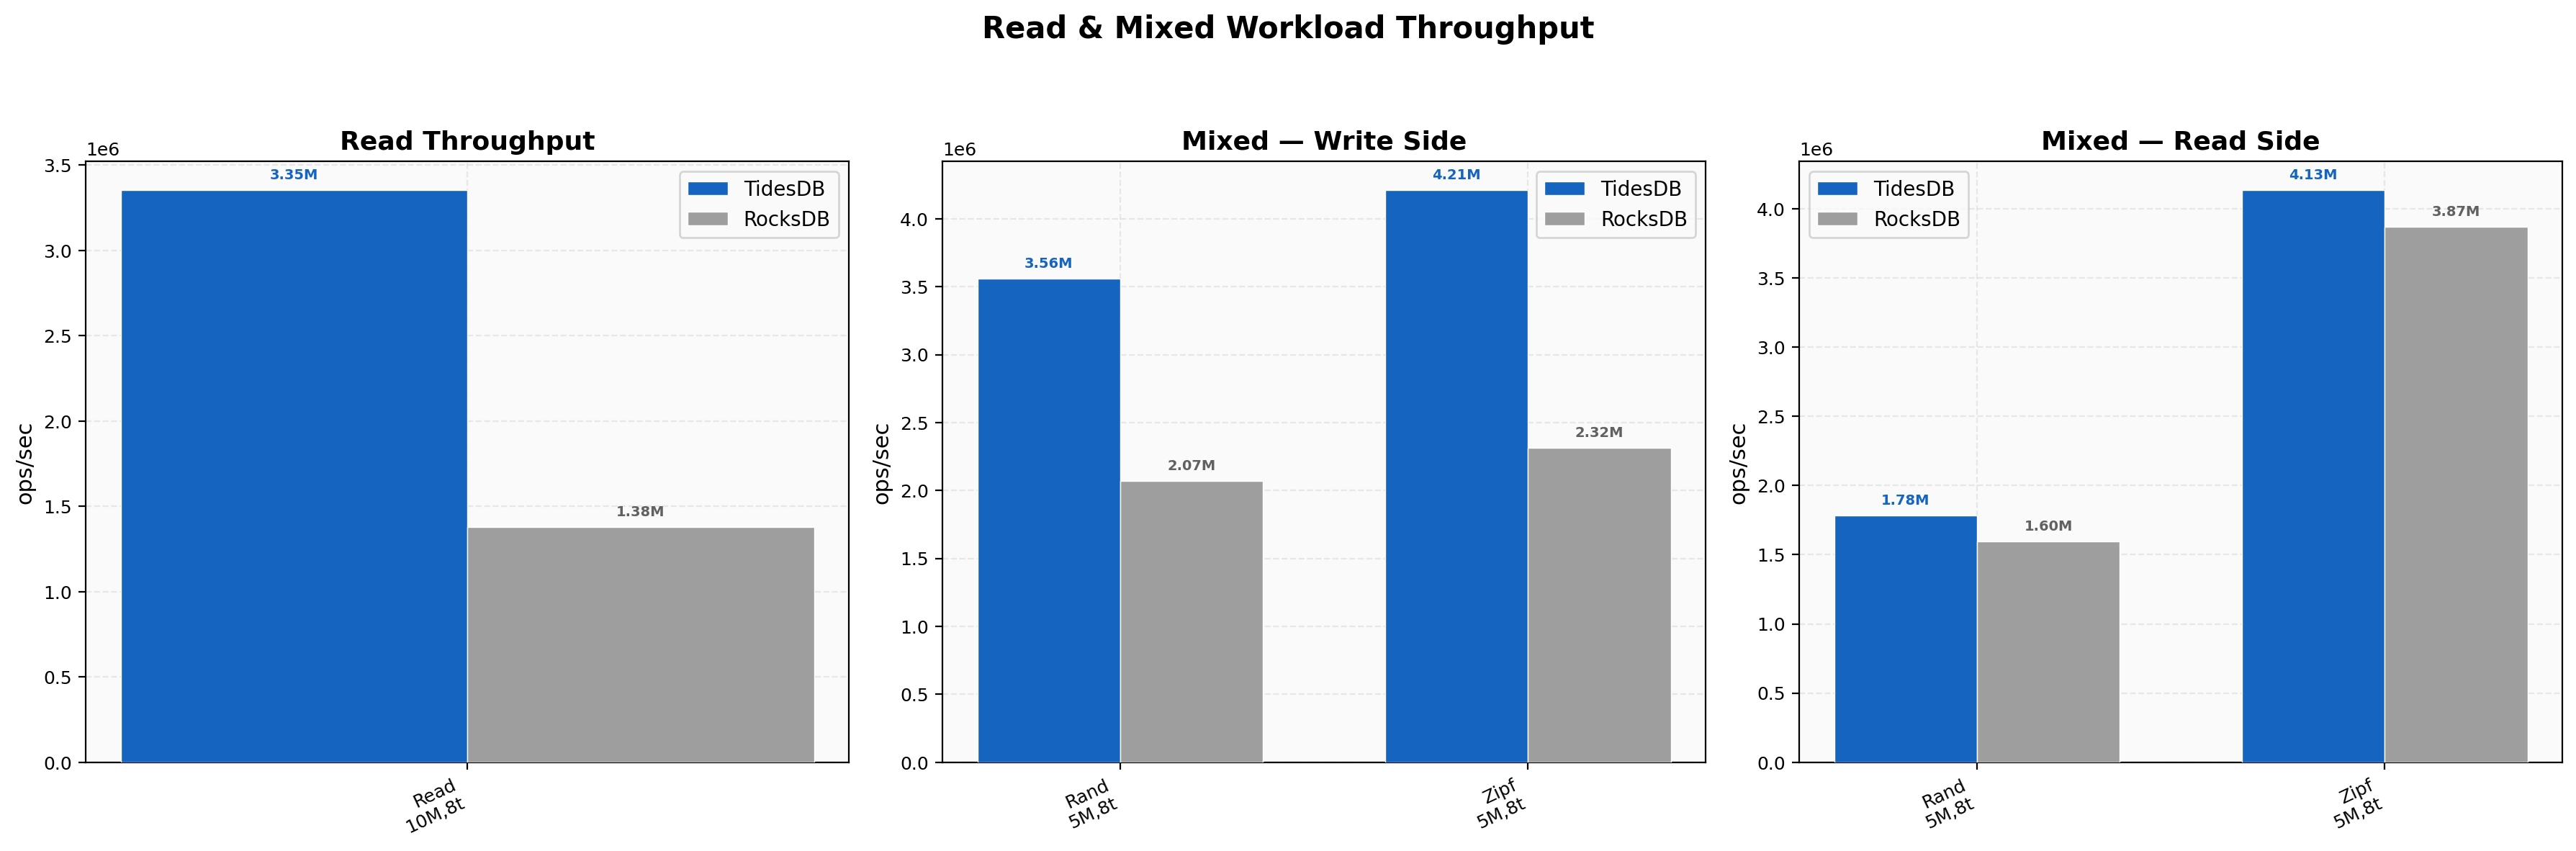
Read & Mixed Workload Throughput
Random reads hit 3.35M vs 1.38M (2.43x) at 2.13 µs average latency, a solid improvement over v8.6.x which sat at around 2.23x. The raw byte cache storing compressed bytes inline is doing its job here, more useful data fits in cache and fewer decompressions happen on the hot path. Mixed random PUT side is 3.56M vs 2.07M (1.72x), GET side is tighter at 1.78M vs 1.60M (1.12x). Zipfian mixed reads show TidesDB at 4.13M vs 3.87M on the GET side (1.07x) and 4.21M vs 2.32M on the PUT side (1.82x).
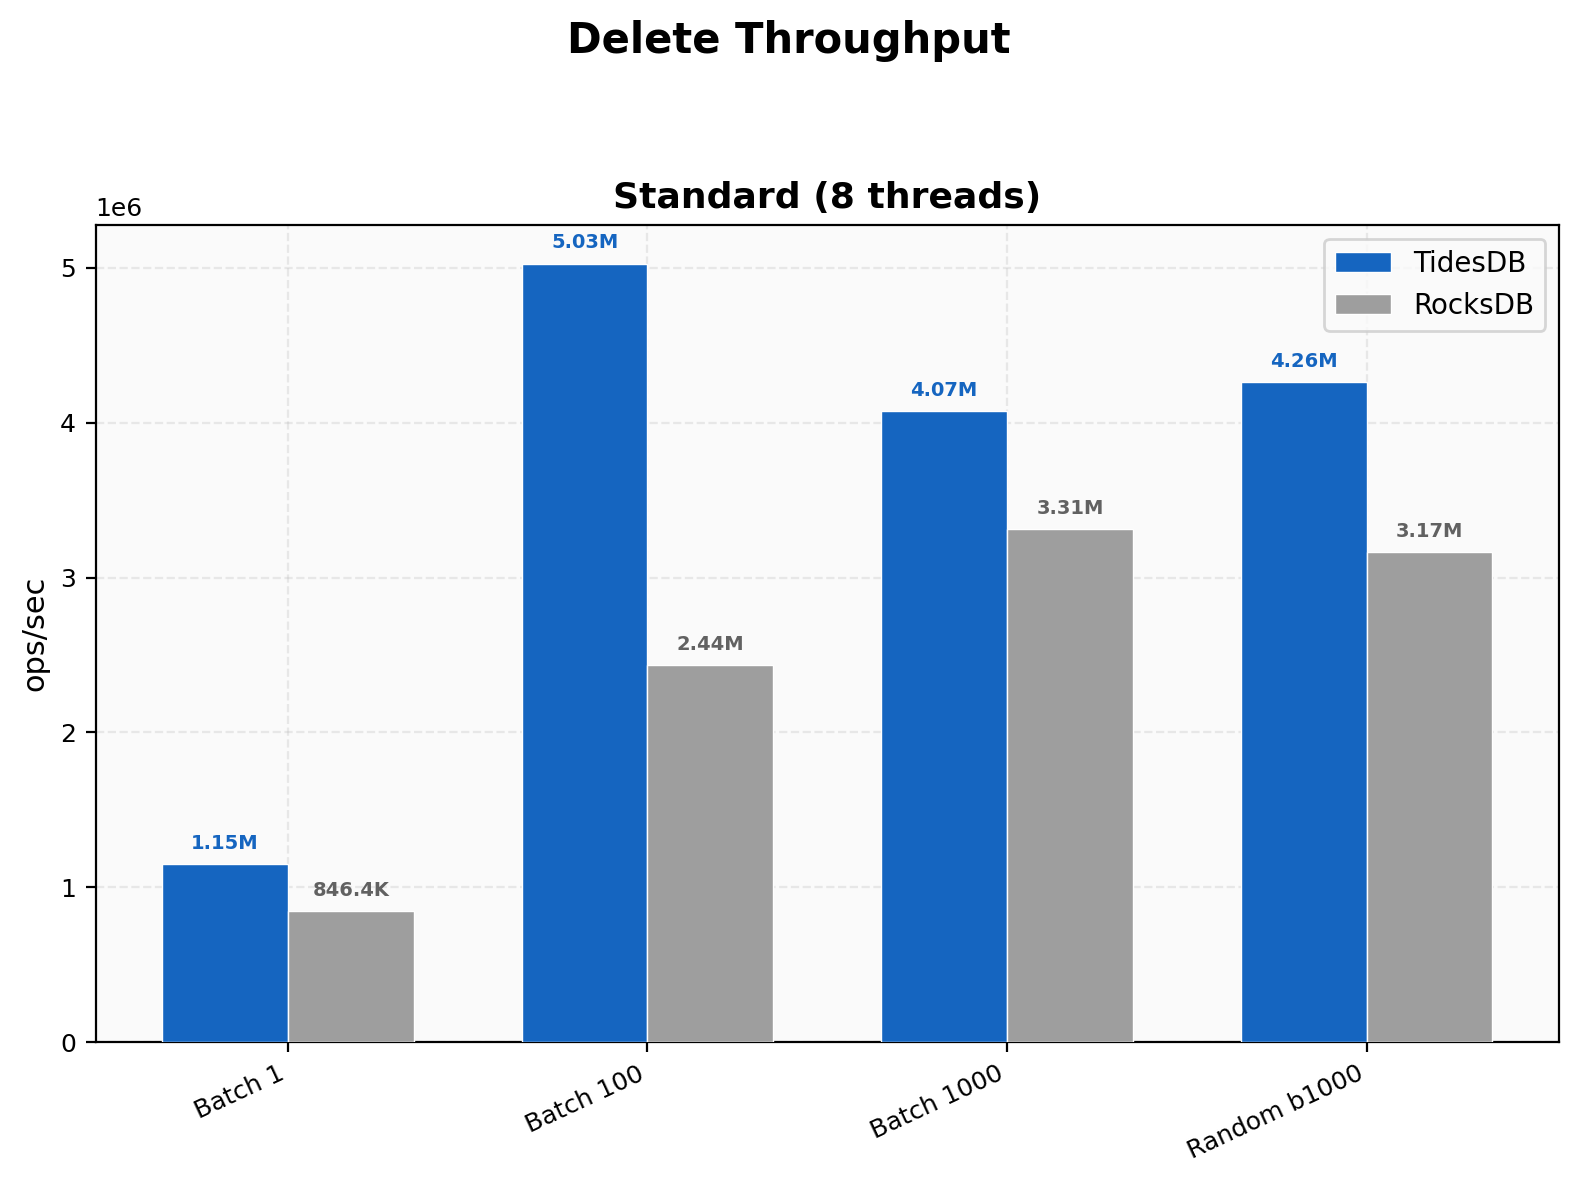
Delete Throughput
Random deletes at batch 1000 hit 4.26M vs 3.17M (1.35x). Single-key deletes now favor TidesDB at 1.15M vs 846K (1.36x) and batch 100 at 5.03M vs 2.44M (2.06x). This is a notable change from v8.6.x where RocksDB won single-key deletes outright, the backpressure move from per-op to per-column-family-per-commit eliminated the overhead that was dragging down fine-grained operations.
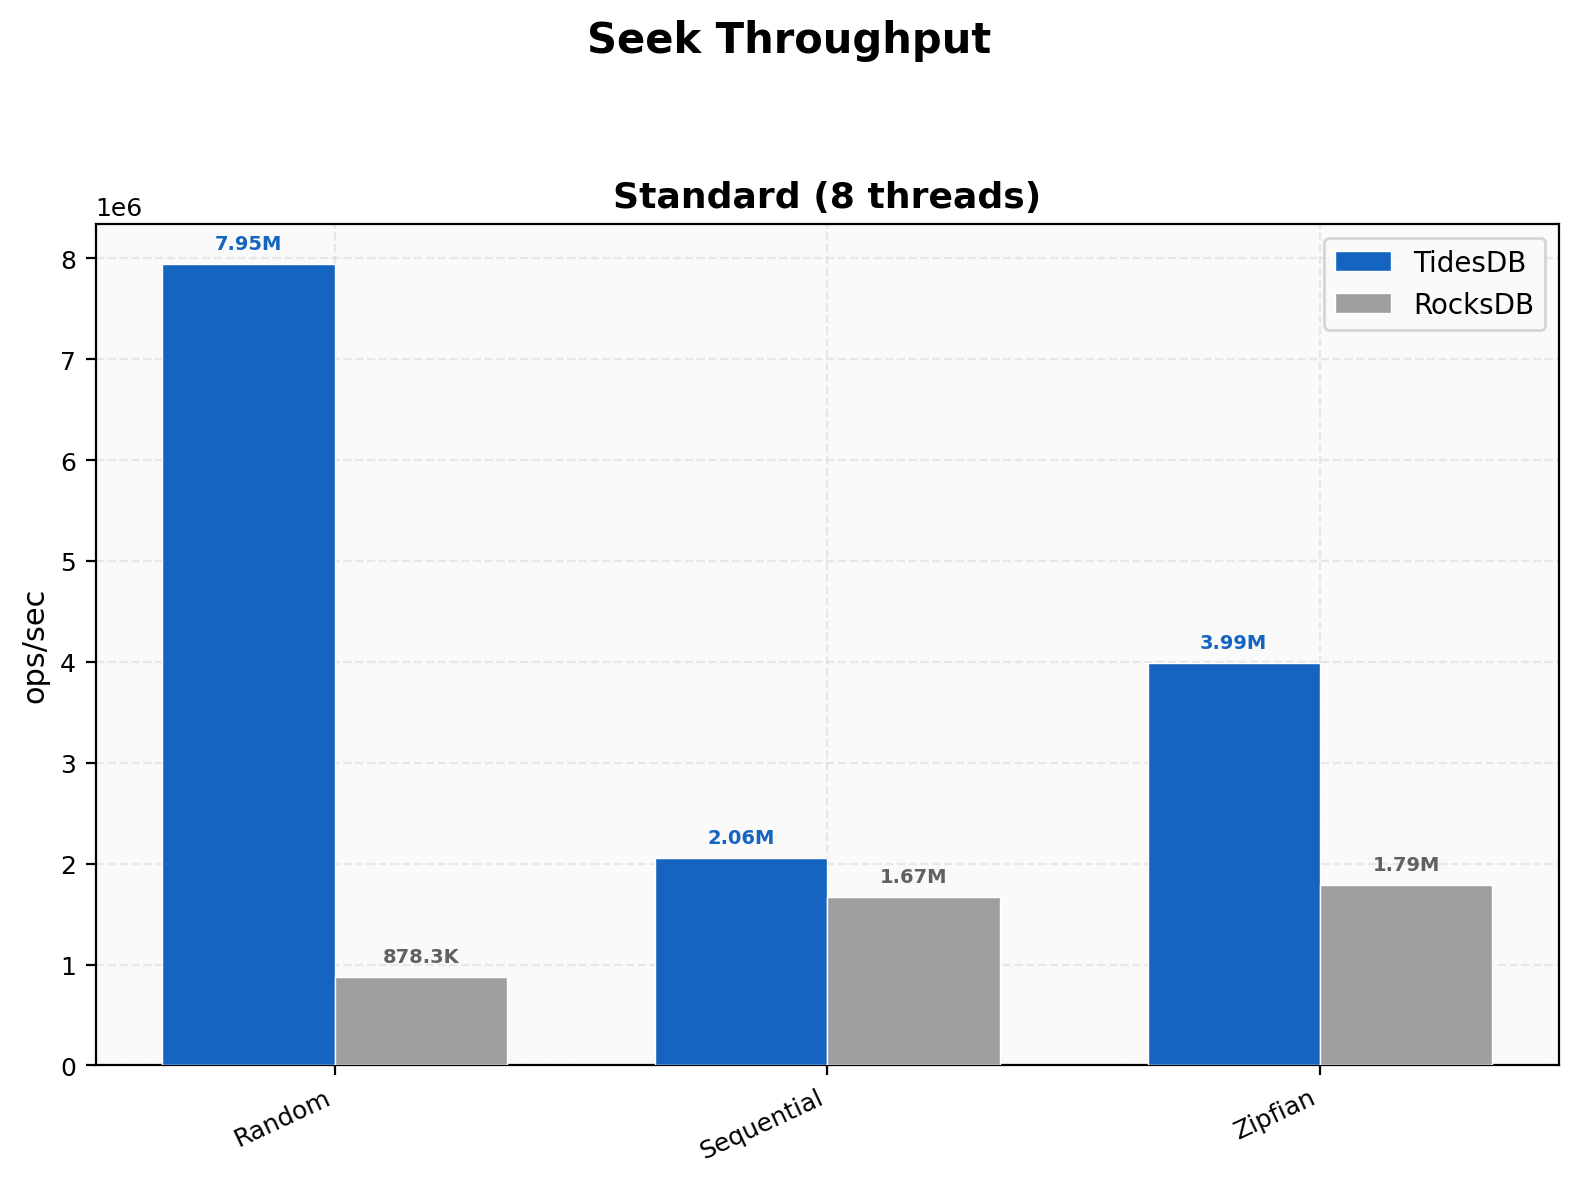
Seek Throughput
Random seeks are the standout at 7.95M vs 878K (9.05x), a massive jump from v8.6.x’s 1.48x. This is the iterator overhaul at work, cached comparators on the SSTable struct, block reuse on forward seeks, and the sequential cursor_next advance when the target key is past the current block all compound here. Sequential seeks land at 2.06M vs 1.67M (1.23x) and Zipfian at 3.99M vs 1.79M (2.23x). The posix_fadvise willneed hint on the next block position helps hide latency at block boundaries and the merge heap shortcut for one or two remaining sources removes unnecessary rebuild overhead.
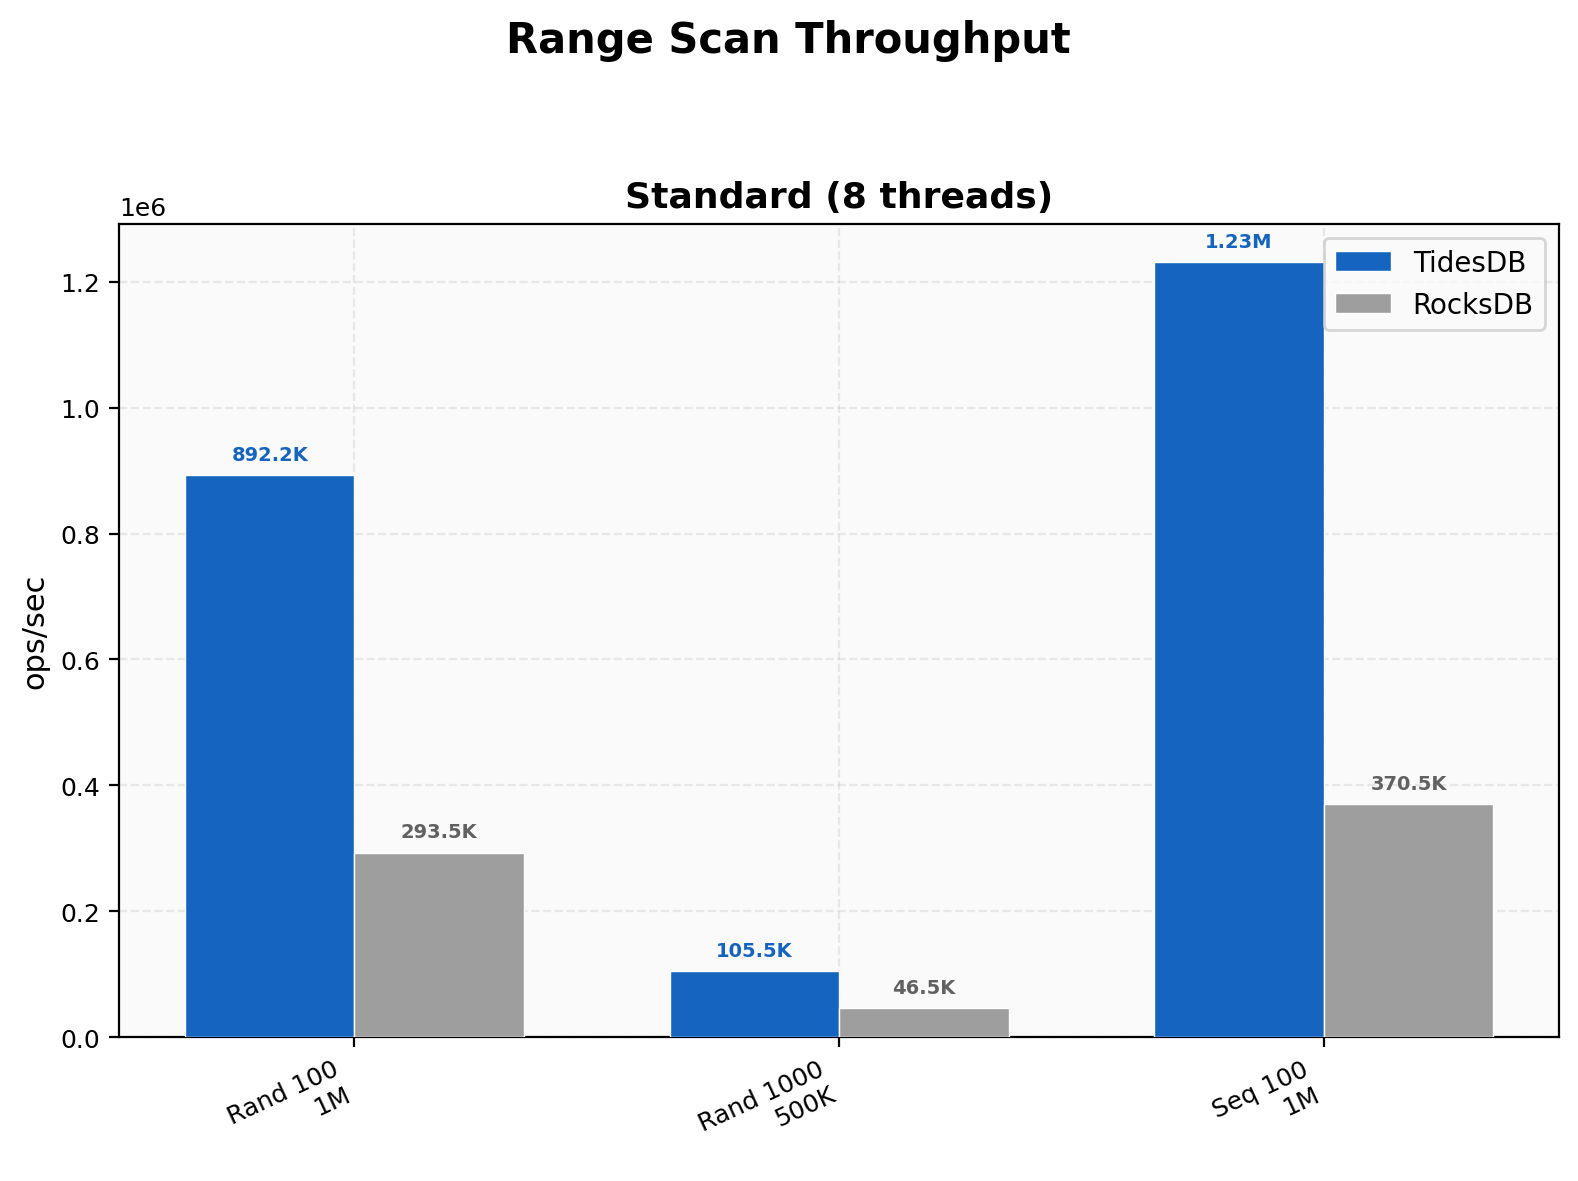
Range Scan Throughput
Random 100-key scans hit 892K vs 293K (3.04x), 1000-key scans 106K vs 46.5K (2.27x), and sequential 100-key 1.23M vs 371K (3.32x). Range scans build on the same iterator improvements as seeks, wider scans amortize the initial seek cost over more keys and TidesDB’s edge holds steady.
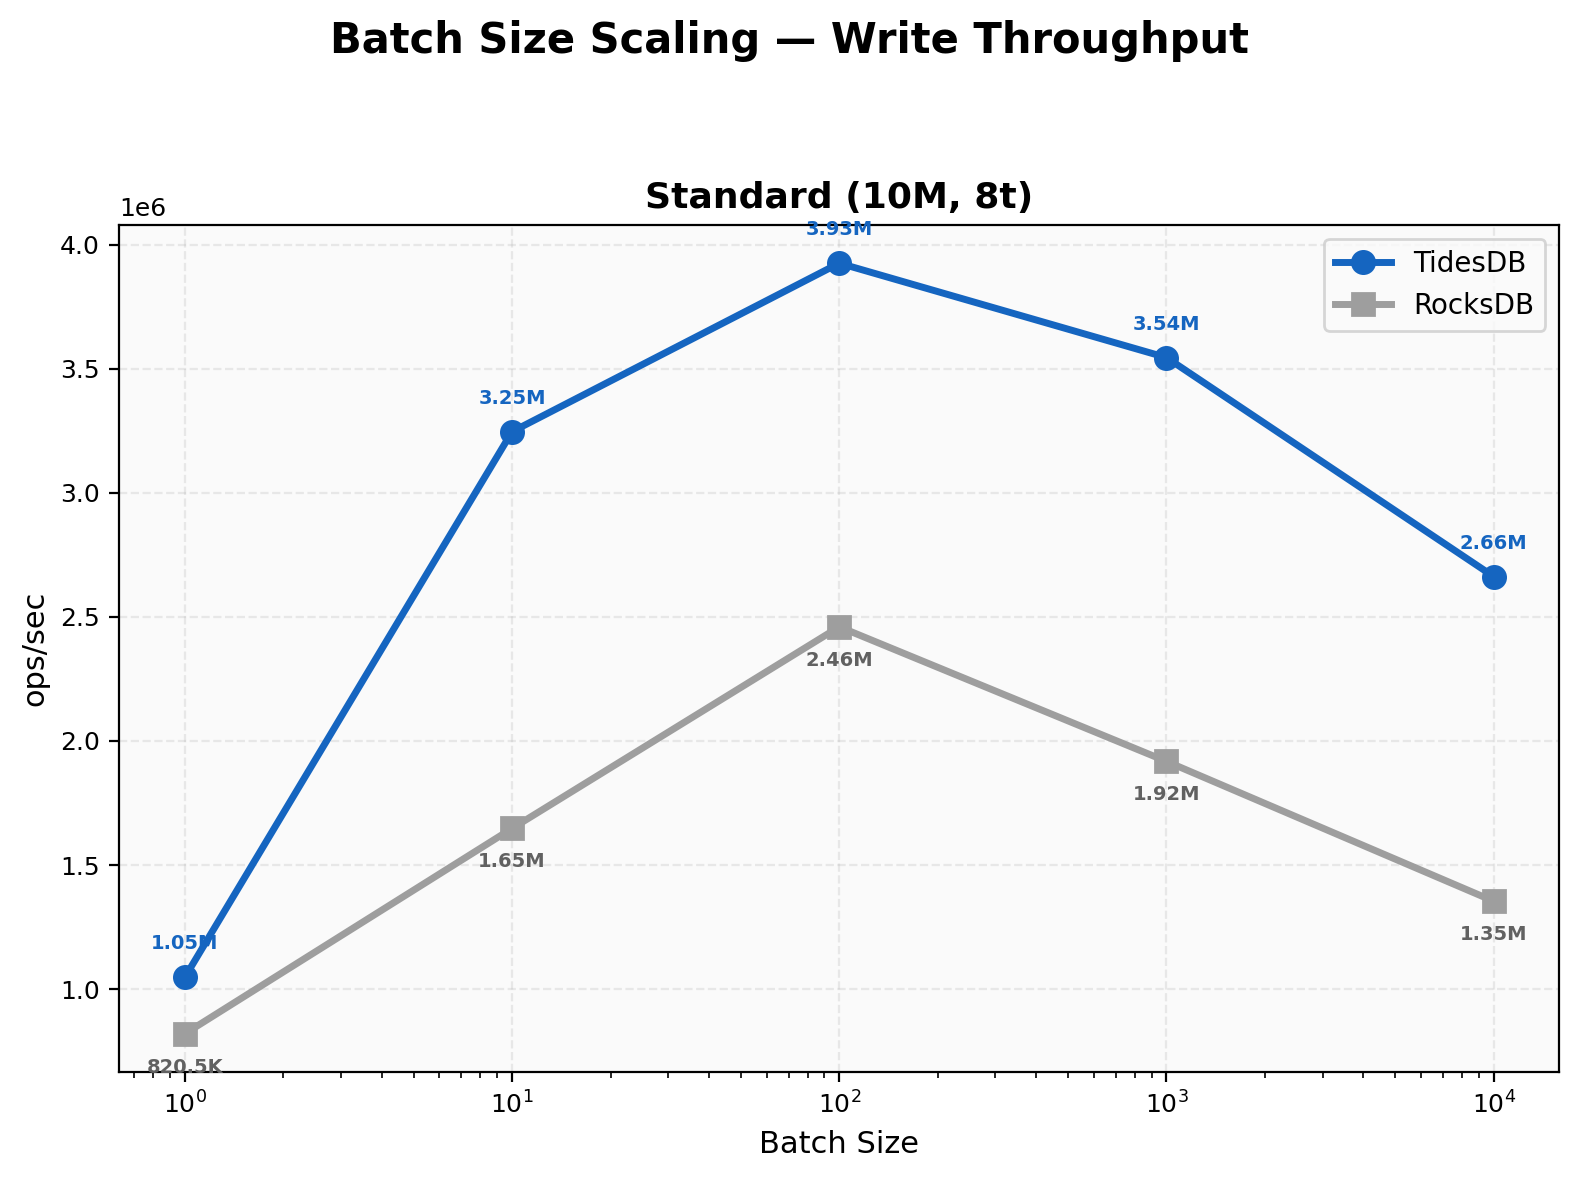
Batch Size Scaling
At batch 1 TidesDB leads at 1.05M vs 821K (1.28x), which is a reversal from v8.6.x where RocksDB won at that granularity. The backpressure consolidation from O(num_ops) to O(num_cfs) atomic loads per transaction is directly responsible, unbatched writes no longer pay per-operation overhead. Batch 10 hits 3.25M vs 1.65M (1.97x), batch 100 at 3.93M vs 2.46M (1.60x), batch 1000 at 3.54M vs 1.92M (1.85x), and batch 10000 at 2.66M vs 1.35M (1.97x). TidesDB leads across the entire range now.
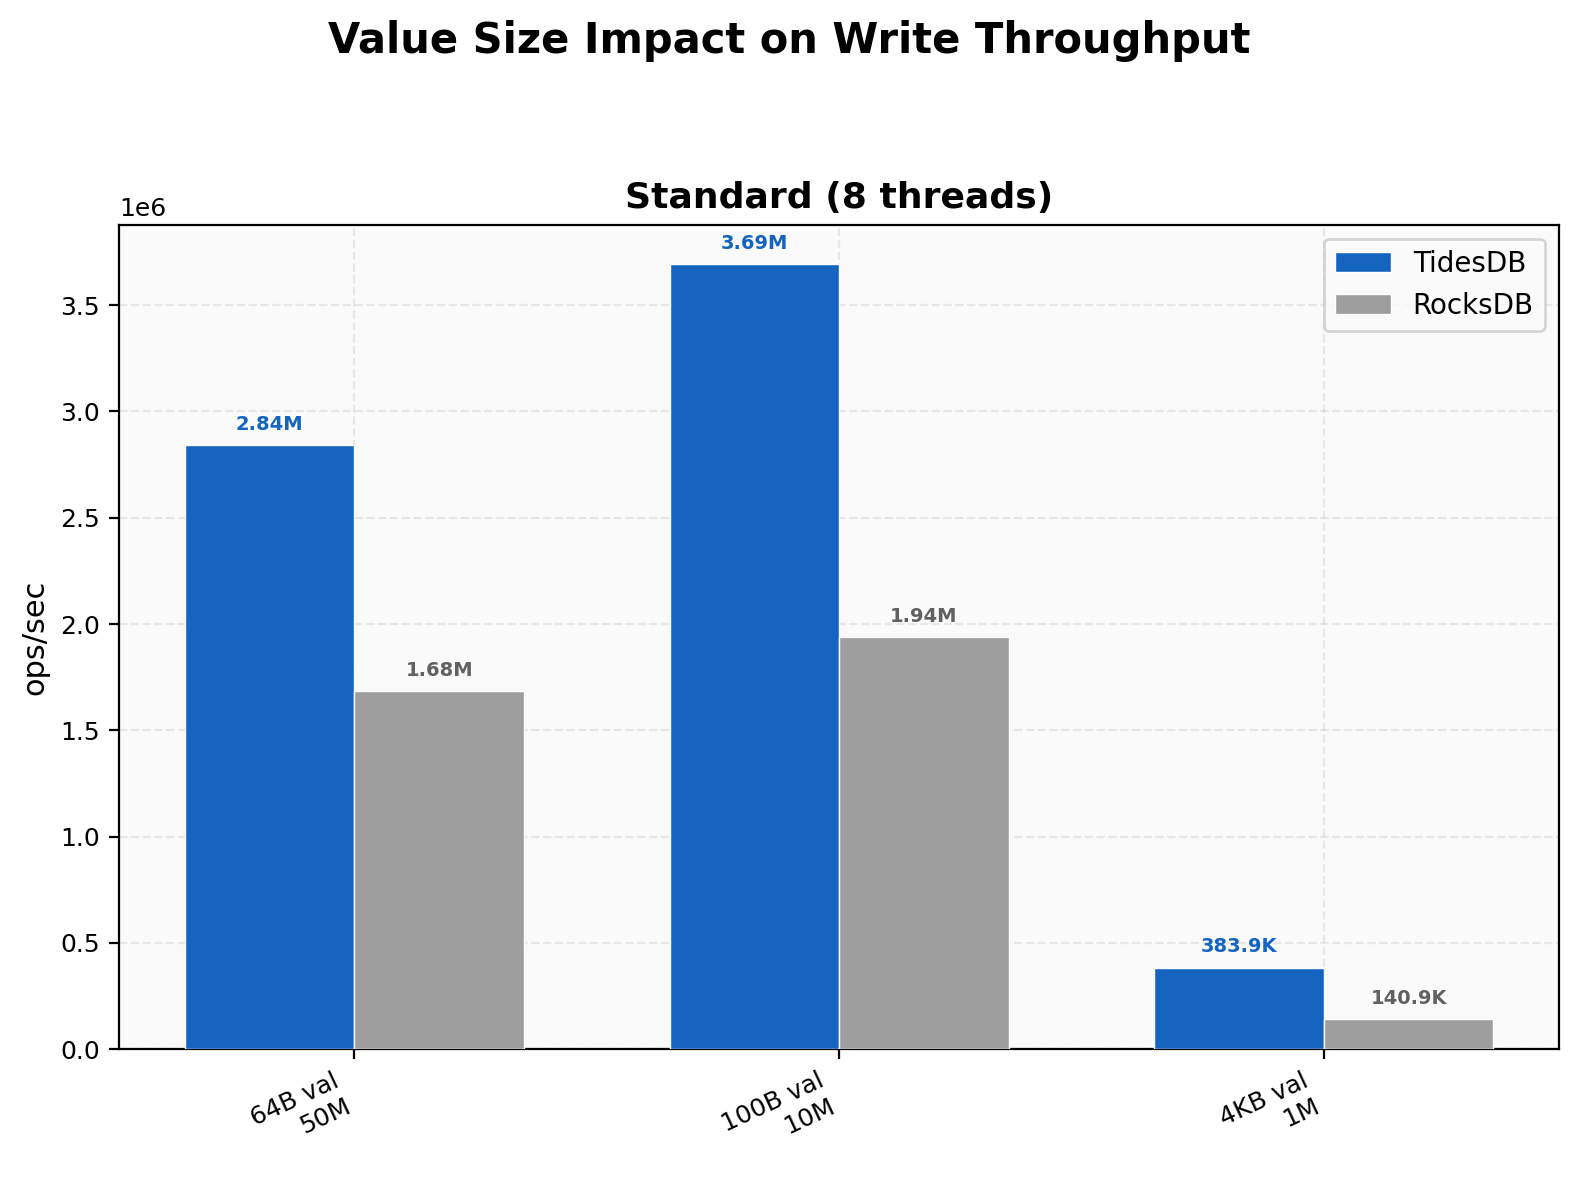
Value Size Impact
TidesDB’s advantage grows with value size, from 1.69x at 64B (50M keys) to 1.91x at 100B (10M keys) to 2.72x at 4KB (1M keys). At 4KB values TidesDB hits 384K vs 141K, and RocksDB’s p99 spikes to 507,349 µs while TidesDB stays at 35,326 µs. The raw byte cache change helps larger values particularly since more compressed payload fits per cache line.
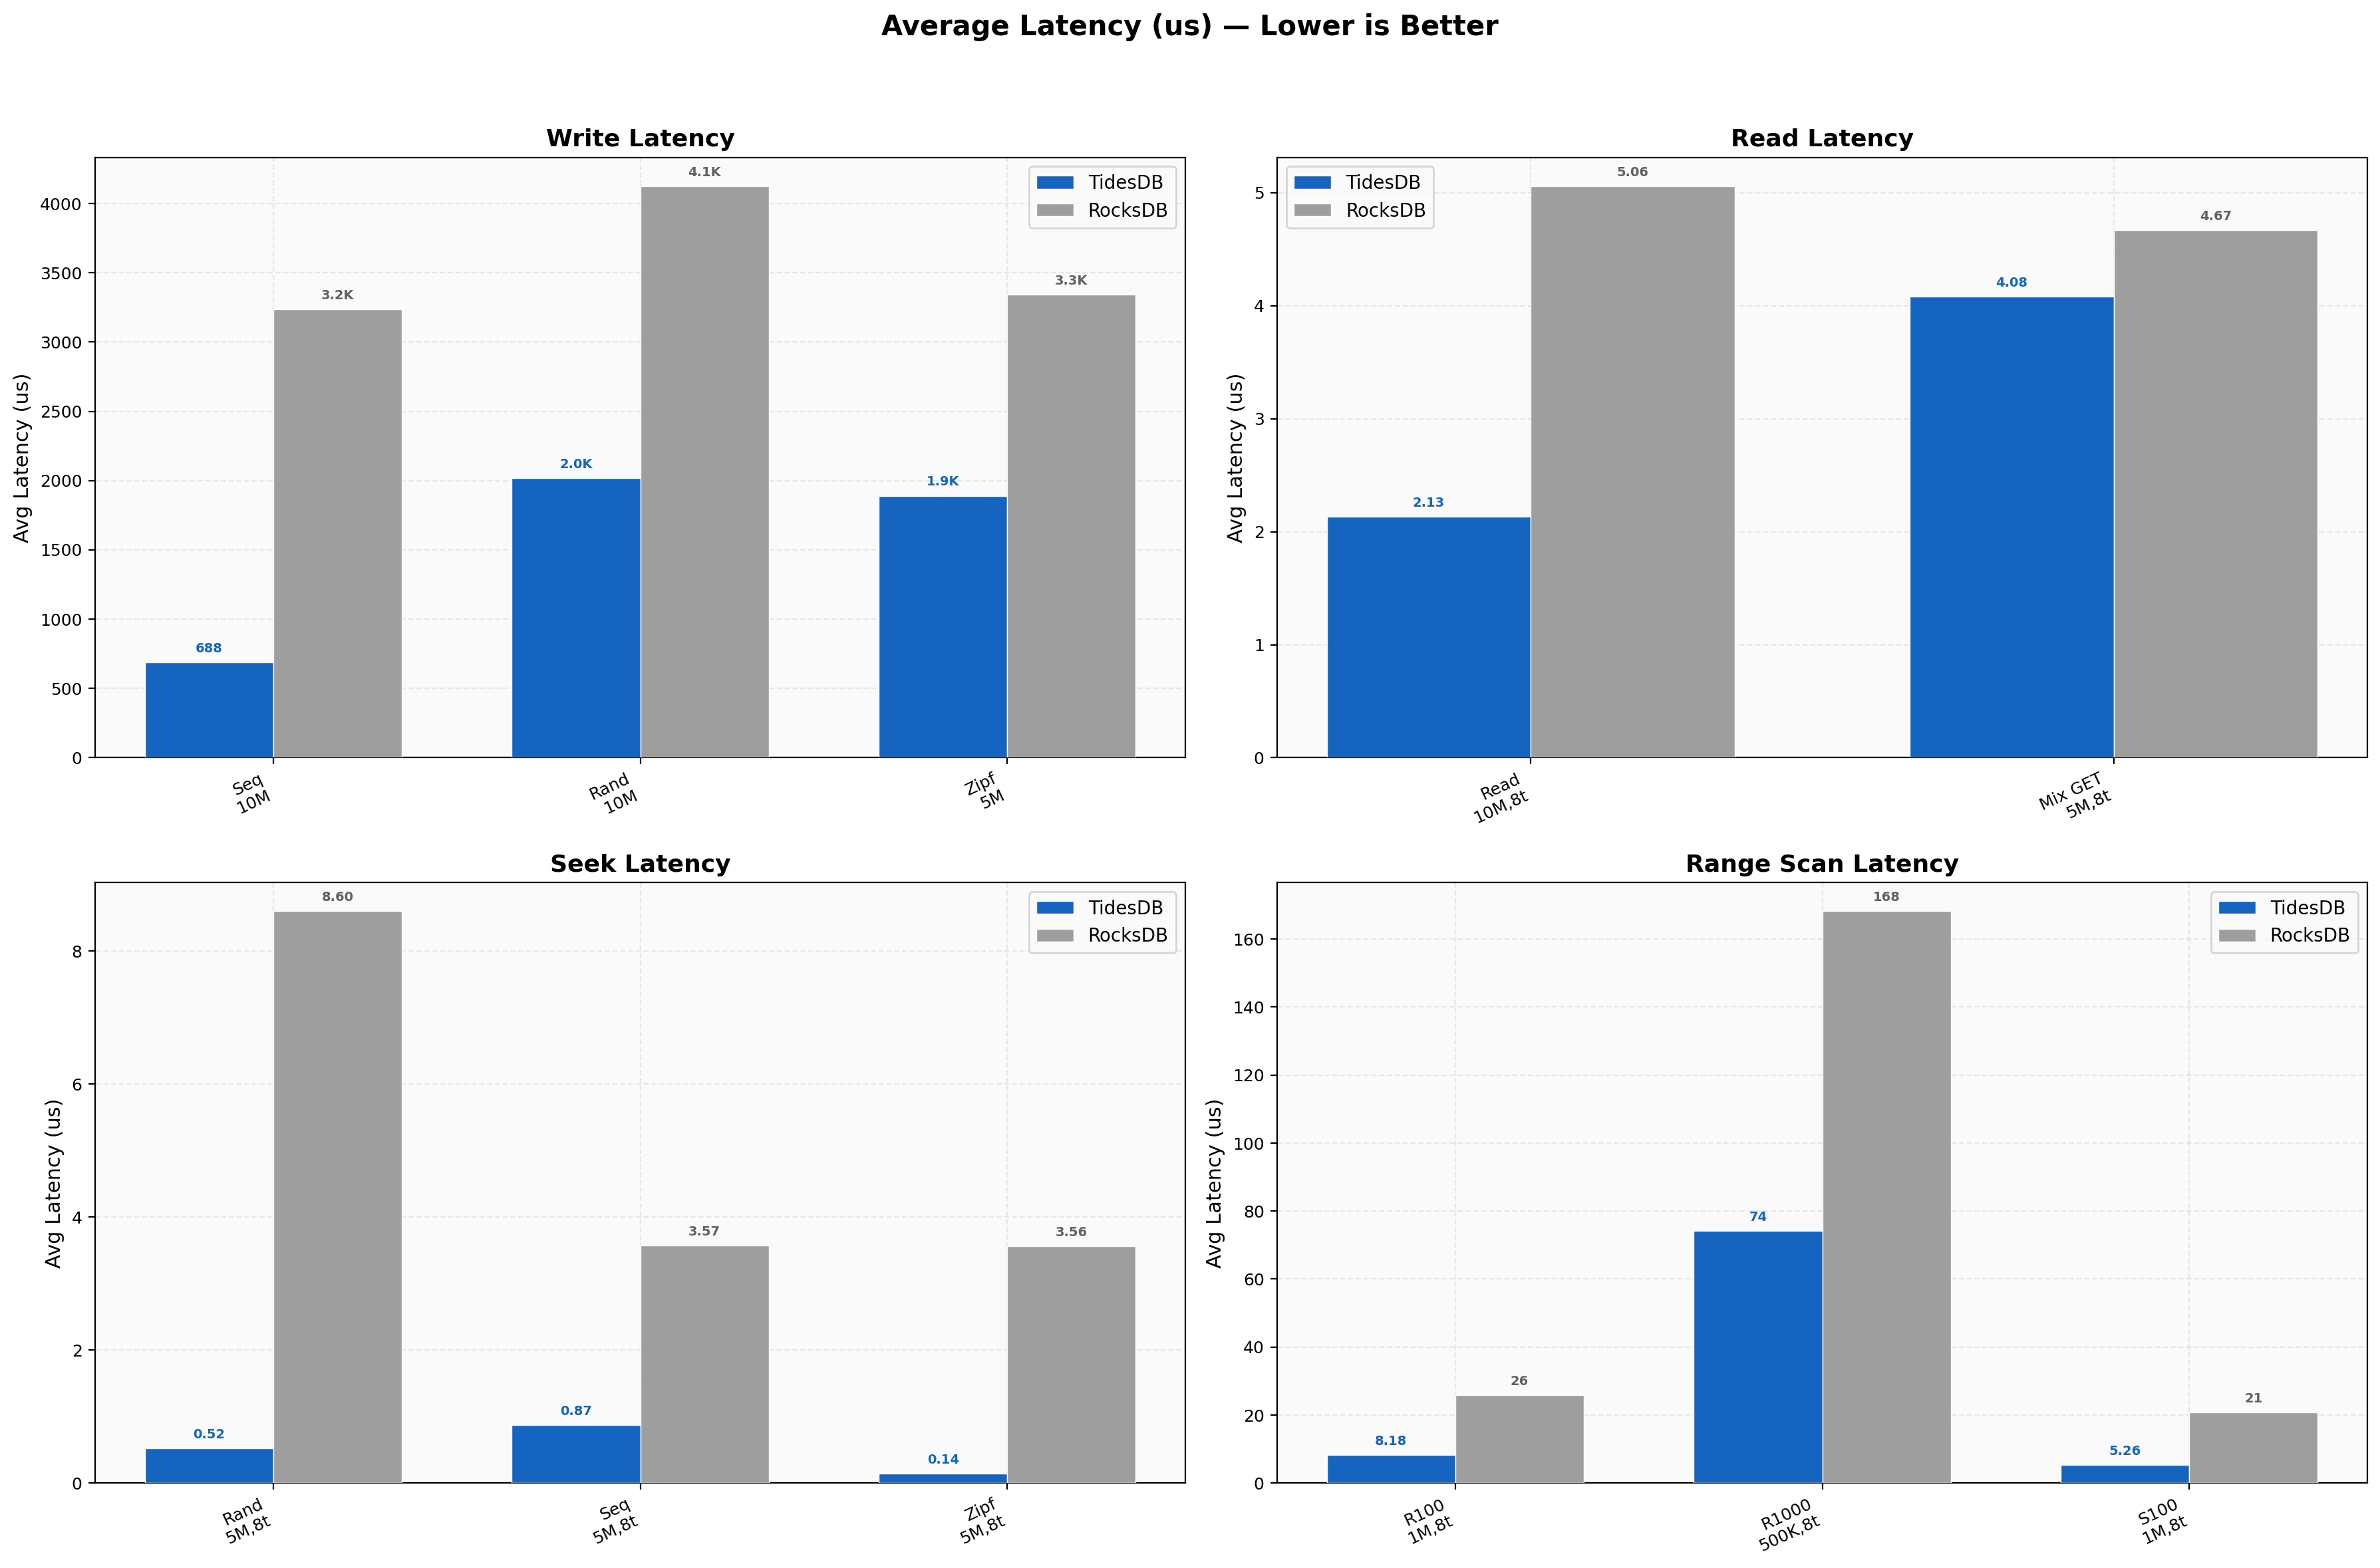
Latency Overview
Average write latency for sequential is 688 µs vs 3,238 µs (4.7x), random 2,016 µs vs 4,127 µs. Read latencies stay sub-5 µs with random reads at 2.13 µs vs 5.06 µs and random seeks at 0.52 µs vs 8.60 µs (16.5x). The seek latency is remarkably low, the cached comparator and block reuse fast path keep the hot path tight. Range scans scale from 5.26 µs (sequential 100) to 74 µs (random 1000) for TidesDB versus 20.87 µs to 168 µs for RocksDB.
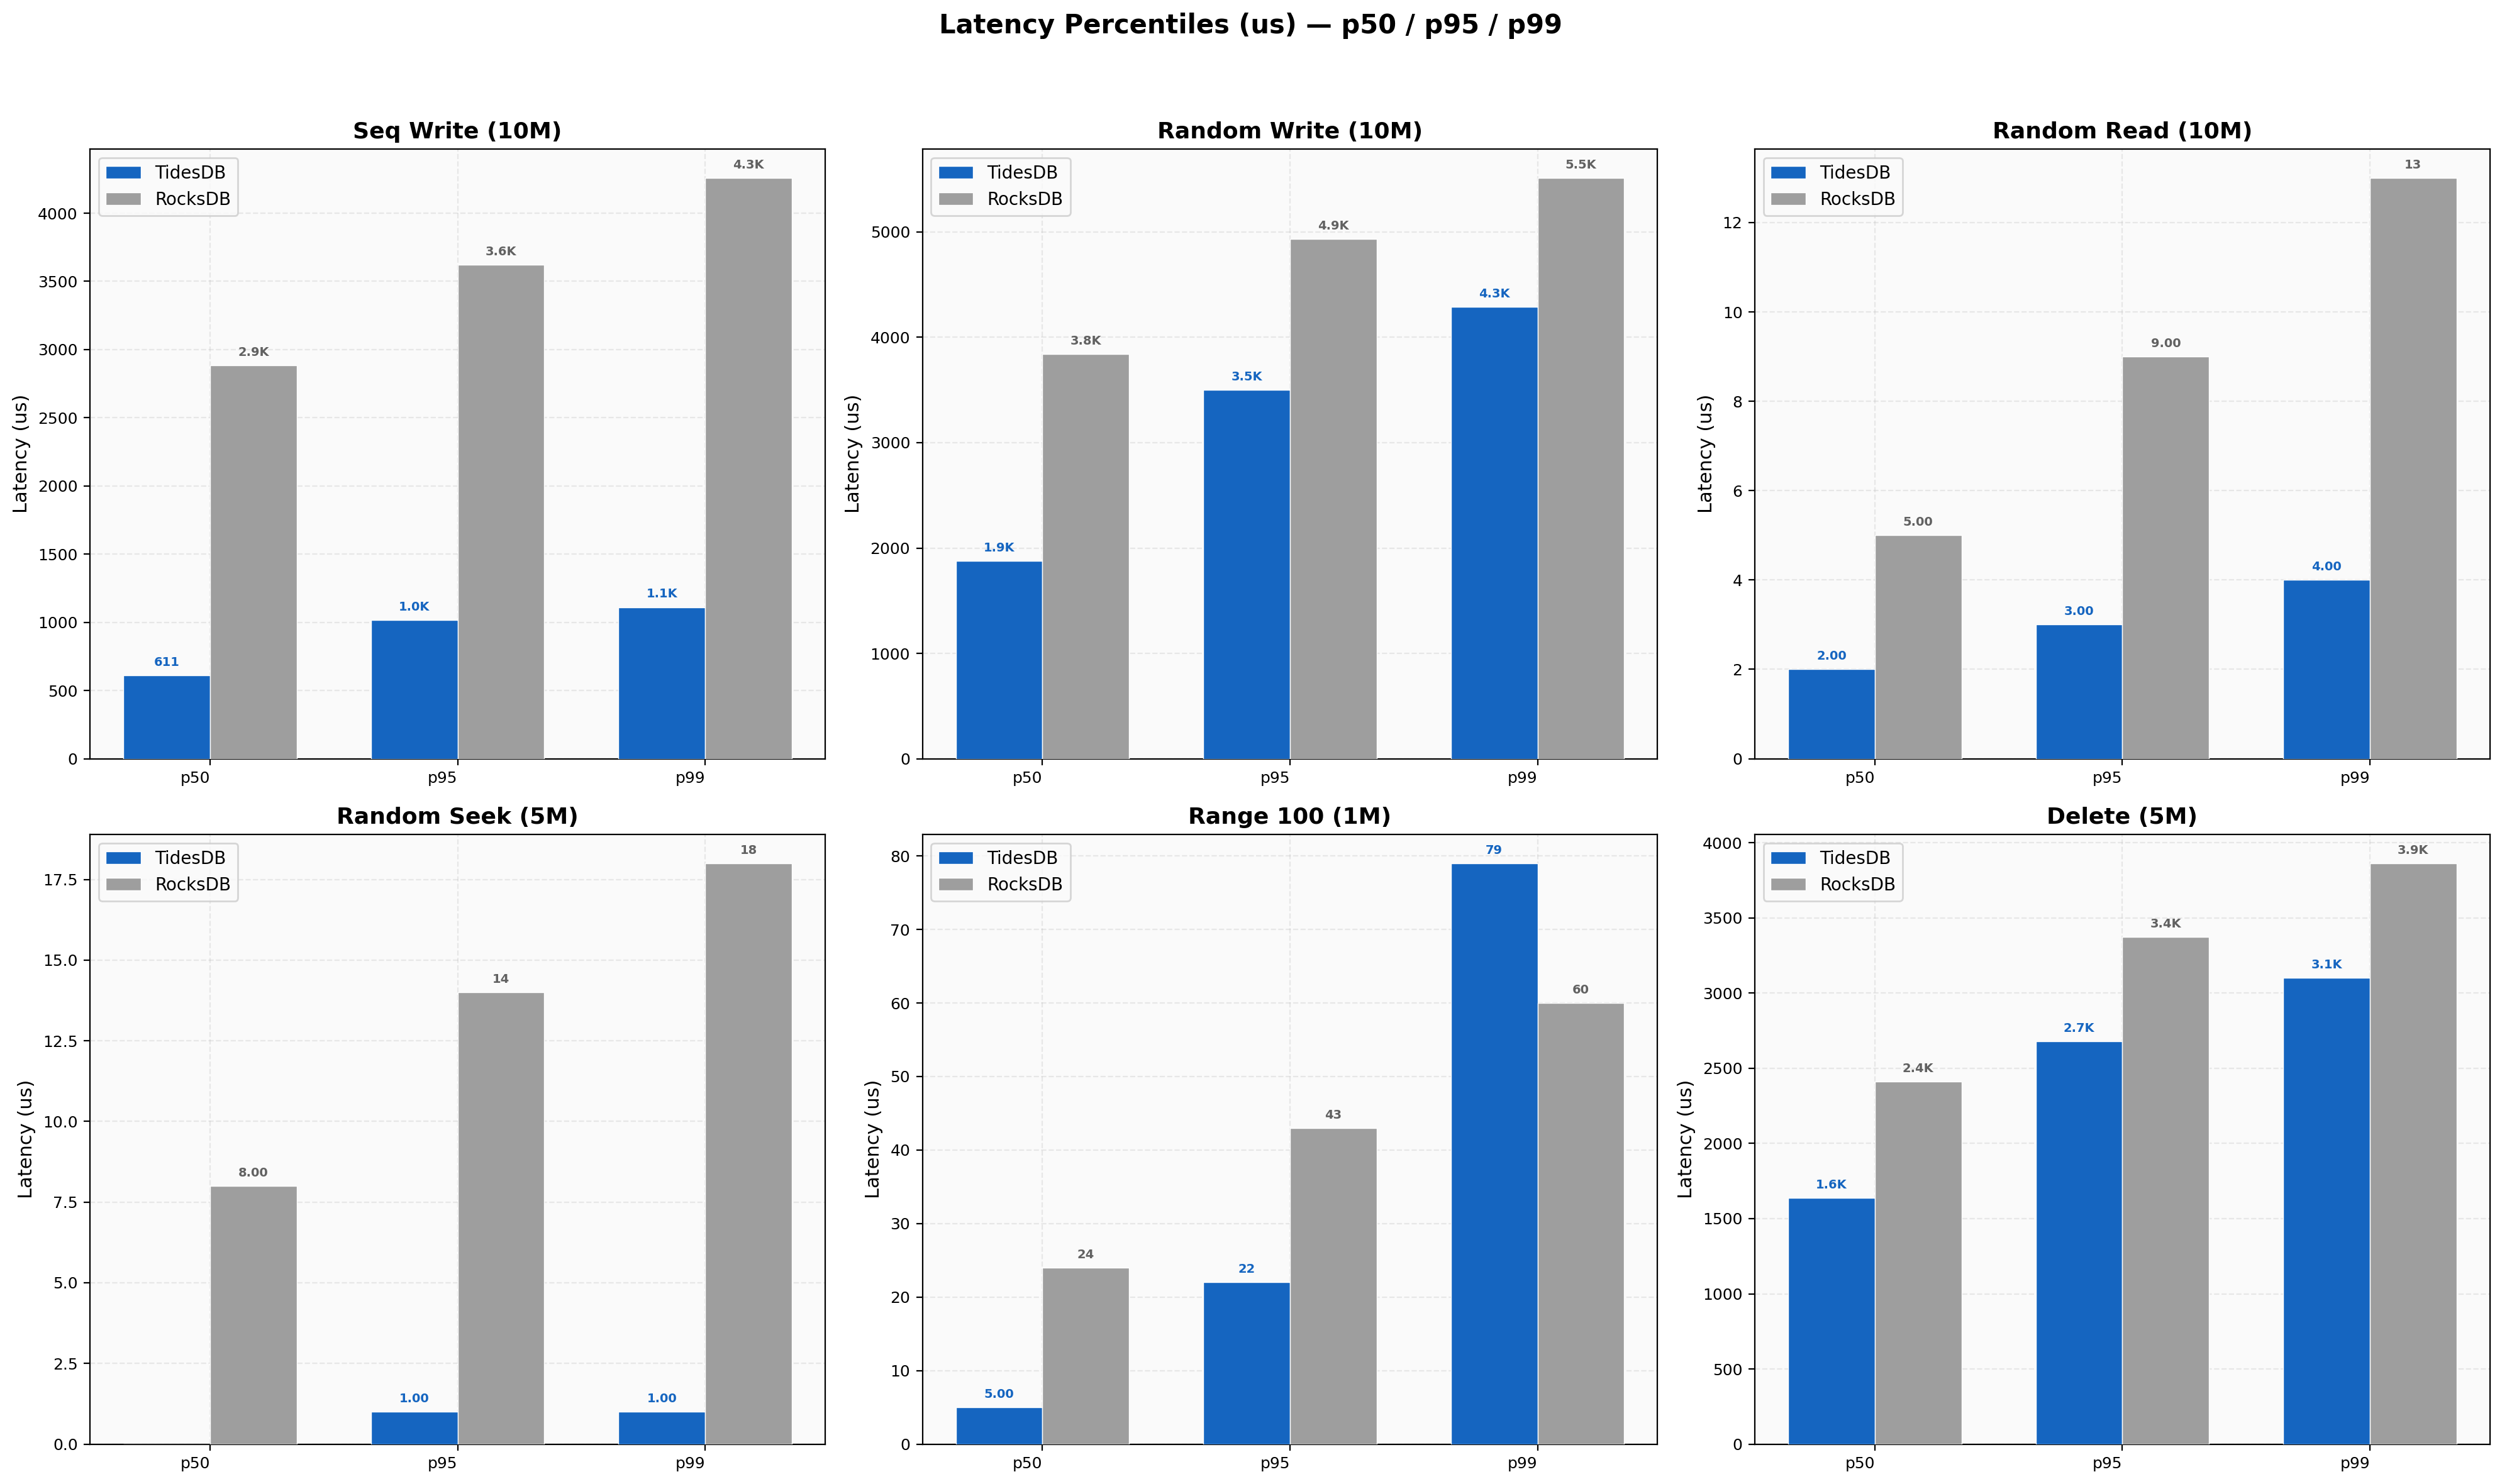
Latency Percentiles
Sequential write p99/p50 ratio is 1.82x for TidesDB (611/1111 µs) vs 1.48x for RocksDB (2885/4259 µs), both tight. Random reads are TidesDB 2/3/4 µs at p50/p95/p99 vs RocksDB 5/9/13 µs. Random seek shows TidesDB at 0/1/1 µs for p50/p95/p99, essentially sub-microsecond median latency. Delete p50/p95/p99 is 1638/2680/3101 µs for TidesDB vs 2410/3372/3864 µs for RocksDB.
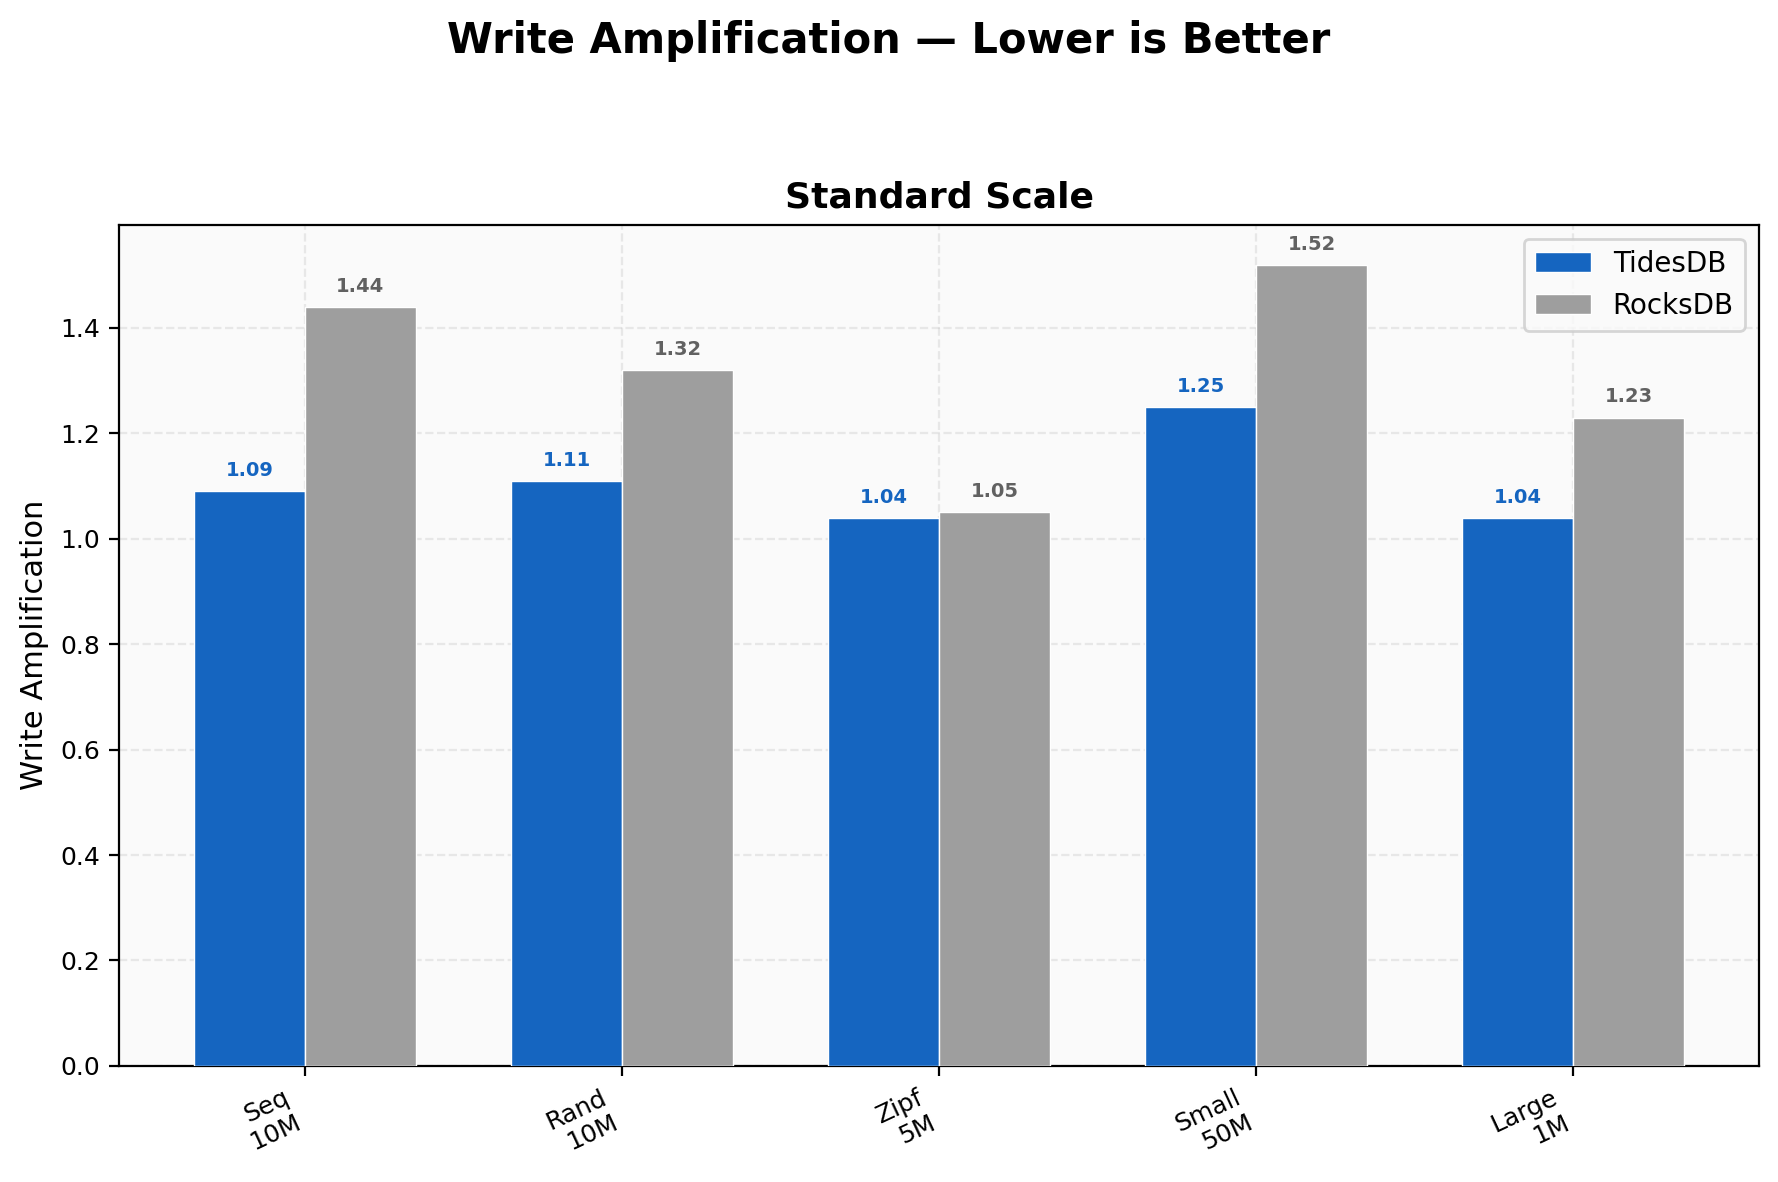
Write Amplification
TidesDB stays between 1.04-1.25 across all workloads; RocksDB ranges 1.05-1.52. The tightest is Zipfian at 1.04 vs 1.05 where hot-key overwrites keep both engines lean. The widest gap is on 50M small-value random writes at 1.25 vs 1.52. Lower write amplification means less SSD wear and less background I/O contention.
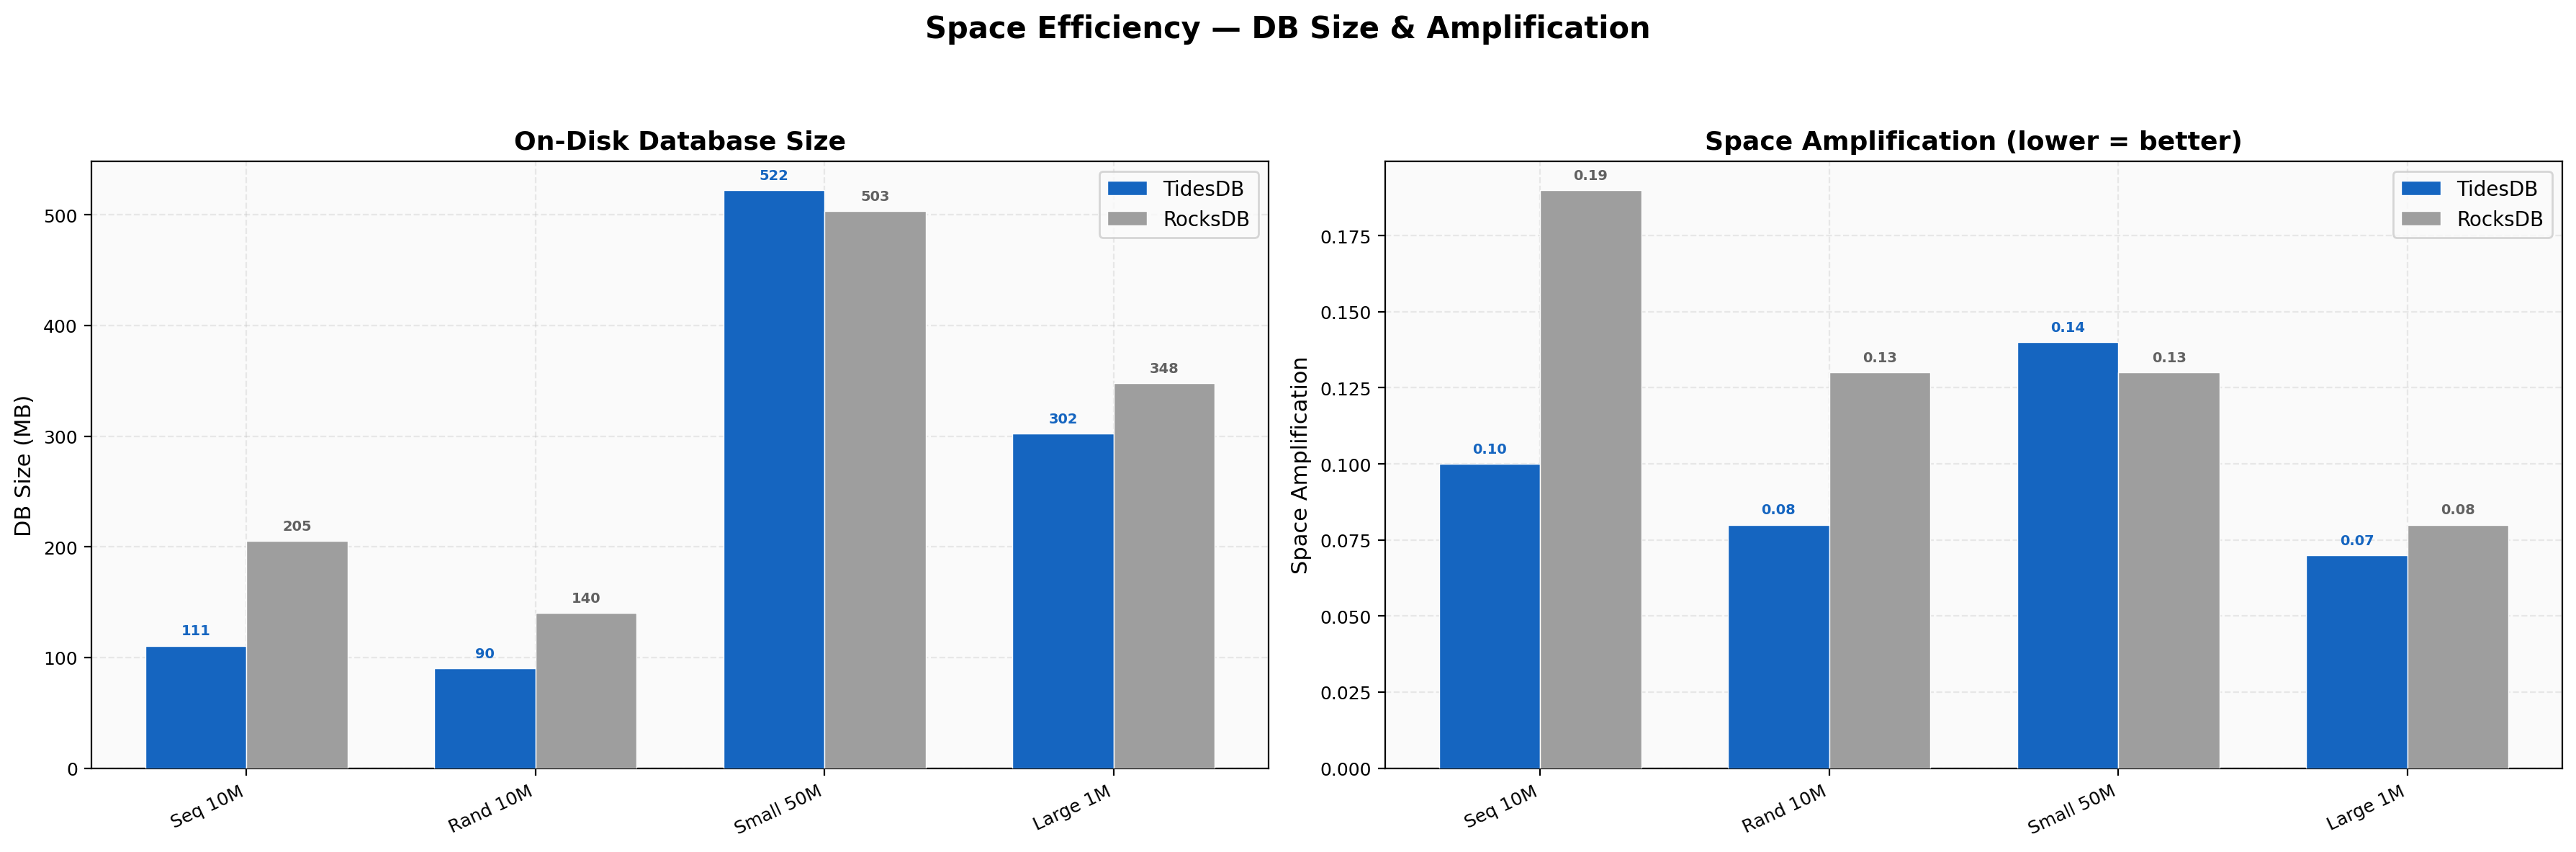
Space Efficiency
Sequential 10M keys land at 111 MB vs 205 MB (46% smaller), random 10M at 90 MB vs 140 MB (36% smaller). Small-value 50M sits at 522 MB vs 503 MB (4% larger for TidesDB). Large-value 1M is 302 MB vs 348 MB (13% smaller). Space amplification ratios are TidesDB 0.07-0.14 vs RocksDB 0.08-0.19.
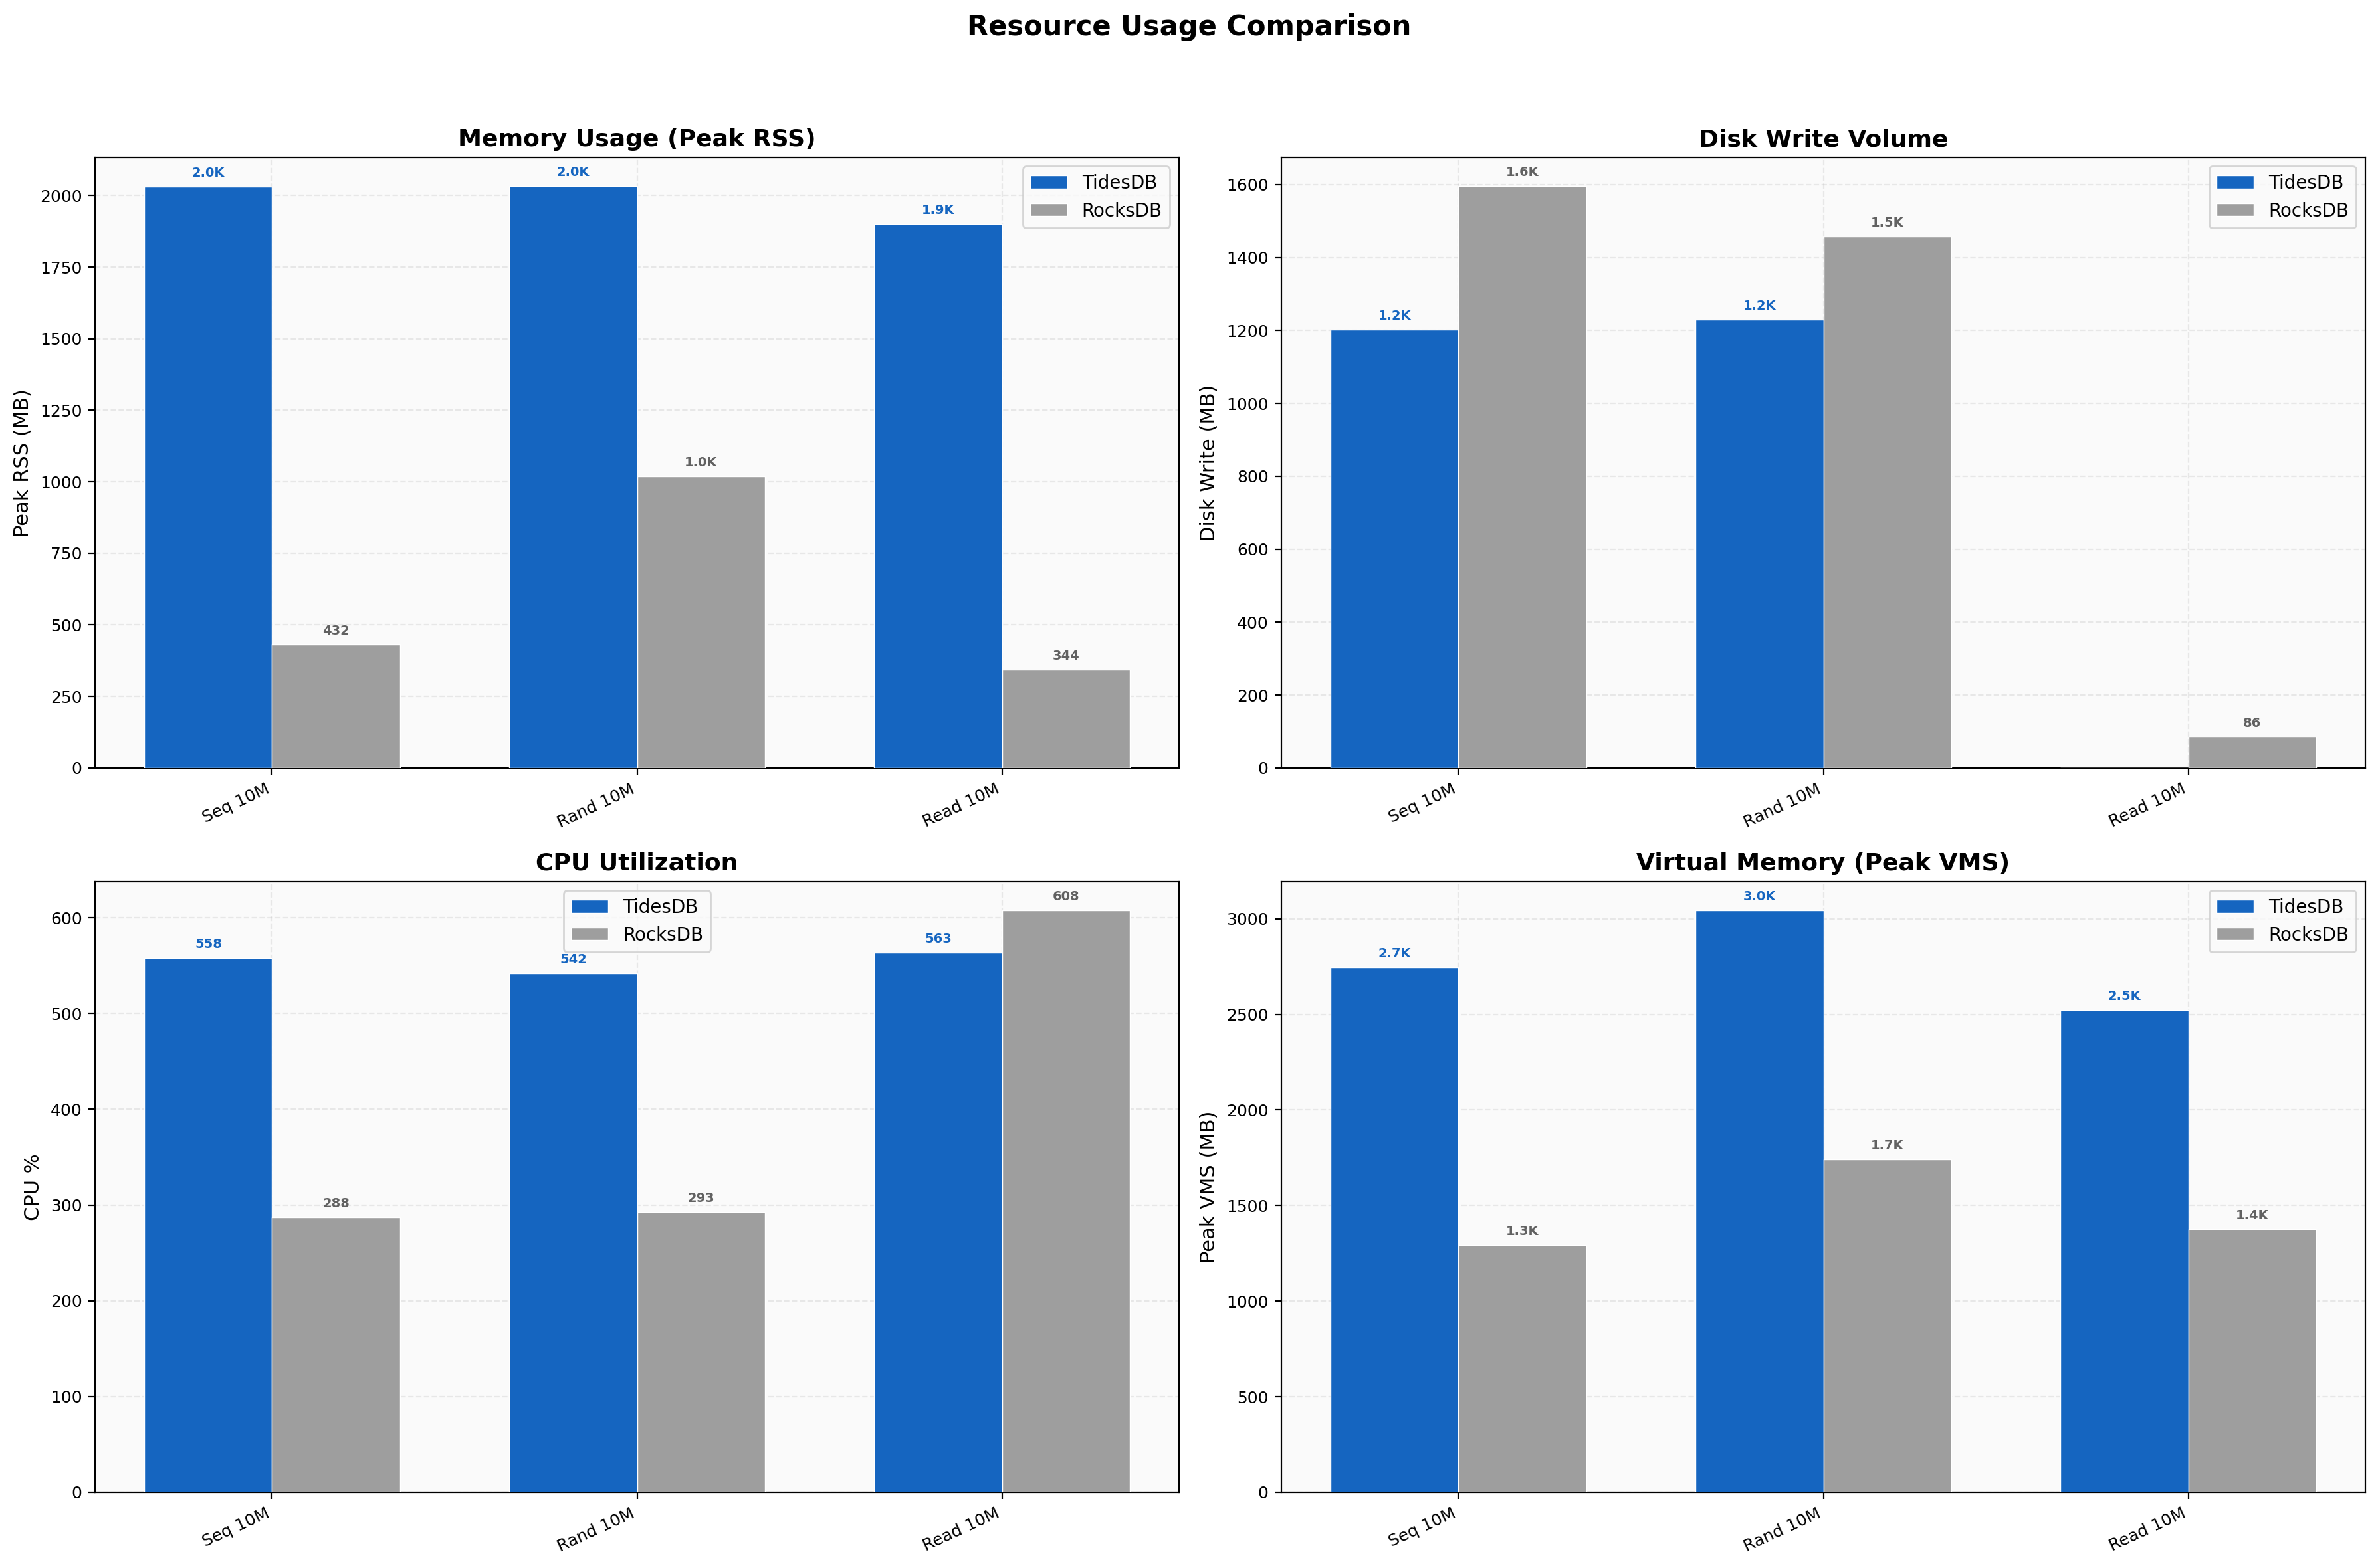
Resource Usage
TidesDB uses more memory as expected, ~2,030 MB vs ~432 MB peak RSS on sequential writes (4.7x), an intentional trade-off for throughput. Disk writes are lower for TidesDB in most tests at 1,202 MB vs 1,595 MB for sequential 10M, consistent with the write amplification numbers. CPU runs higher on writes (558% vs 288%) from more aggressive parallelism.
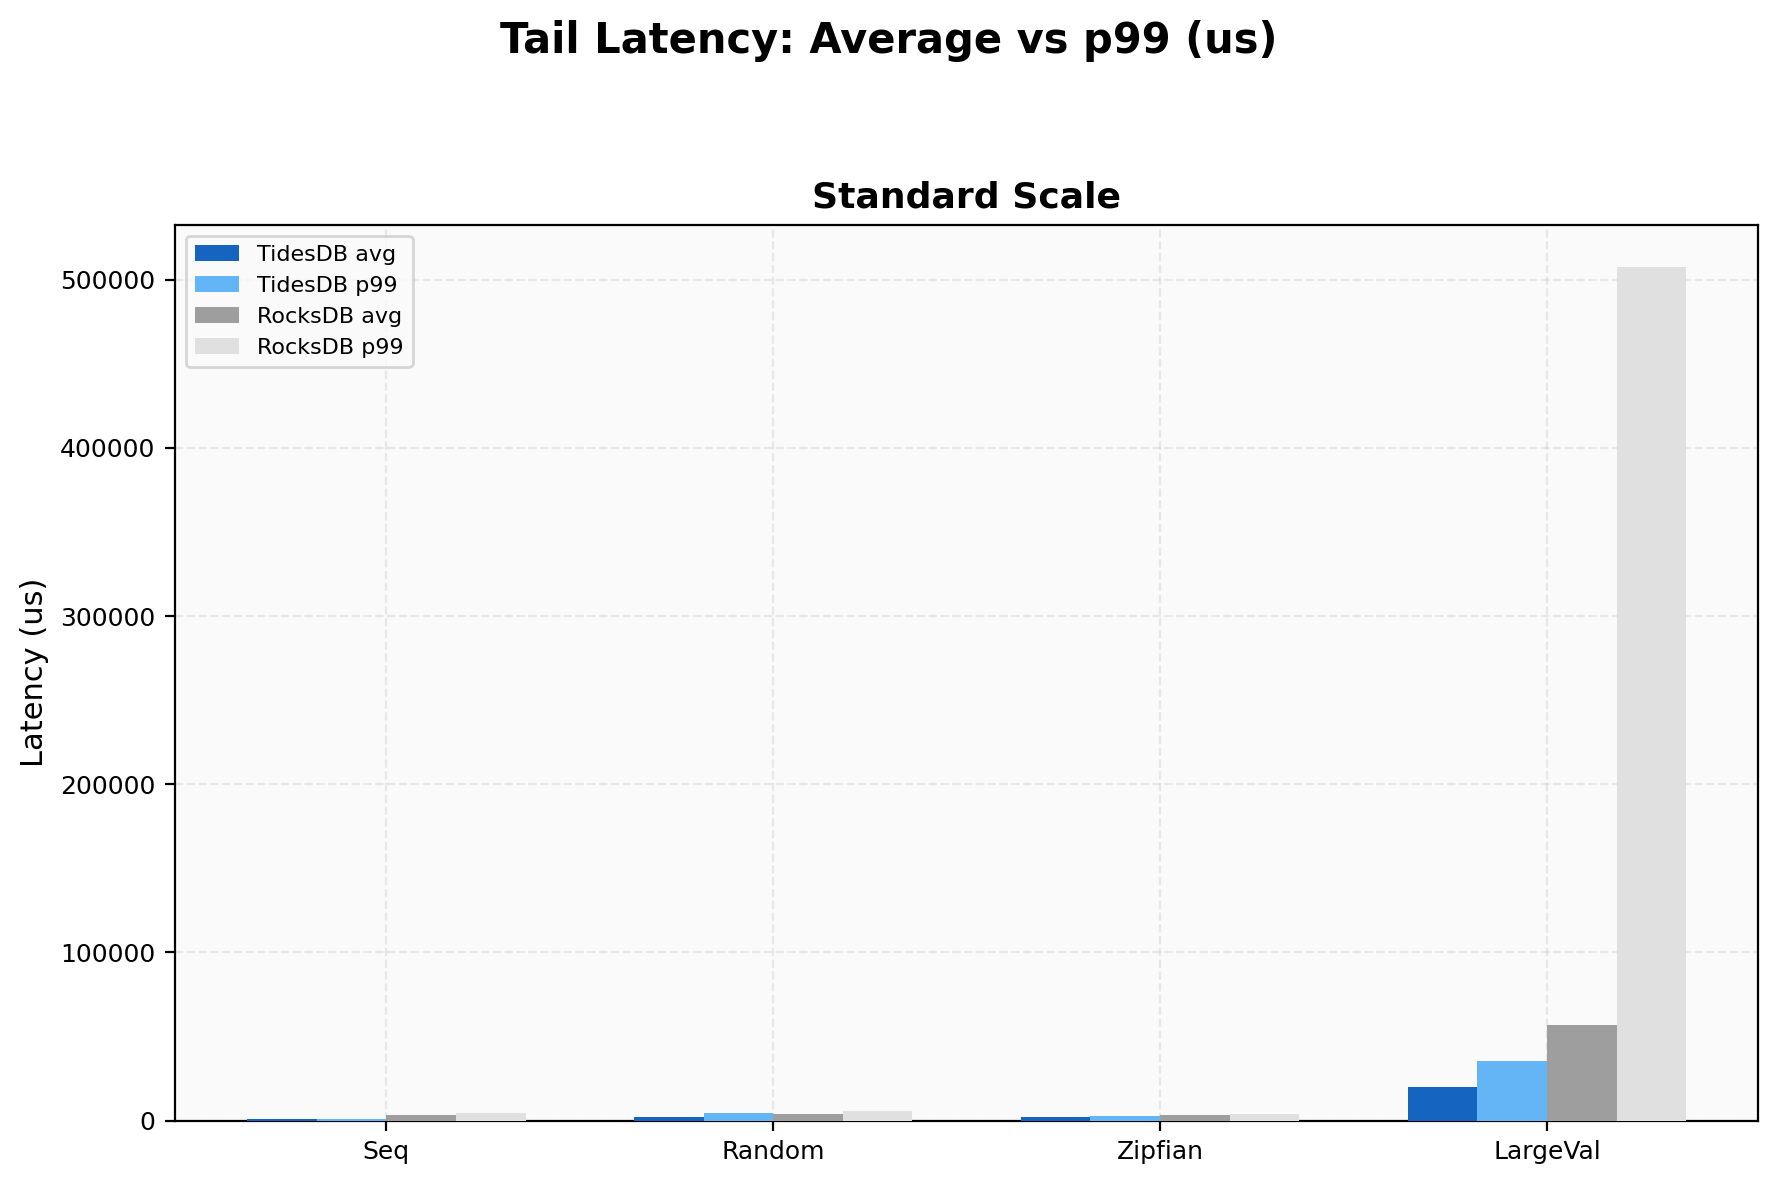
Tail Latency
On 4KB values TidesDB p99/avg is 1.79x (35,326 µs / 19,723 µs) while RocksDB is 8.96x (507,349 µs / 56,617 µs). RocksDB’s look’s to stall on large values continue to produce half-second tail spikes. Sequential writes show a ratio of 1.82x for TidesDB vs 1.48x for RocksDB, both relatively tight on this workload.
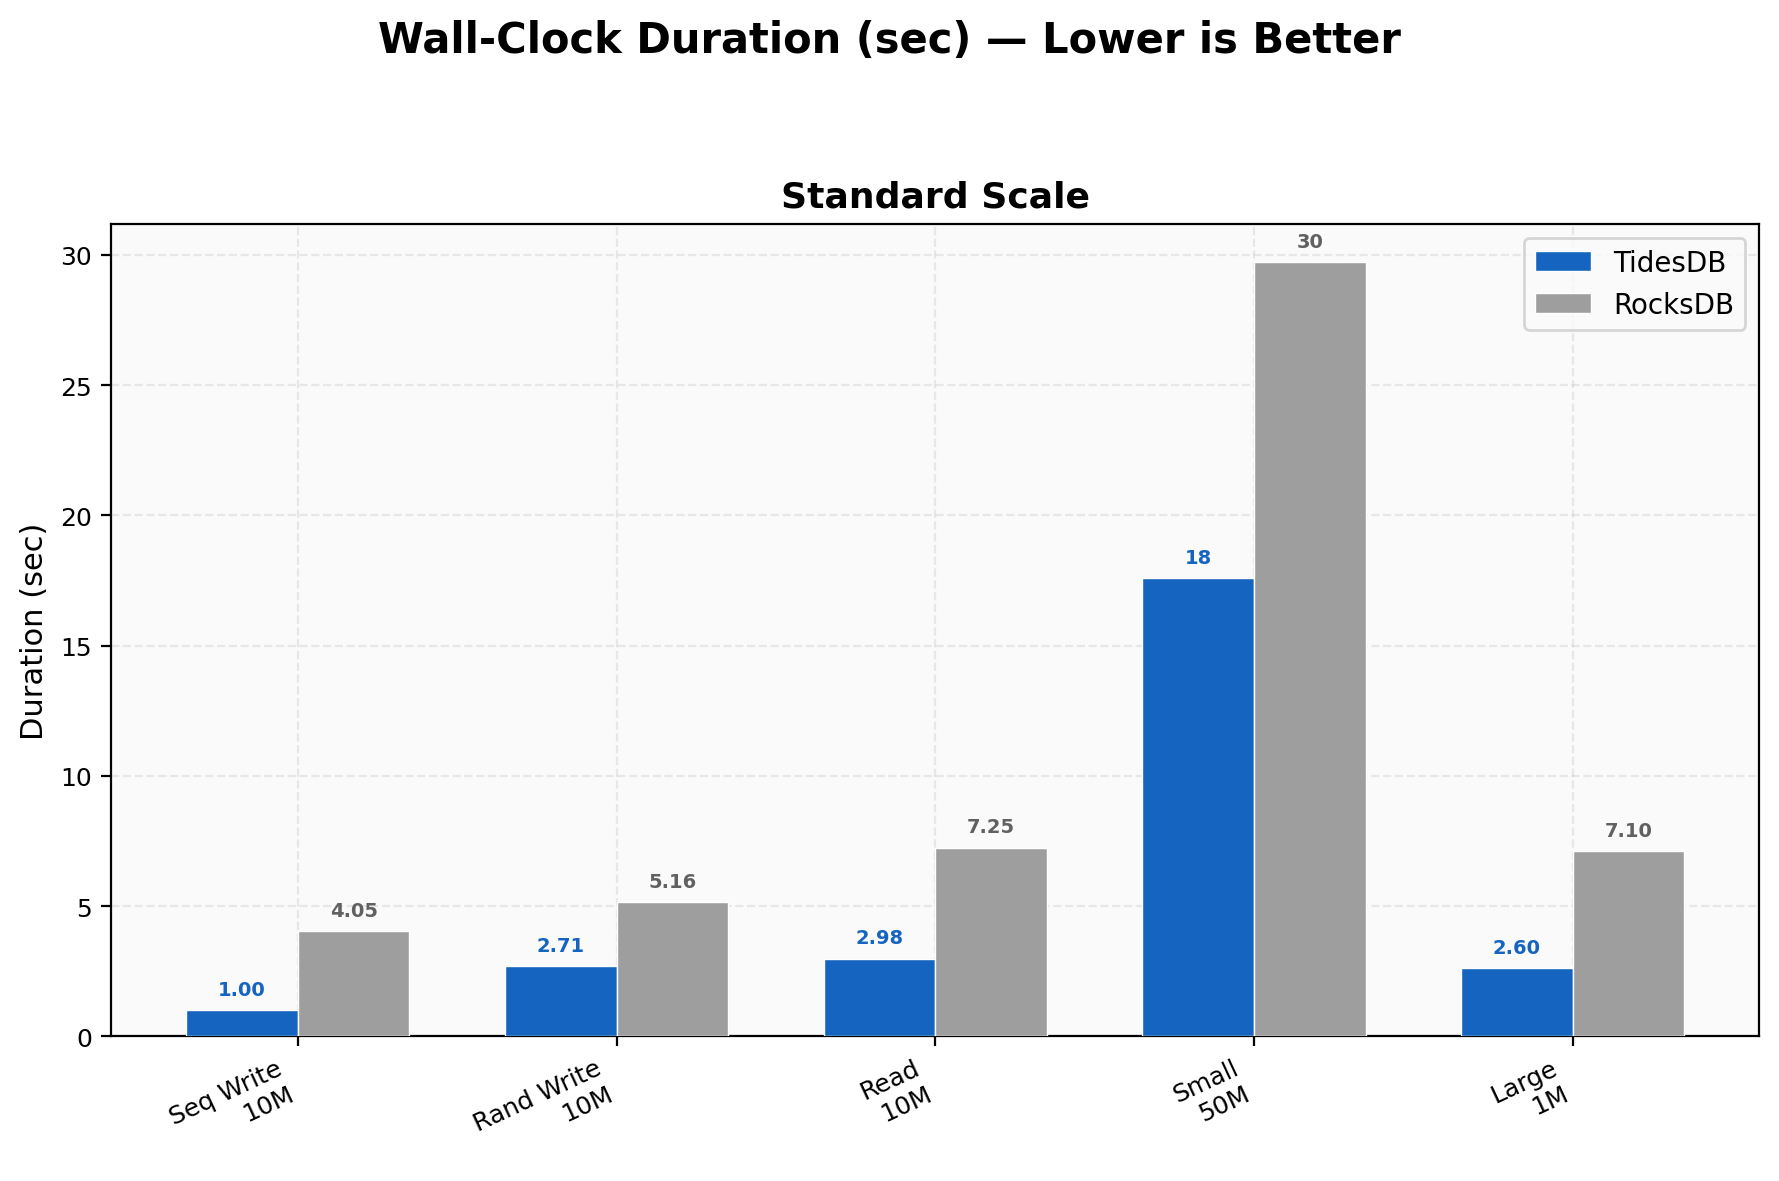
Duration Comparison
10M sequential writes finish in 1.0s vs 4.0s, 10M random writes in 2.7s vs 5.2s, 10M random reads in 3.0s vs 7.2s, 50M small-value writes in 17.6s vs 29.7s, and 1M large-value (4KB) in 2.6s vs 7.1s.
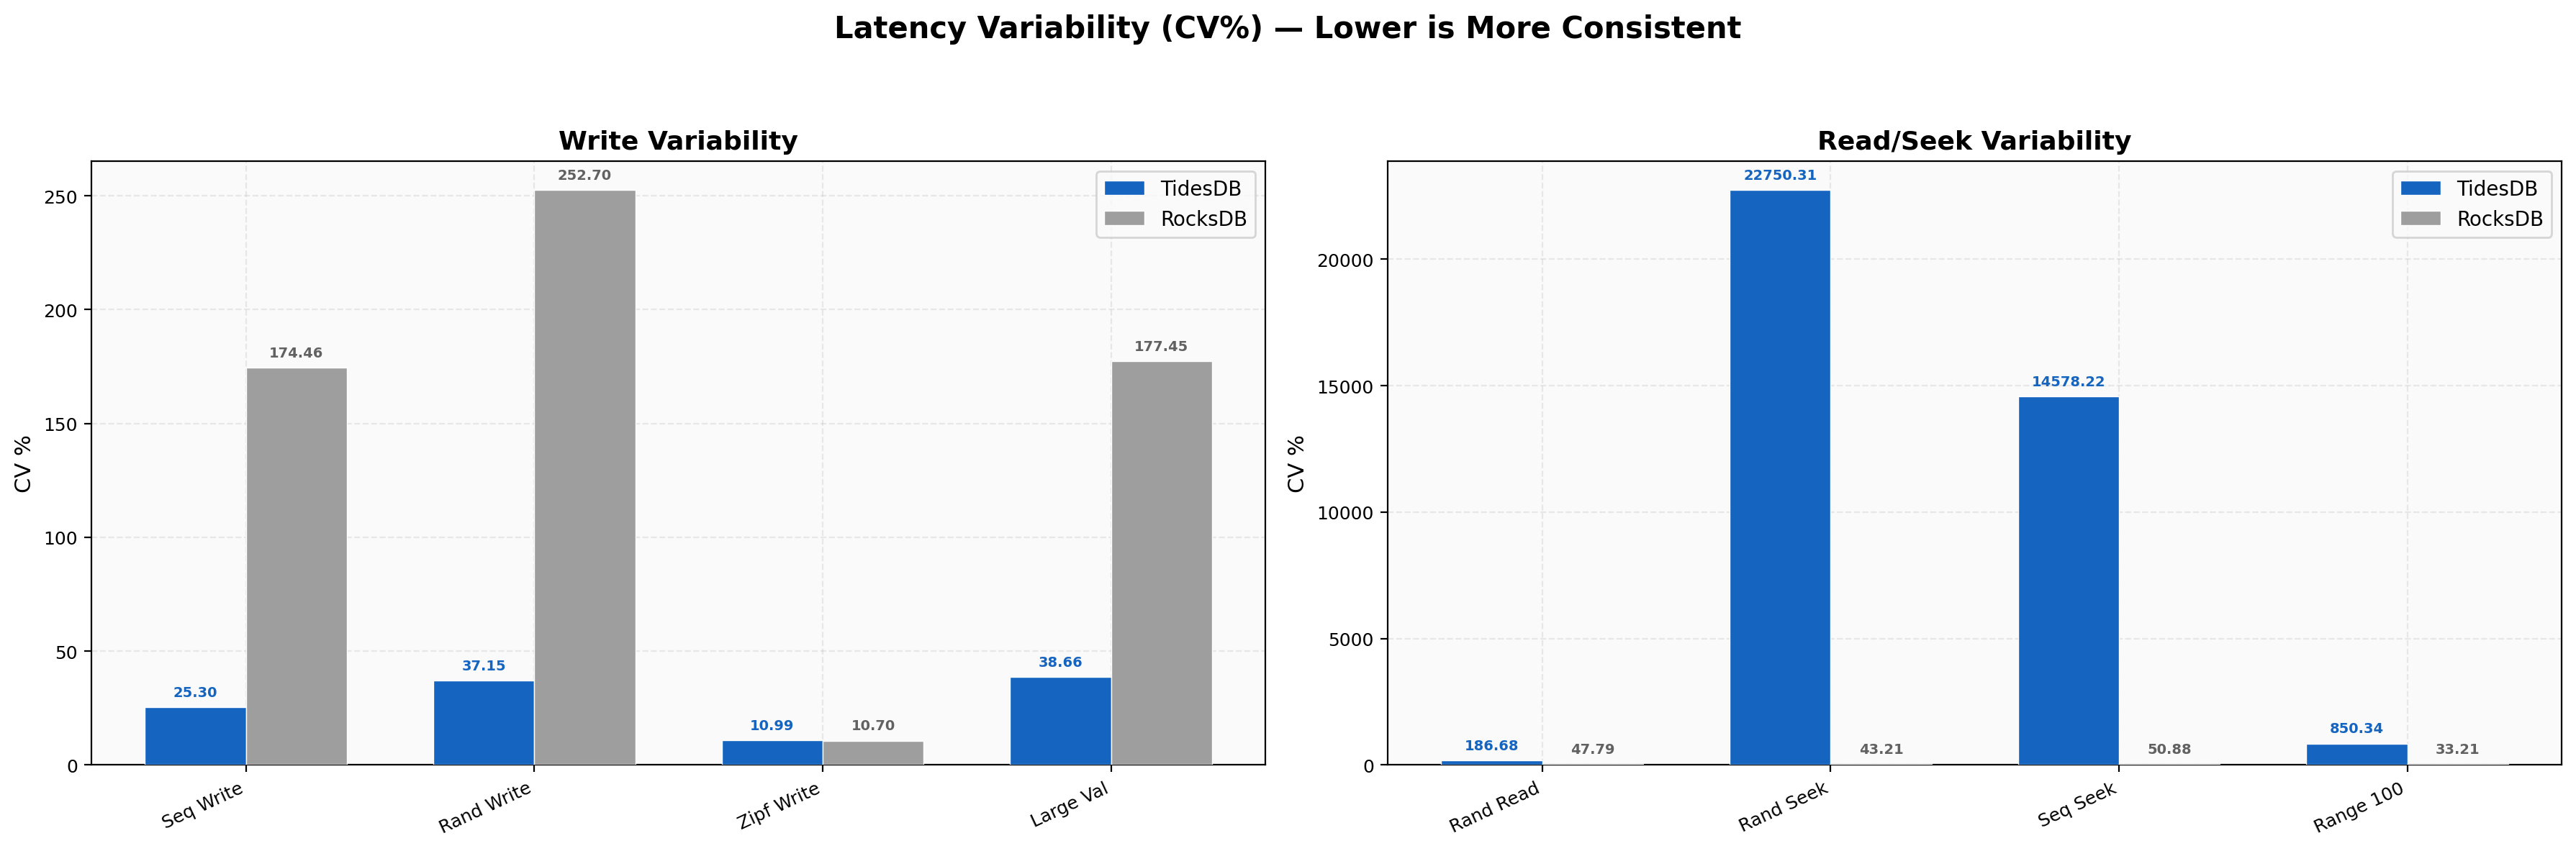
Latency Variability
Write CV is TidesDB 11-38% vs RocksDB 11-457% across write workloads. Zipfian writes are the tightest at 11% for both engines. Random write CV is 37% for TidesDB vs 253% for RocksDB, a 6.8x consistency advantage. Read CV shows TidesDB random reads at 187% vs RocksDB at 48%, the same pattern as before where higher relative variability sits around much smaller absolute latencies (2.13 µs vs 5.06 µs). Random seek CV is very high for TidesDB at 22,750% but that’s a quirk of sub-microsecond median latency where even tiny absolute jitter produces a large coefficient.
Summary
TidesDB v8.7.1 delivers rather great improvements across the board versus v8.6.x, with the most gains in read performance. Random seeks went from 1.48x to 9.05x over RocksDB, a direct result of the iterator and seek overhaul. The cached comparator, block reuse fast path with sequential cursor_next advance, and merge heap shortcut combine to make seeks significantly faster.
The backpressure consolidation from per-op to per-column-family-per-commit fixed TidesDB’s historical weakness on single-key operations. Batch-1 writes and single-key deletes now favor TidesDB where previously RocksDB won, and the double-sleep elimination means mixed workloads no longer over-throttle under combined L0 and memory pressure.
The raw byte cache replacing the old block cache improved cache utilization and shows up in the random read improvement from 2.23x to 2.43x. Write amplification remains consistently lower than RocksDB at 1.04-1.25 vs 1.05-1.52, and space efficiency holds with 36-46% smaller on-disk sizes for standard workloads.
The reaper’s stack-allocated eviction buffer and the pwritev block manager writes are less visible in the headline numbers but contribute to the overall consistency, removing per-cycle mallocs and reducing syscalls on the write path.
That’s all for now.
Thank you for reading!