TideSQL v1.1.0 and InnoDB in MariaDB 12.1 Benchmark Analysis

published on February 2nd, 2026
I’m always hard at work! With the latest TidesDB 8 release I dove into TideSQL to get it up to par. TideSQL now uses the LSMB+ by default though this can be configured. I ran a few sysbench tests to compare the performance of TideSQL v1.1.0 with InnoDB in MariaDB 12.1.
The environment used for the benchmark was:
- Intel Core i7-11700K (8 cores, 16 threads) @ 4.9GHz
- 48GB DDR4
- Western Digital 500GB WD Blue 3D NAND Internal PC SSD (SATA)
- Ubuntu 23.04 x86_64 6.2.0-39-generic
- TidesDB v8.0.0
- TideSQL v1.1.0
- GCC (glibc)
The script used for the benchmark can be found here.
As per usual let’s dive into the results!
Transactions per Second by Workload (TPS)
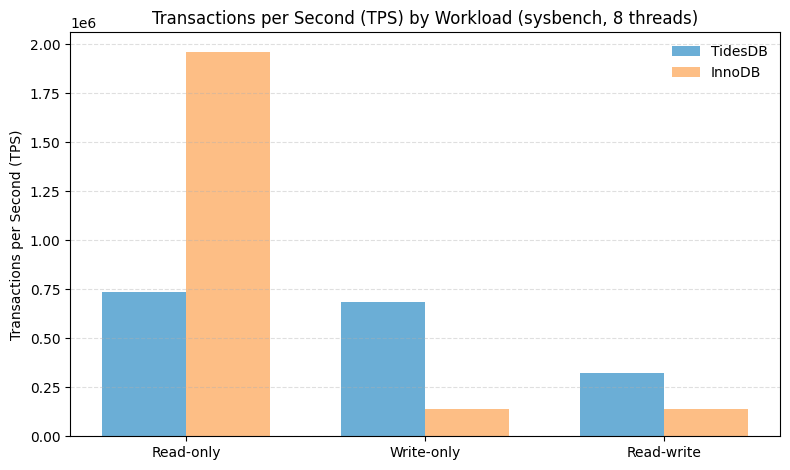
Read-only benchmarks favor InnoDB, which is rather expected. What stands out is the inversion under write and mixed workloads, where TidesDB sustains higher transaction rates.
95th Percentile Latency by Workload (log scale)
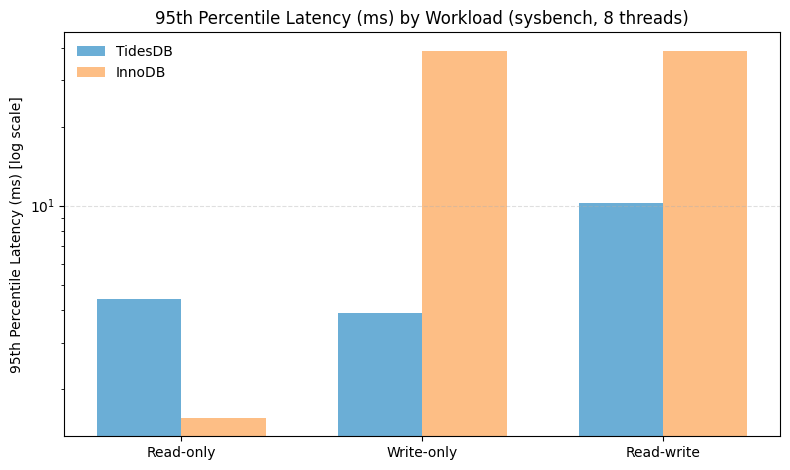
The tail-latency results are more significant than throughput. InnoDB’s p95 latency degrades sharply when writes are introduced, indicating internal contention and queueing effects. TidesDB’s ability to keep p95 latency within a narrow band across workloads shows how our design is optimized for predictability rather than peak-case performance.
p95 Latency vs Time (Read-write workload)
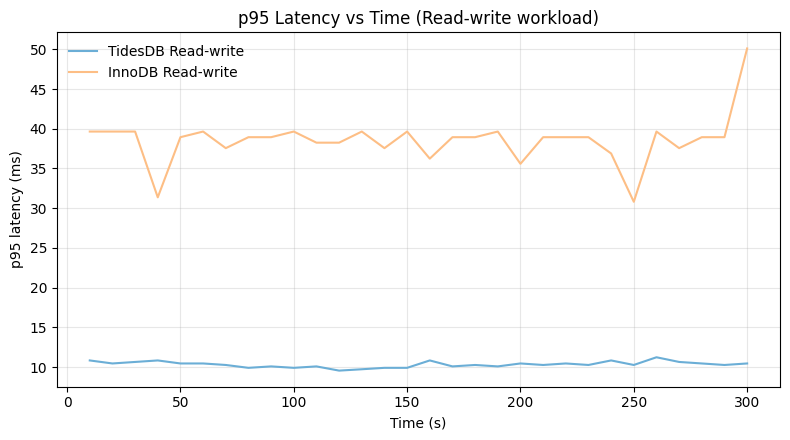
The latency-over-time plot highlights stability rather than peak performance. TidesDB shows a flat p95 curve with minimal variance, indicating that tail latency remains predictable throughout the run. In contrast, InnoDB’s p95 latency is both higher and more volatile, suggesting periodic contention or internal queue buildup under sustained mixed workload pressure. For OLTP systems, usually this kind of variability often matters more than average latency.
TPS (color intensity = higher TPS)
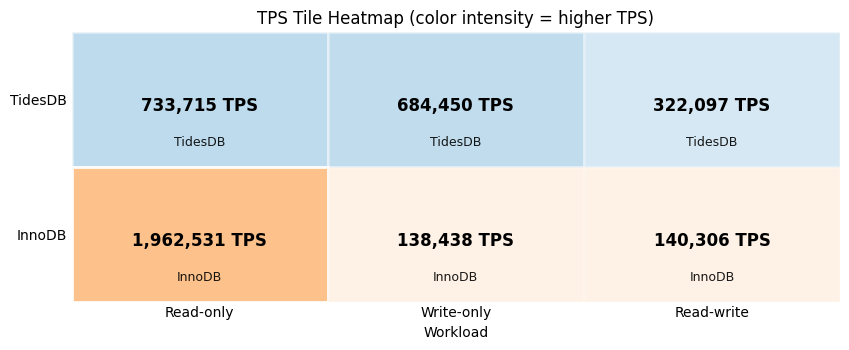
The TPS tiles show a workload-dependent crossover. InnoDB wins decisively on read-only throughput (~1.96M TPS), which is again expected. But once writes are introduced, TidesDB sustains much higher throughput - ~684k TPS on write-only vs ~138k for InnoDB, and ~322k vs ~140k on read-write. This is the pattern you expect when write-side coordination becomes the limiting factor!
p95 Latency (color intensity = lower latency)
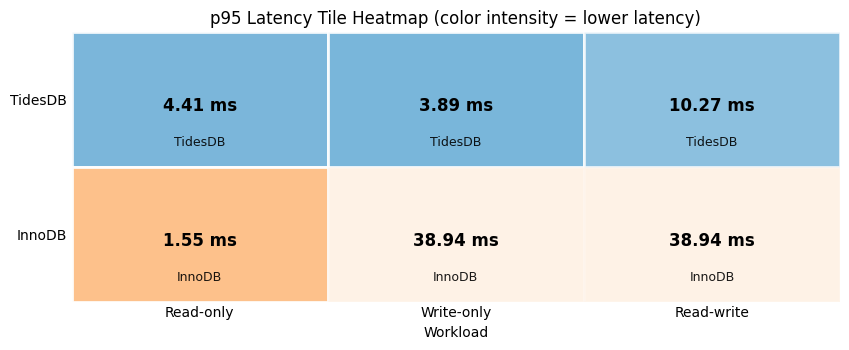
The p95 latency tiles are more important than TPS. InnoDB is excellent on read-only (1.55 ms p95), but its p95 jumps to ~38.94 ms under write-only and read-write. TidesDB stays in single-digit milliseconds for read-only and write-only (~4.4 ms and ~3.9 ms) and remains much lower for read-write (~10.27 ms).
Conclusion
InnoDB excels at read-heavy and read-only workloads. Those strengths are clearly reflected in the read-only benchmarks.
However, once writes are introduced, the performance profile changes materially. Under write-only and read-write workloads, conditions that more closely resemble real-world OLTP systems; TidesDB demonstrates both higher sustained throughput and more stable tail latency.
These results do not suggest a universal winner, but rather illustrate a trade-off. If maximum read-only throughput is the primary goal, InnoDB remains an excellent choice. If predictable latency and balanced performance under mixed workloads are more important, the data shows that TideSQL backed by TidesDB is well-aligned with those requirements. As modern applications increasingly value consistency over peak-case performance, this distinction becomes increasingly relevant.
That’s all for now folks!
Thanks for reading.
Sysbench results:
- InnoDB_oltp_read_only_batched_20260202_003220.txt
- InnoDB_oltp_read_write_batched_20260202_003220.txt
- InnoDB_oltp_write_only_batched_20260202_003220.txt
- TidesDB_oltp_read_only_batched_20260202_003220.txt
- TidesDB_oltp_read_write_batched_20260202_003220.txt
- TidesDB_oltp_write_only_batched_20260202_003220.txt
- summary_20260202_003220.csv