Benchmark Analysis on TidesDB v8.3.2 and RocksDB v10.10.1

published on February 12th, 2026
I’ve gotten a new machine to benchmark on and well with the latest optimization releases I thought I’d extend the benchtool runner tidesdb_rocksdb.sh go through 25 different benchmarks from synced to not synced, mid concurrency to high concurrency, different data sizes and more.
The suite spans 25K to 200M keys per test, three access patterns (sequential, random, zipfian), value sizes from 64B to 4KB, batch sizes from 1 to 10,000, concurrency from 1 to 16 threads, two cache tiers (64MB standard, 6GB large scale), and both async and fsync-enabled (durable) writes.
The environment used:
- AMD Ryzen Threadripper 2950X 32 cores
- 128GB DDR4
- Ubuntu 22.04 x86_64
- TidesDB v8.3.2
- RocksDB v10.10.1 (Pinned L0 index/filter blocks, HyperClock cache, block indexes)
- GCC (glibc)
- LZ4 Compression used for both engines
- XFS raw NVMe(SAMSUNG MZVLB512HAJQ-00000) w/discard, inode64, nodiratime, noatime, logbsize=256k, logbufs=8
Read more about benchmark environments here.
Speedup Summary
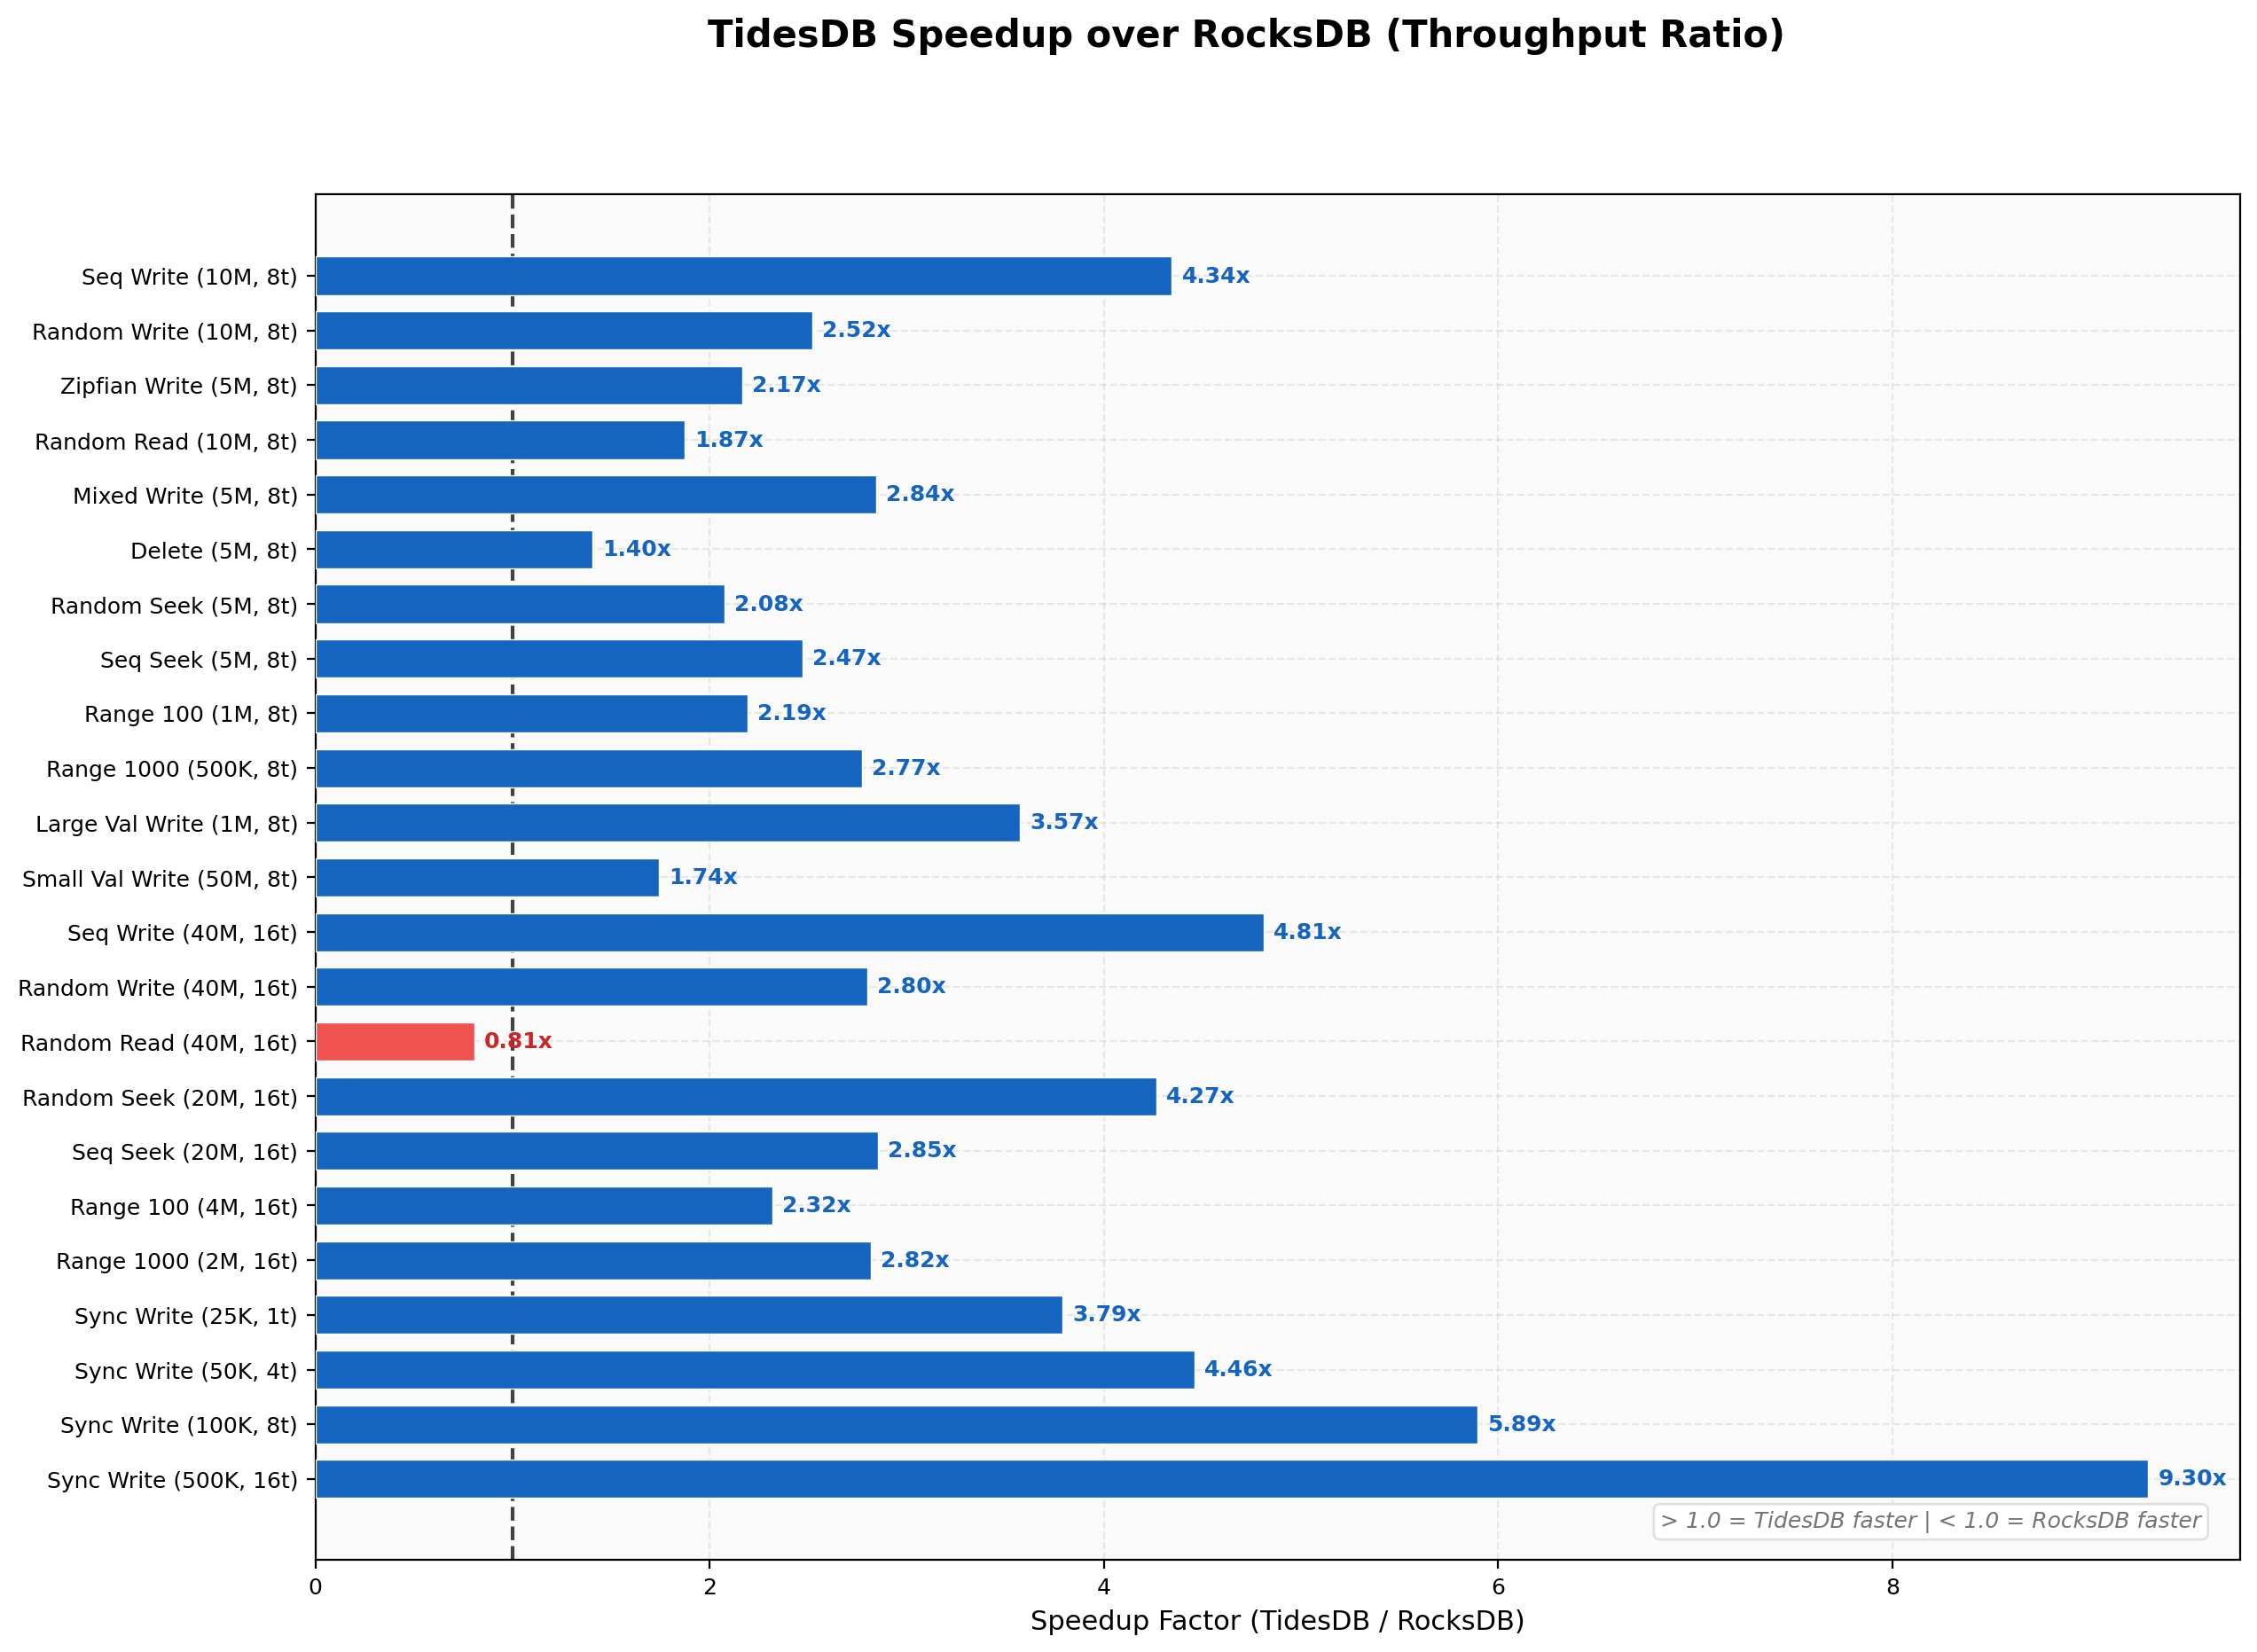
This chart shows the TidesDB-to-RocksDB throughput ratio across all 25 test categories. A value greater than 1.0x means TidesDB is faster. TidesDB leads in the majority of workloads, with the most pronounced advantages in sequential writes (4.3-4.8x), large-value writes (3.6-3.7x), seek operations (up to 4.3x at scale), and synced durable writes (up to 9.3x at 16 threads).
Write Throughput
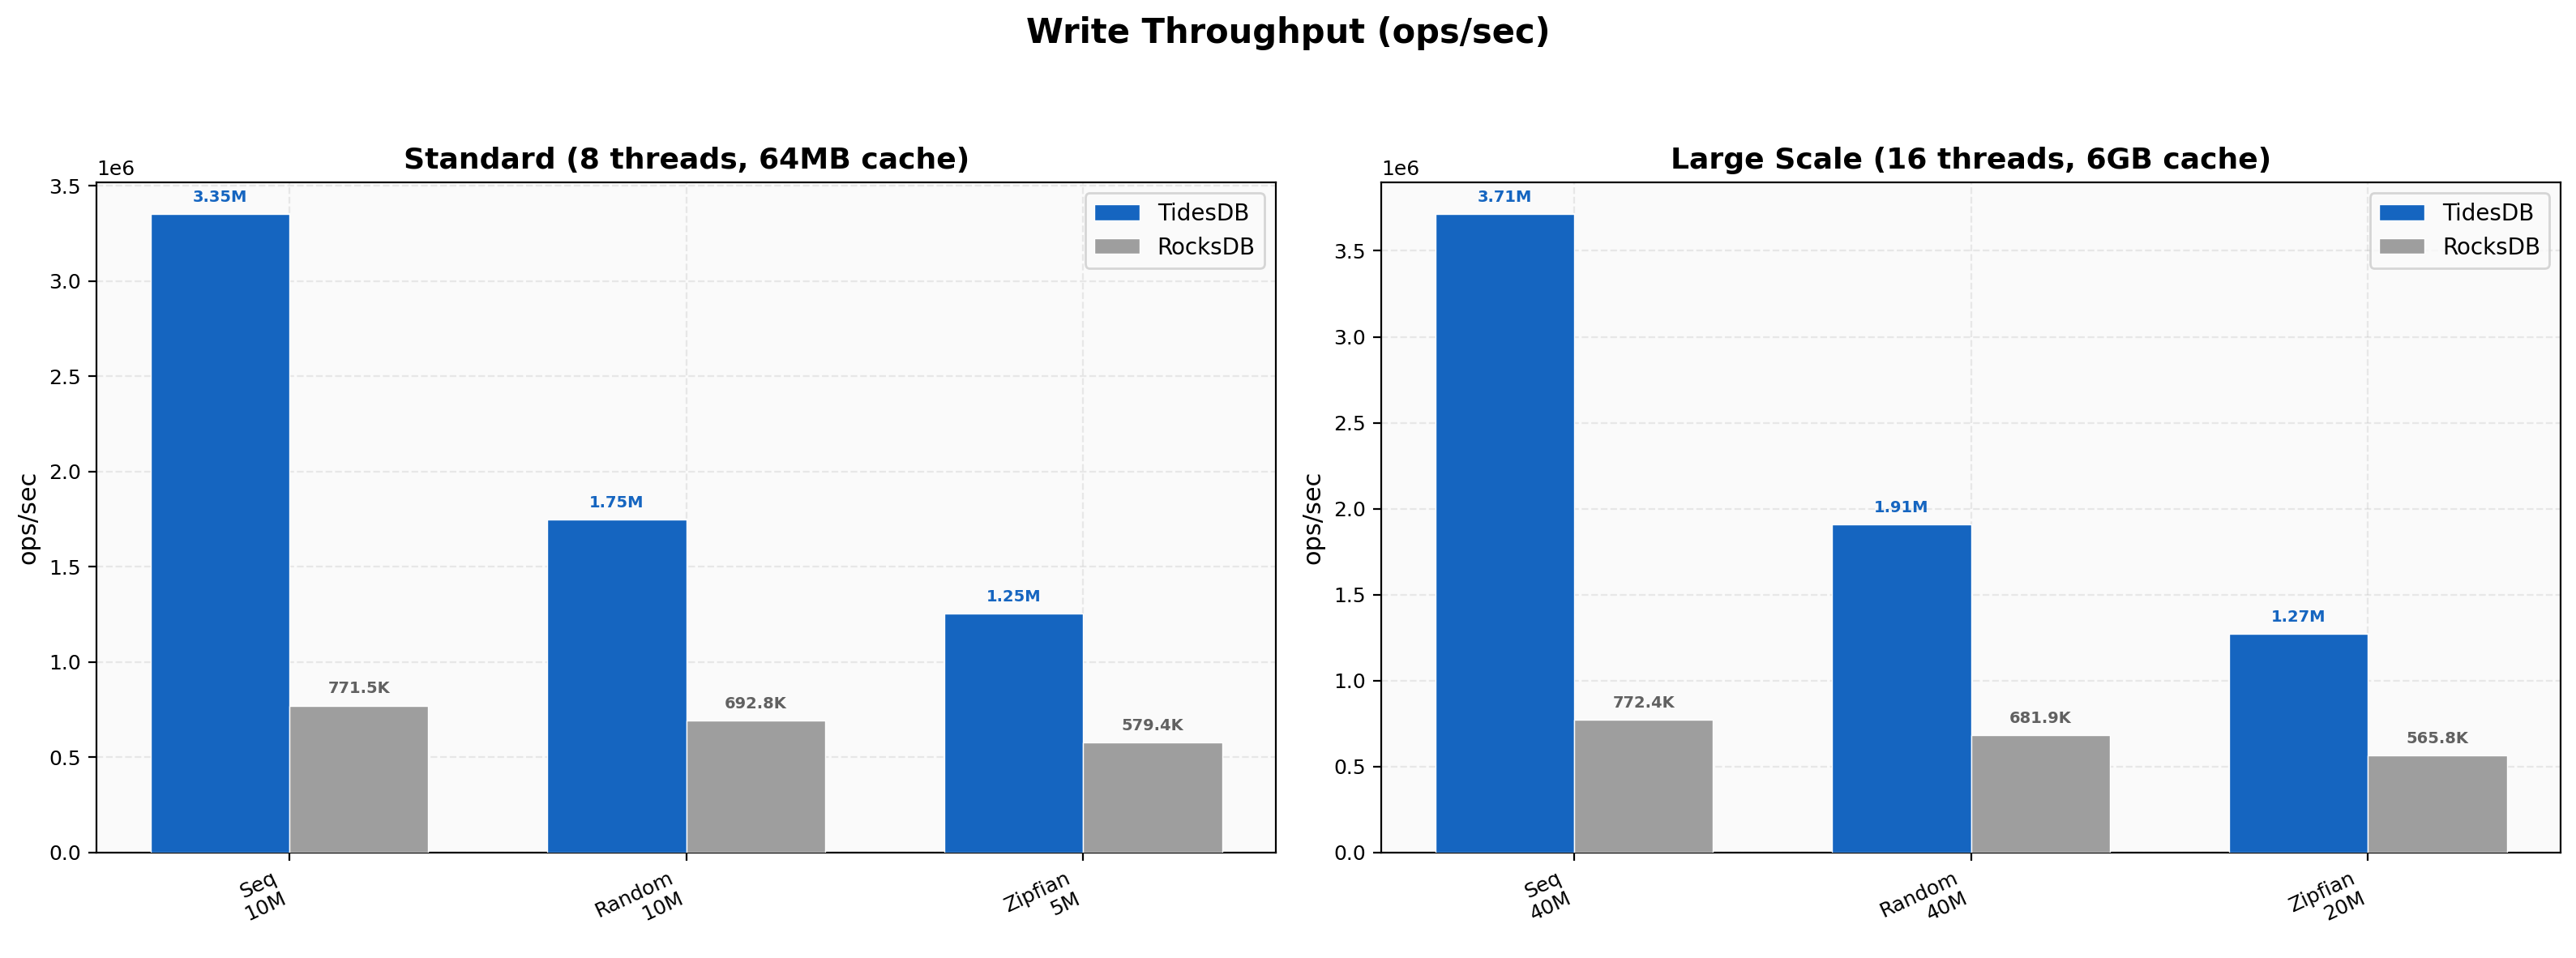
At standard scale (8 threads, 64MB cache), TidesDB delivers 3.35M ops/sec for sequential writes versus RocksDB’s 772K ops/sec.
Random writes show a 2.5x lead (1.75M vs 693K ops/sec) and zipfian writes a 2.2x lead (1.25M vs 579K ops/sec).
Scaling to 16 threads with a 6GB cache widens the gap further - sequential writes reach 3.71M vs 772K (4.8x), random writes hit 1.91M vs 682K (2.8x), and zipfian writes reach 1.27M vs 566K (2.3x). TidesDB’s write path scales efficiently with added concurrency while RocksDB’s throughput remains relatively flat.
Read Mixed Throughput
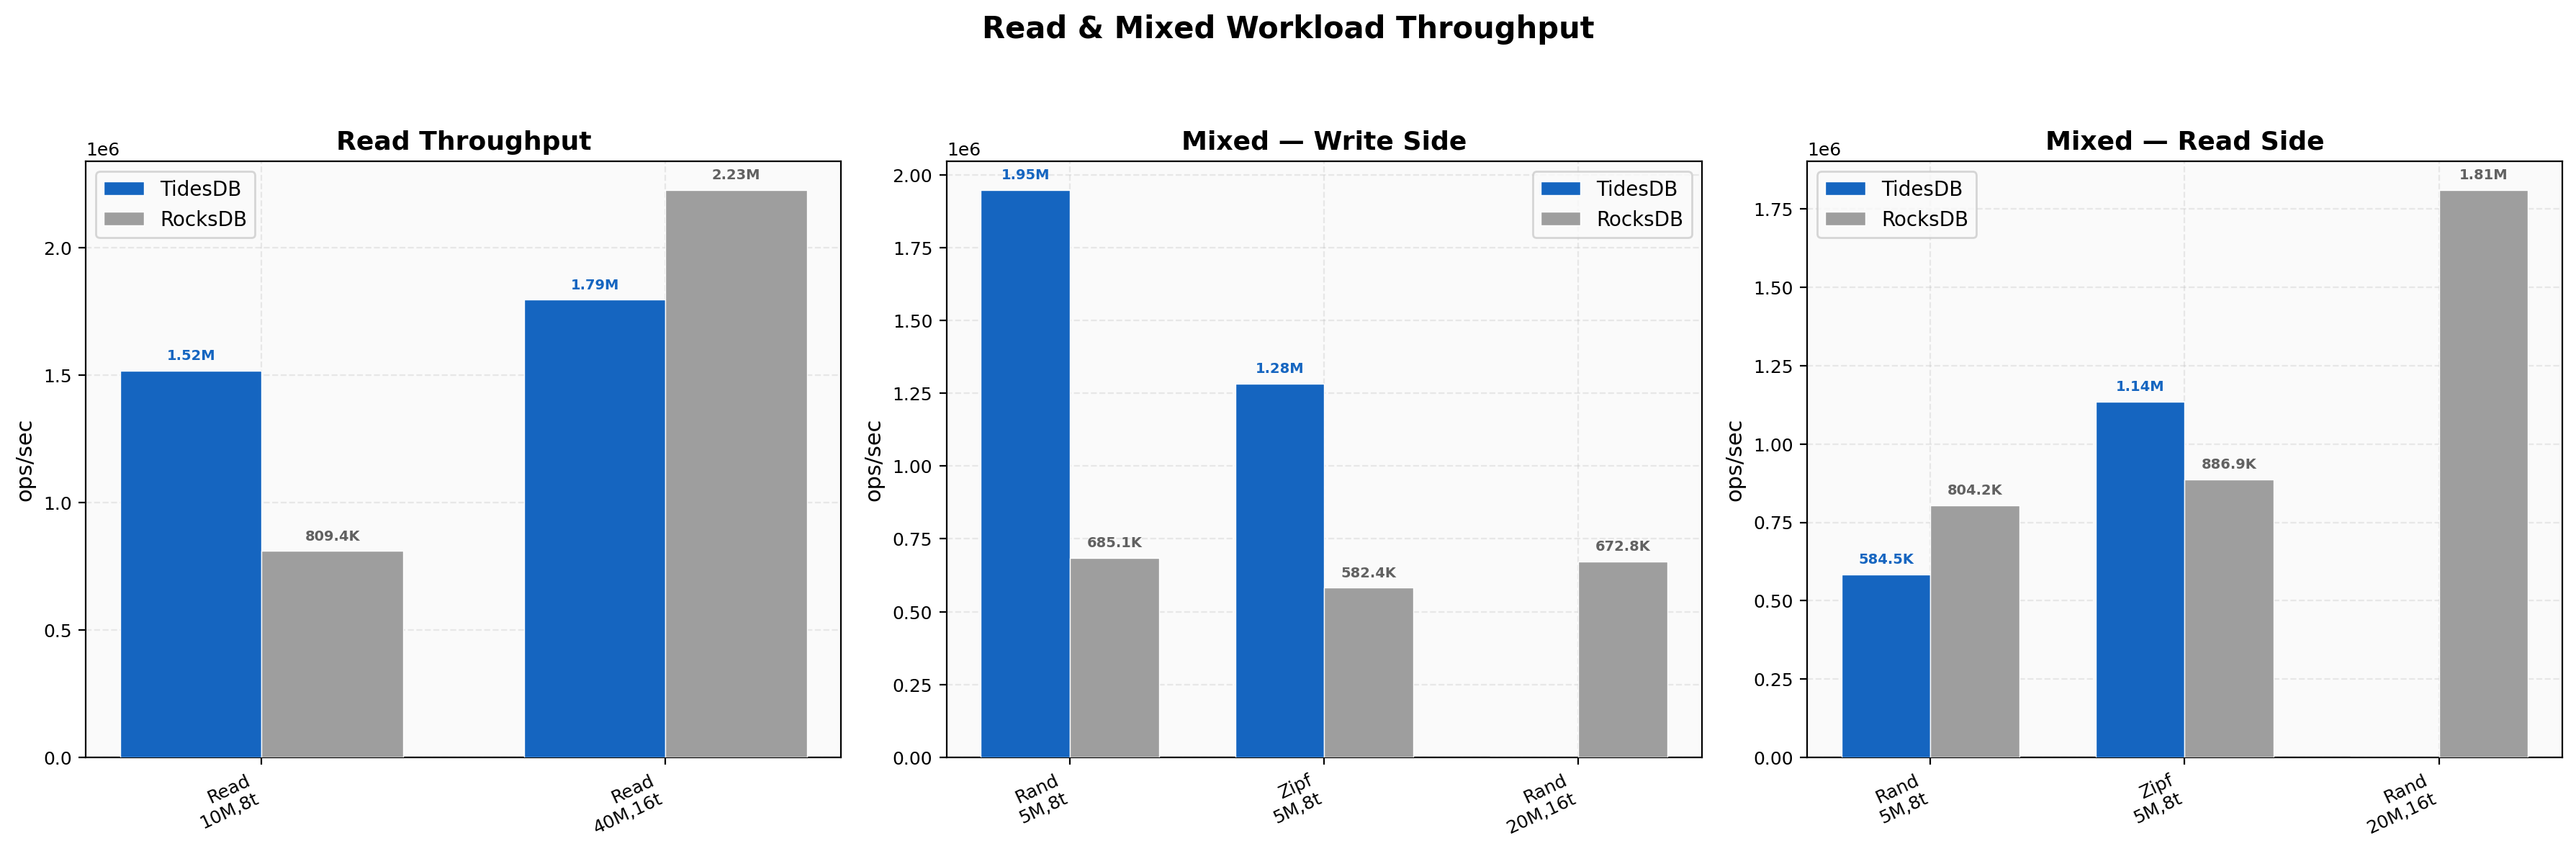
For standard-scale random reads (10M ops, 8 threads), TidesDB achieves 1.52M ops/sec versus RocksDB’s 809K ops/sec (1.87x). In mixed workloads, TidesDB’s write side dominates at 1.95M vs 685K ops/sec (2.84x), while RocksDB’s read side is competitive at 804K vs TidesDB’s 585K ops/sec. At large scale (40M ops, 16 threads, 6GB cache), RocksDB’s read performance benefits significantly from the larger cache, reaching 2.23M ops/sec compared to TidesDB’s 1.79M ops/sec.
Delete Throughput
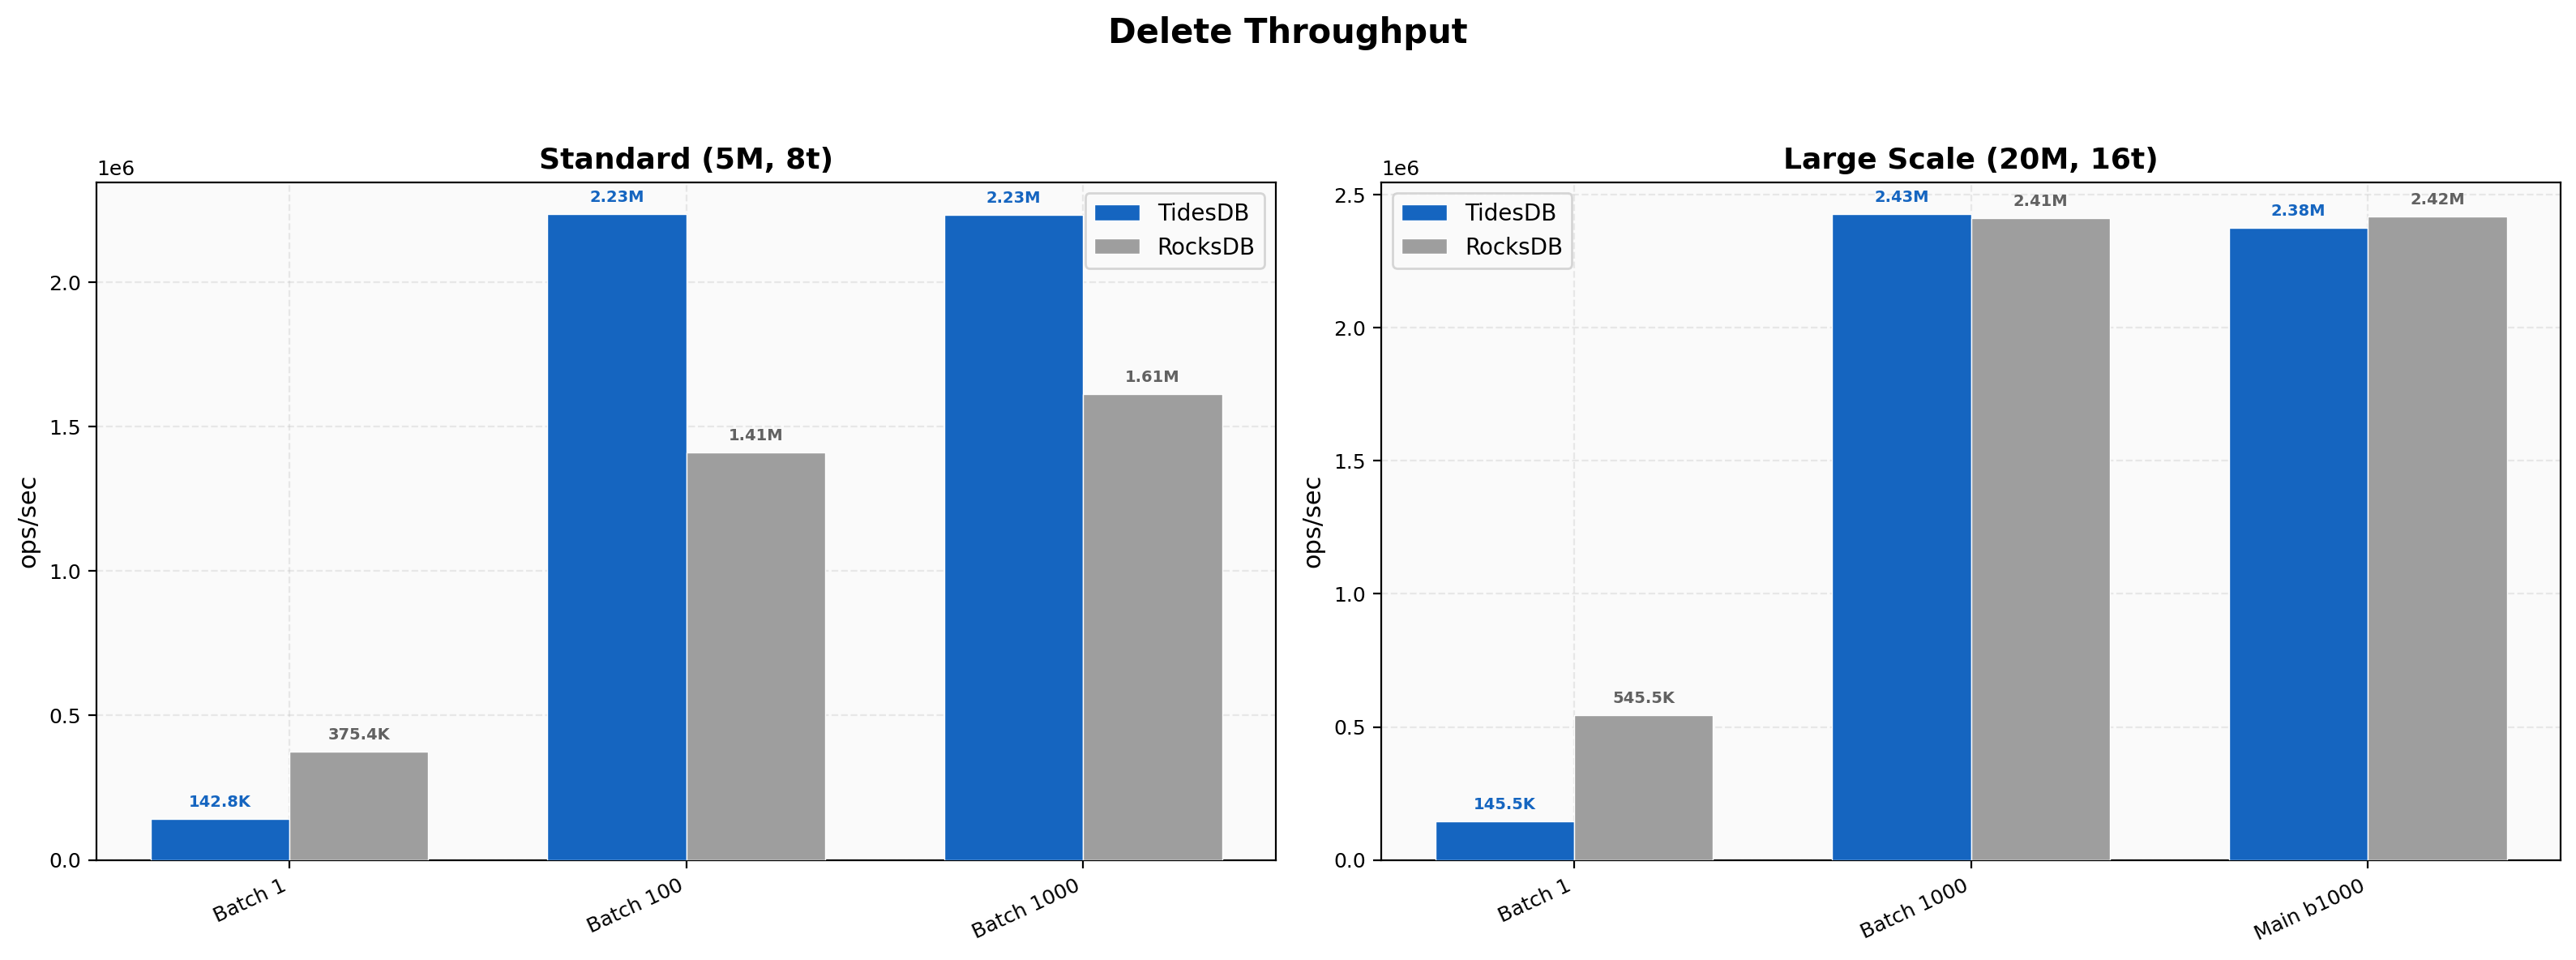
With batched deletes (batch=1000), TidesDB leads at standard scale at 2.28M vs 1.62M ops/sec (1.40x). At batch=100, TidesDB reaches 2.23M vs 1.41M (1.58x). However, for single-operation deletes (batch=1), RocksDB is significantly faster at 375K vs 143K ops/sec (2.63x), reflecting the overhead of TidesDB’s transactional commit path on individual operations. At large scale (20M ops, 16 threads), the two engines converge rather, batch=1000 deletes are nearly tied at ~2.4M ops/sec for both. Single-op deletes again favor RocksDB at 545K vs 146K ops/sec (3.75x).
Seek Throughput
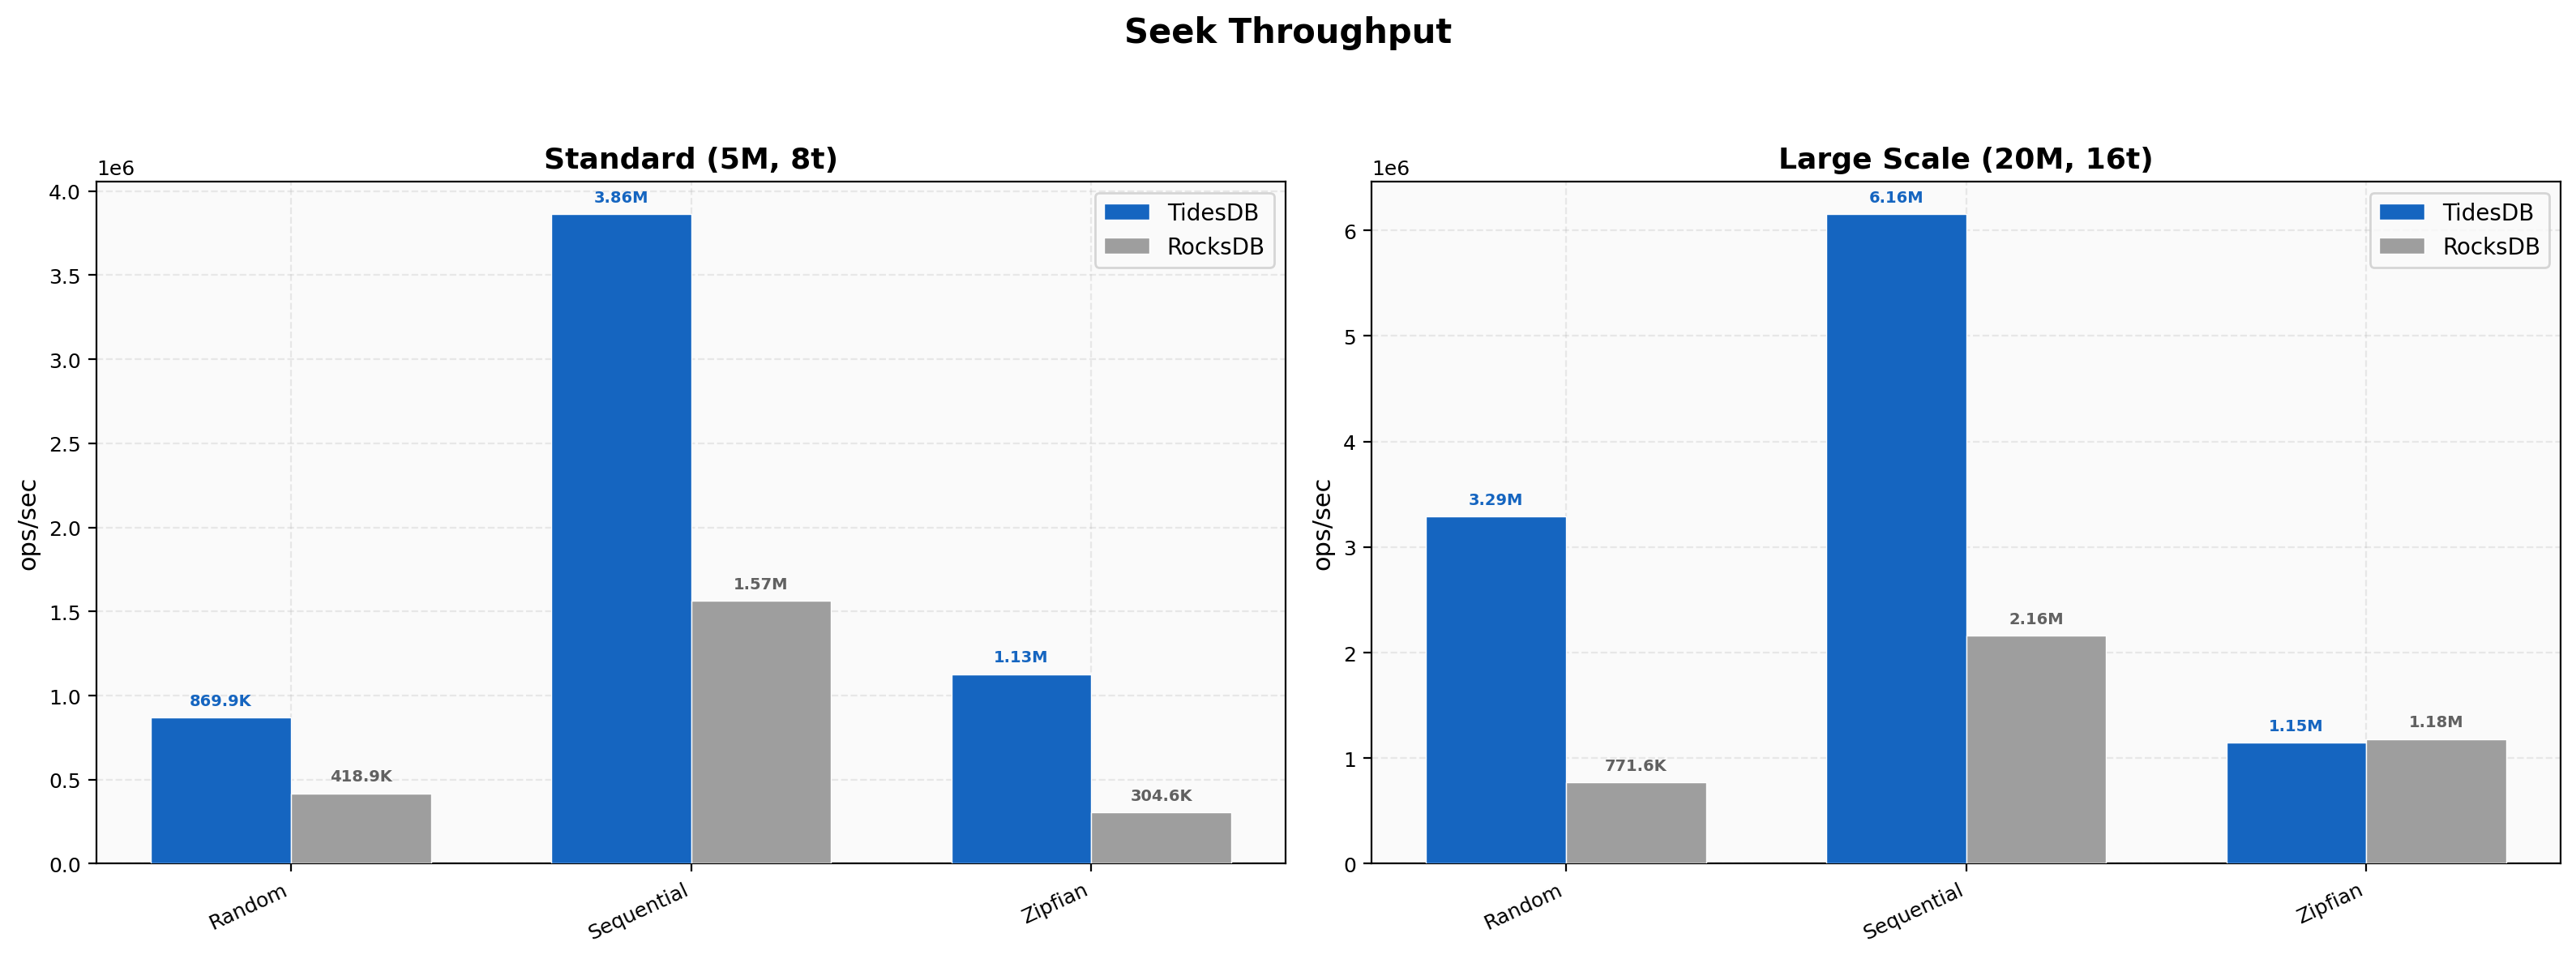
TidesDB dominates seek performance across all patterns at standard scale. Random seeks reach 870K vs 419K ops/sec (2.08x), sequential seeks hit 3.86M vs 1.57M (2.47x), and zipfian seeks show the largest gap at 1.13M vs 305K (3.70x). At large scale (20M ops, 16 threads), TidesDB’s random seek advantage grows to 4.27x (3.29M vs 772K ops/sec) and sequential seeks reach 6.16M vs 2.16M (2.85x). Zipfian seeks at scale are essentially tied (1.15M vs 1.18M), likely because the hot-key distribution allows RocksDB’s 6GB cache to absorb most lookups.
Range Scan Throughput
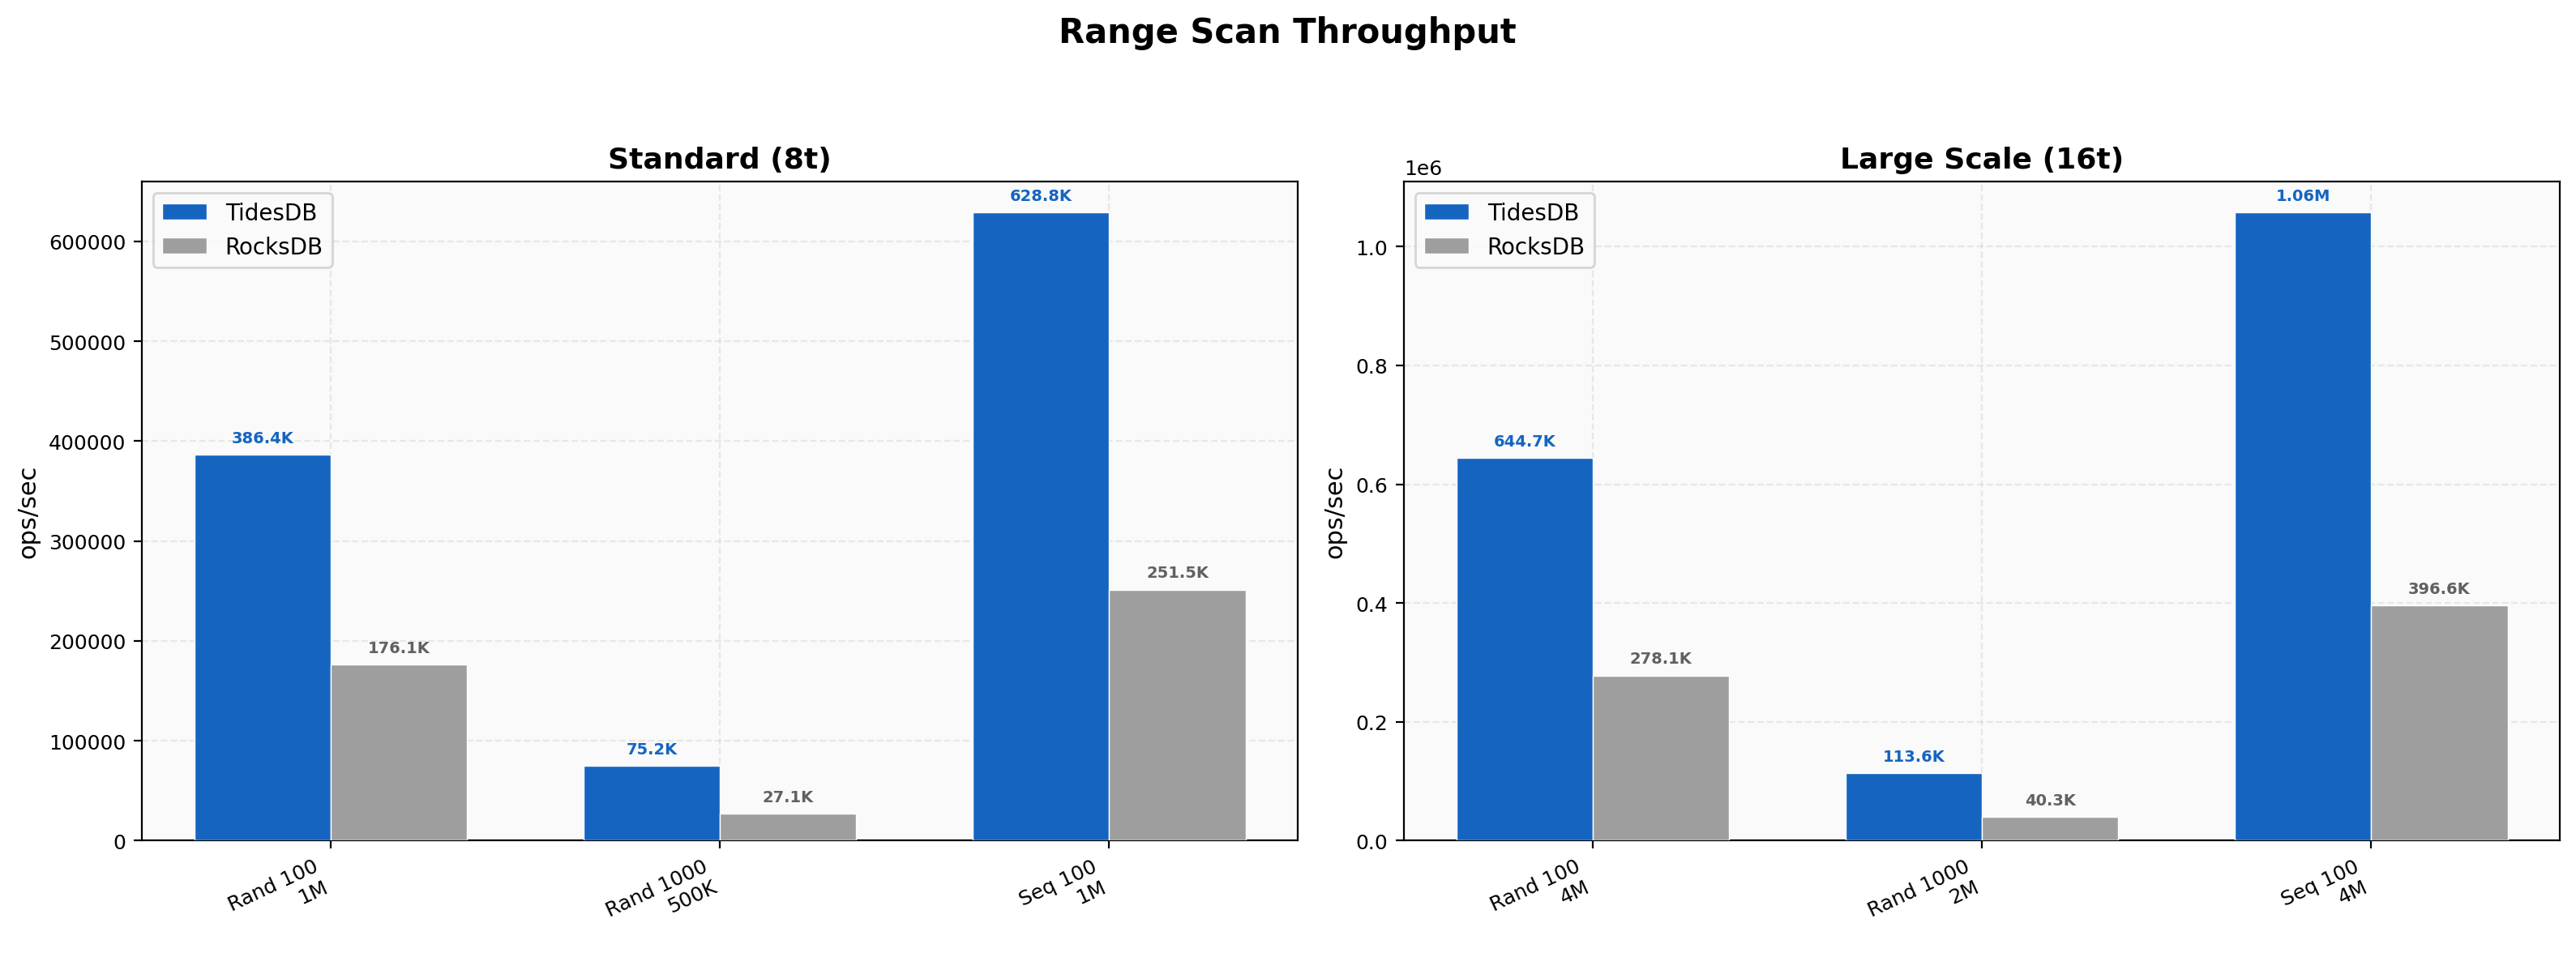
TidesDB rather consistently outperforms RocksDB in range scans. At standard scale, random 100-key scans achieve 386K vs 176K ops/sec (2.19x), 1000-key scans show 75K vs 27K (2.77x), and sequential 100-key scans reach 629K vs 251K (2.50x).
Scaling to 16 threads amplifies the advantage - random 100-key scans hit 645K vs 278K (2.32x), 1000-key scans reach 114K vs 40K (2.82x), and sequential scans achieve 1.06M vs 397K (2.67x). TidesDB’s iterator implementation scales well with both concurrency and scan length.
Batch Size Scaling
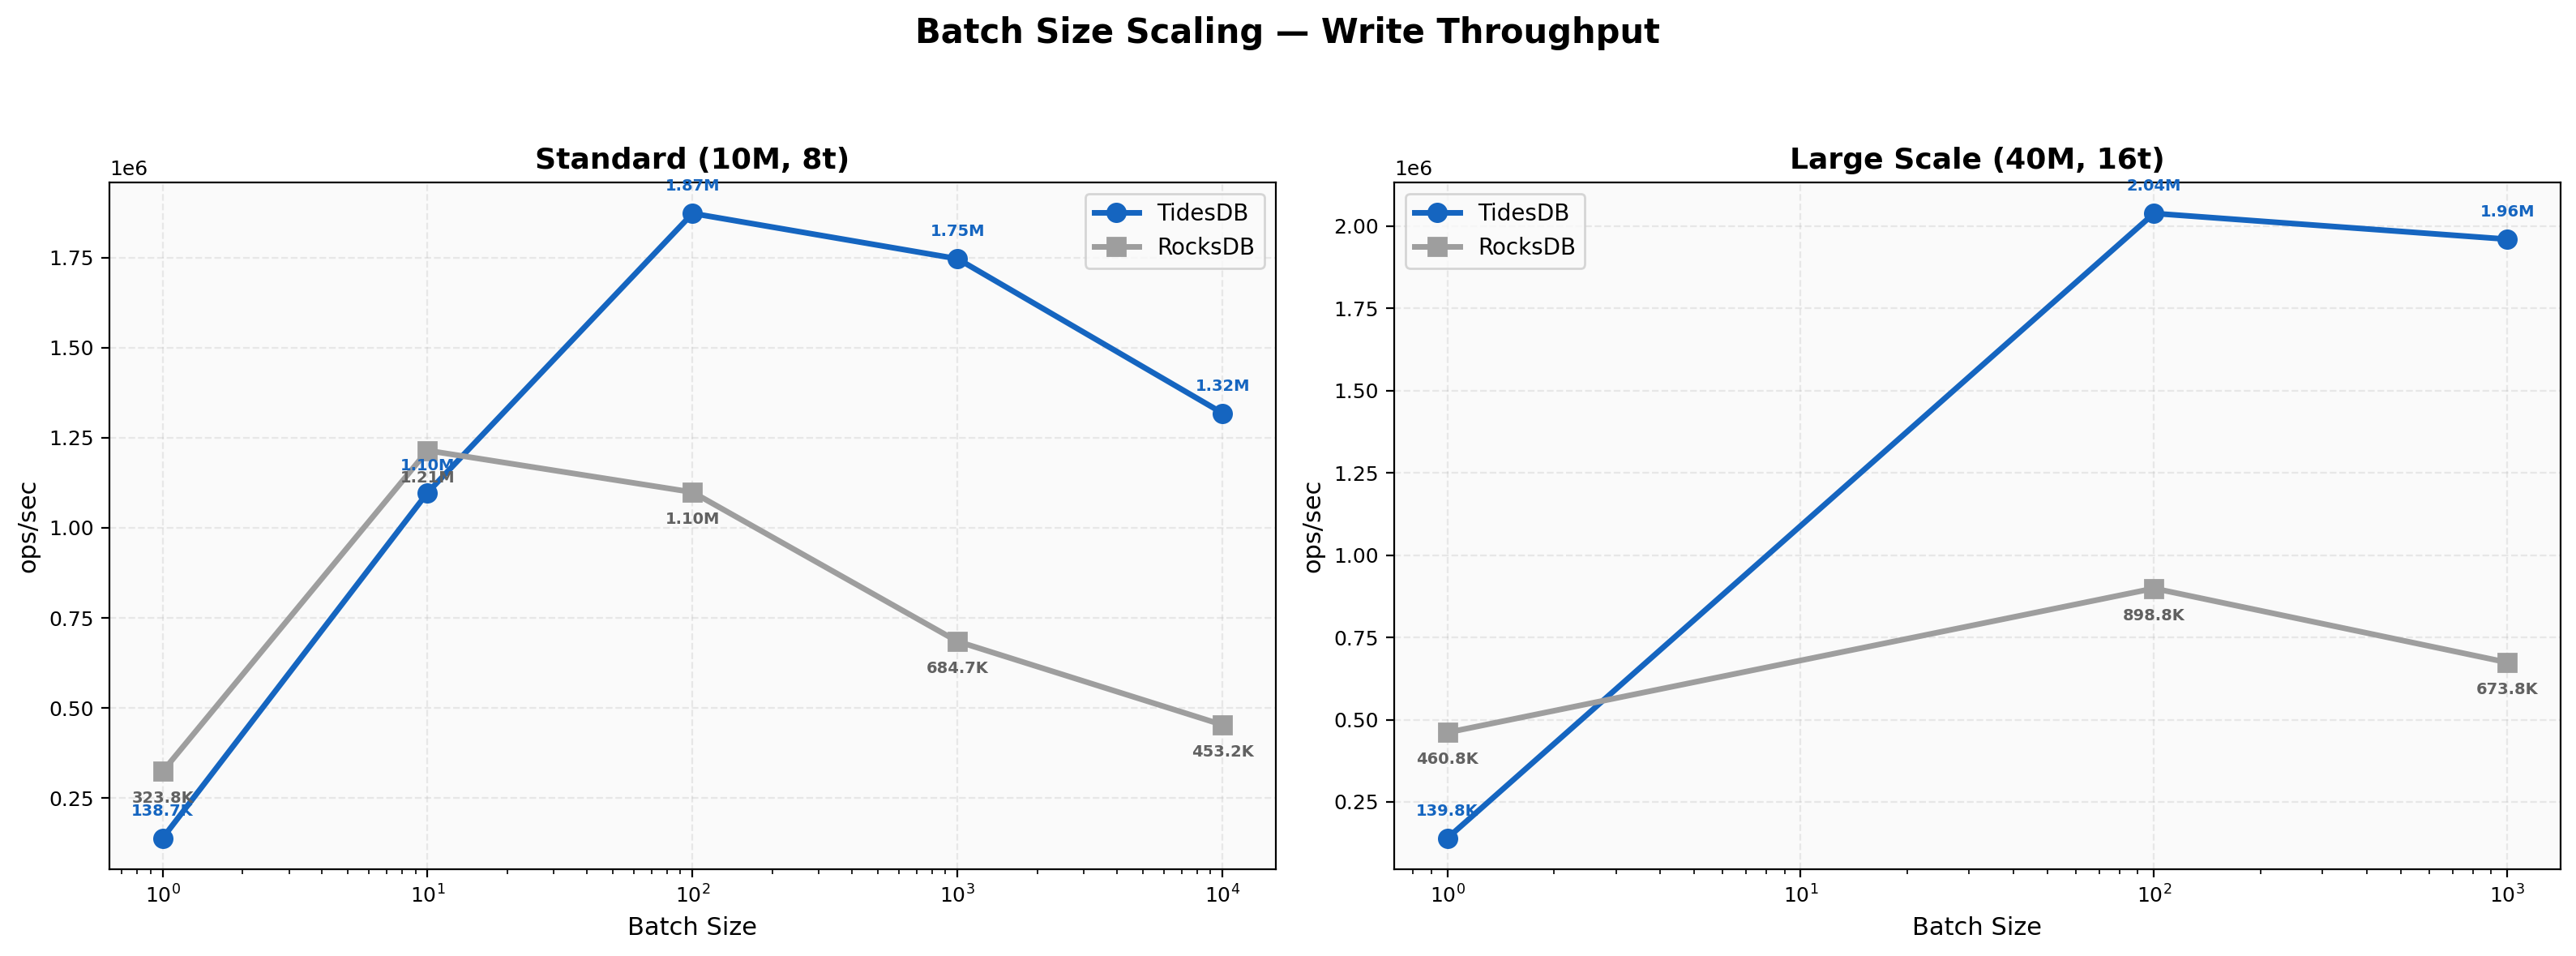
This chart reveals how throughput changes with batch size (1 to 10,000). At batch=1, RocksDB leads (324K vs 139K ops/sec) due to lower per-operation overhead. However, TidesDB overtakes RocksDB at batch=100 (1.87M vs 1.10M) and maintains its lead through batch=1000 (1.75M vs 685K, 2.55x) and batch=10000 (1.32M vs 453K, 2.91x). TidesDB peaks around batch=100 then gradually declines, while RocksDB degrades more steeply at larger batch sizes. At large scale (16 threads), the same crossover pattern holds - RocksDB leads at batch=1 (461K vs 140K) but TidesDB dominates at batch=100 (2.04M vs 899K, 2.27x) and batch=1000 (1.96M vs 674K, 2.91x).
Value Size Impact
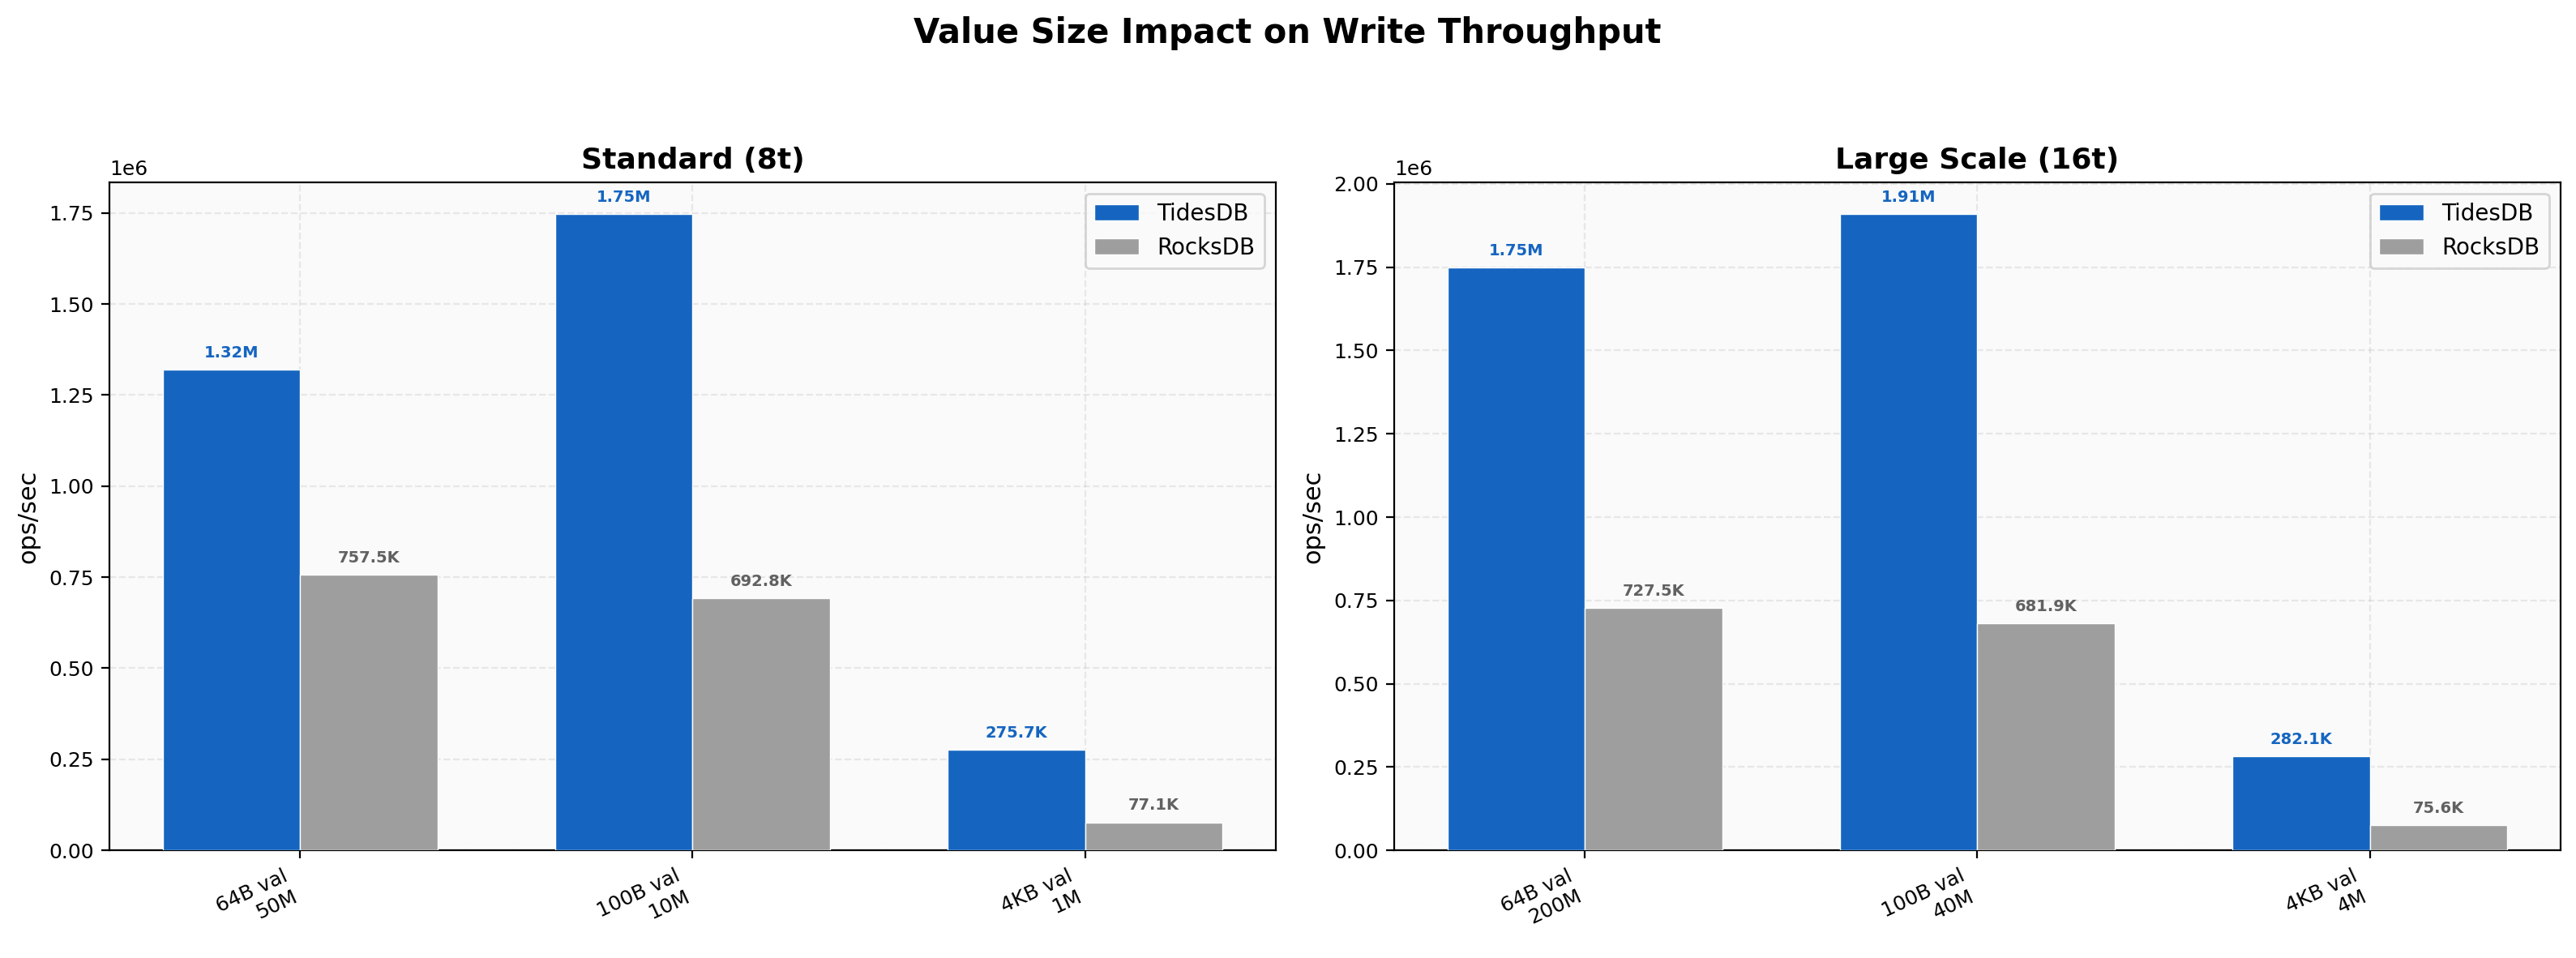
TidesDB seems to outperform RocksDB across all value sizes.
With small 64-byte values (50M ops), TidesDB achieves 1.32M vs 757K ops/sec (1.74x). Default 100-byte values show 1.75M vs 693K (2.52x).
The most interesting and rather striking gap appears with large 4KB values (1M ops) where TidesDB reaches 276K vs 77K ops/sec (3.57x).
At large scale (16 threads), the pattern intensifies - 4KB values show TidesDB at 282K vs 76K (3.73x). The large-value advantage suggests TidesDB handles write amplification more efficiently when values are large, as confirmed by the write amplification metrics (1.05x vs 1.30x for 4KB values).
Latency Overview
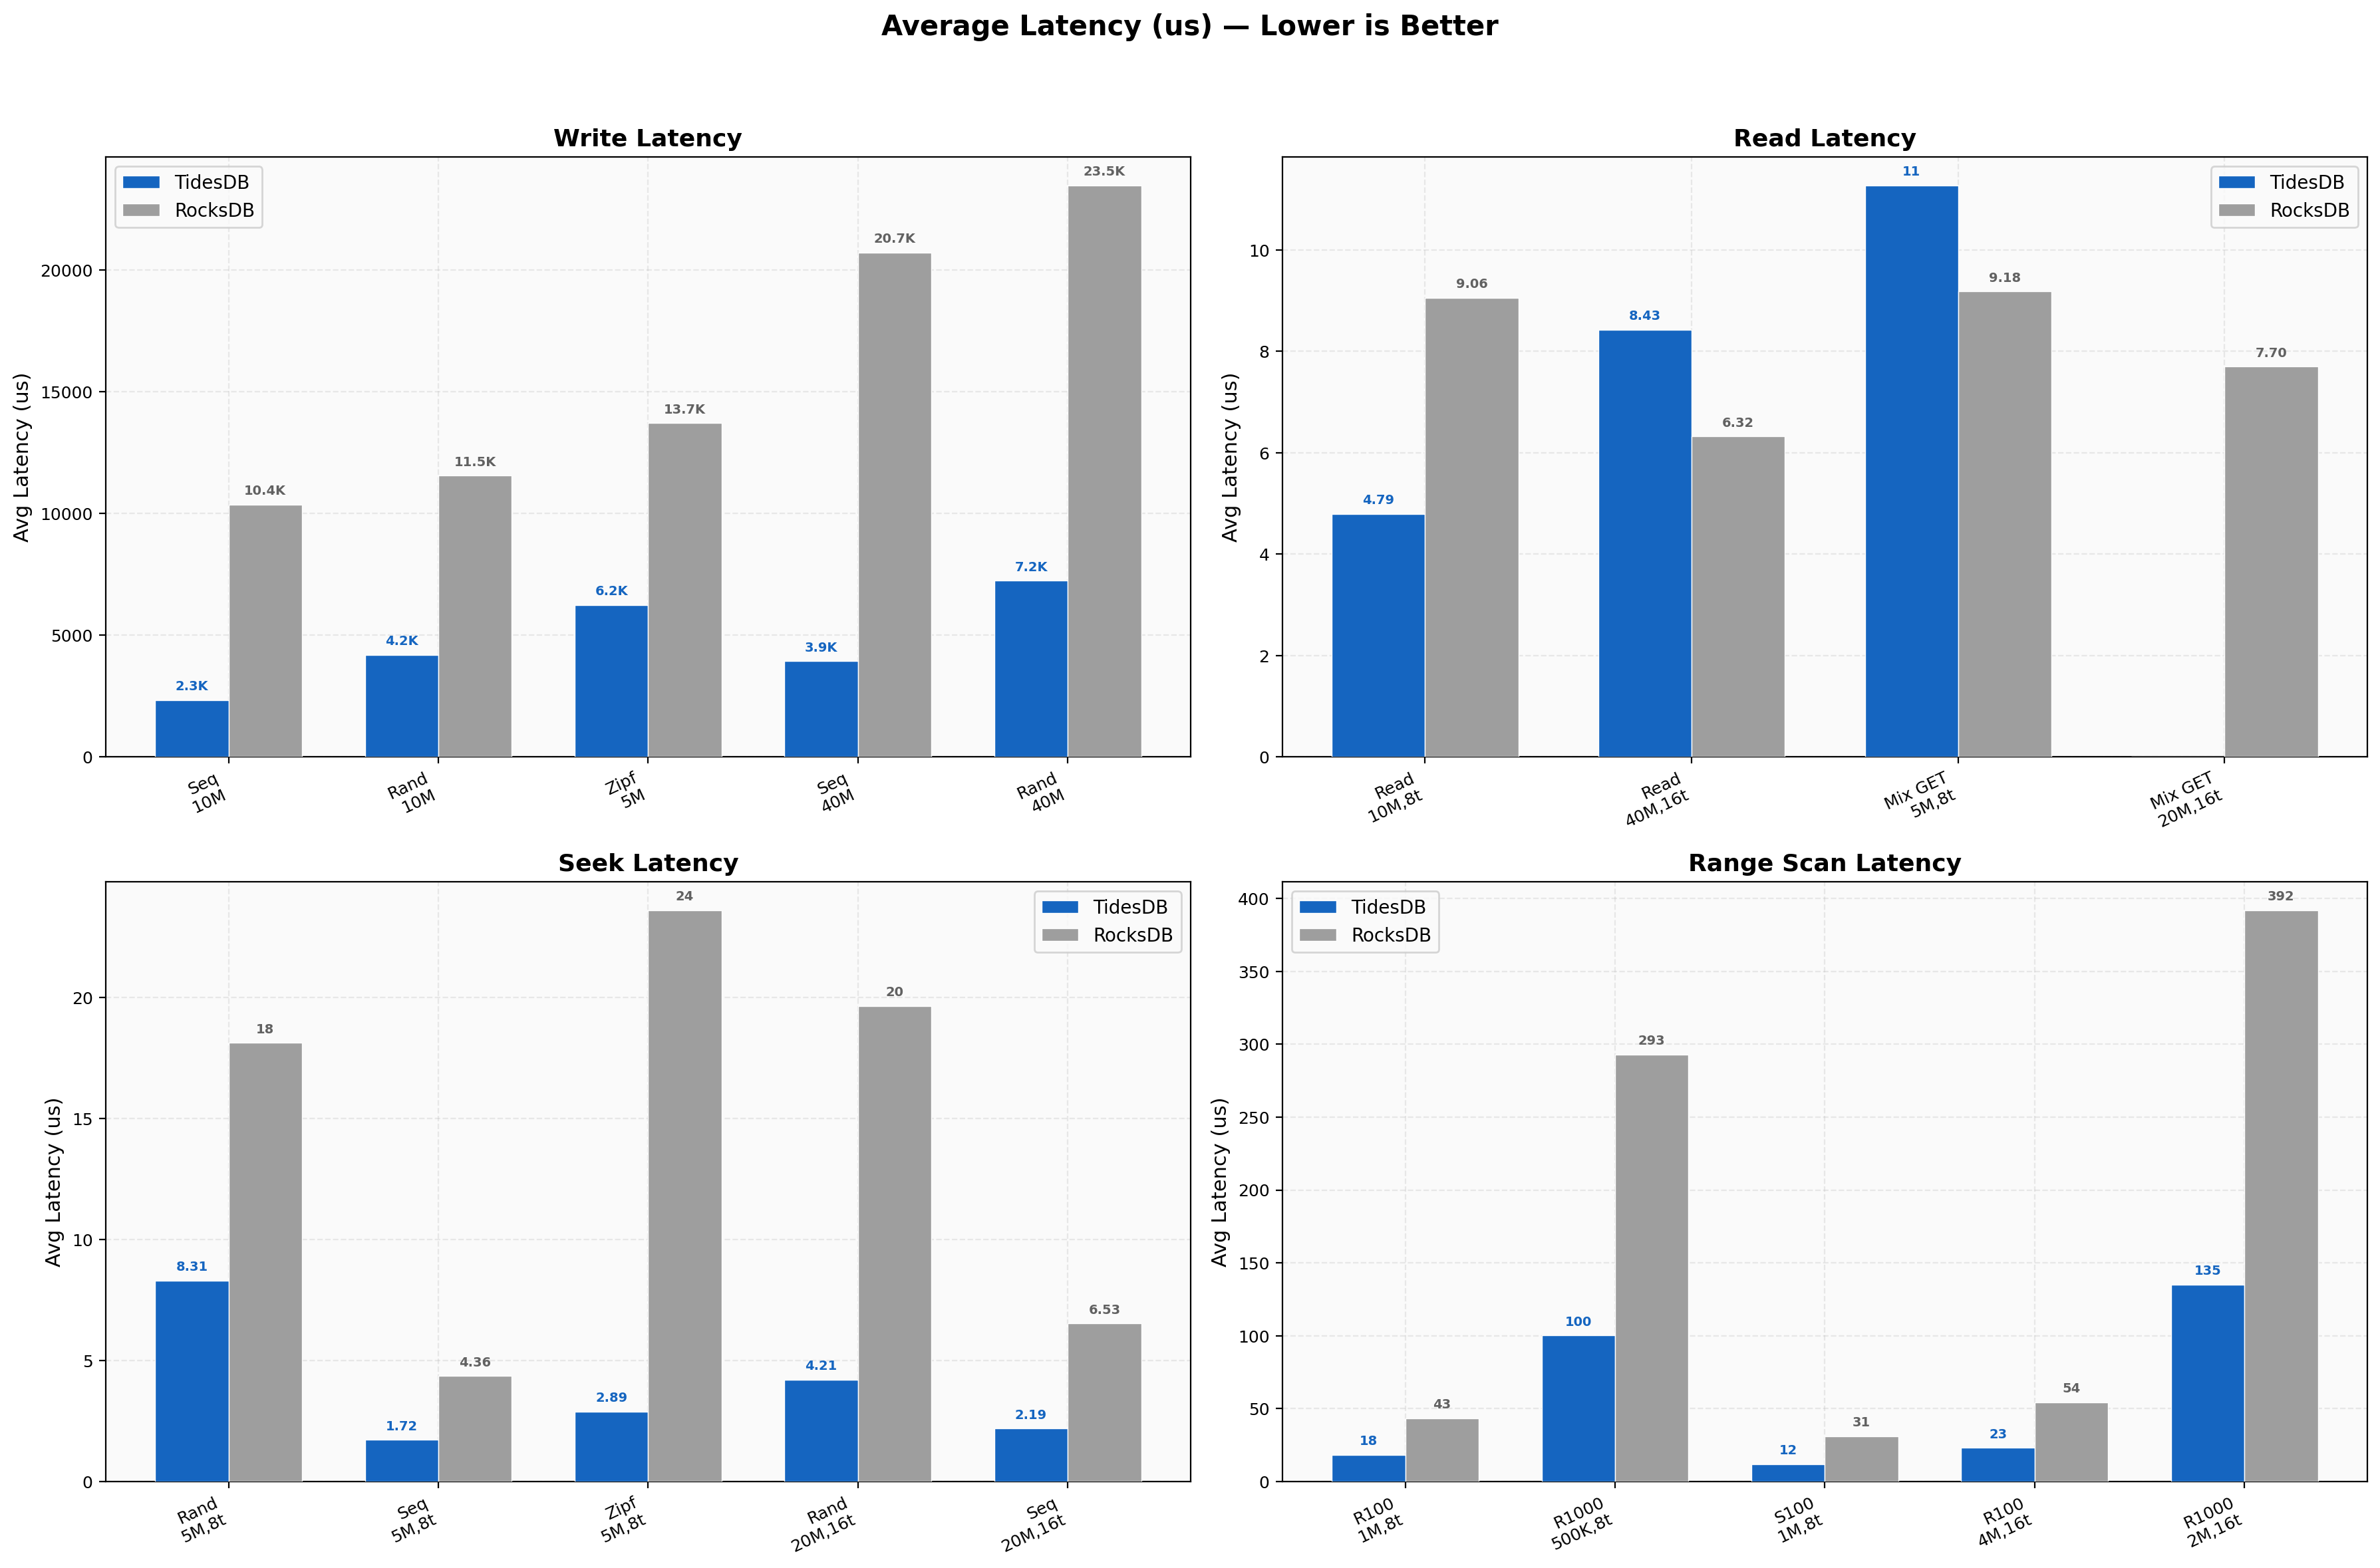
Average write latency at standard scale shows TidesDB at 2,330 us (sequential) and 4,189 us (random) per batch versus RocksDB’s 10,365 us and 11,542 us respectively, roughly 2.5x-4.4x lower. For reads, TidesDB averages 4.79 us per GET versus RocksDB’s 9.06 us (1.89x lower).
Seek latency shows TidesDB at 8.31 us (random) and 1.72 us (sequential) versus RocksDB’s 18.13 us and 4.36 us. Range query latency follows the same pattern with TidesDB at 18.38 us per 100-key scan versus RocksDB’s 43.45 us. TidesDB delivers consistently lower average latencies across all operation types.
Latency Percentiles
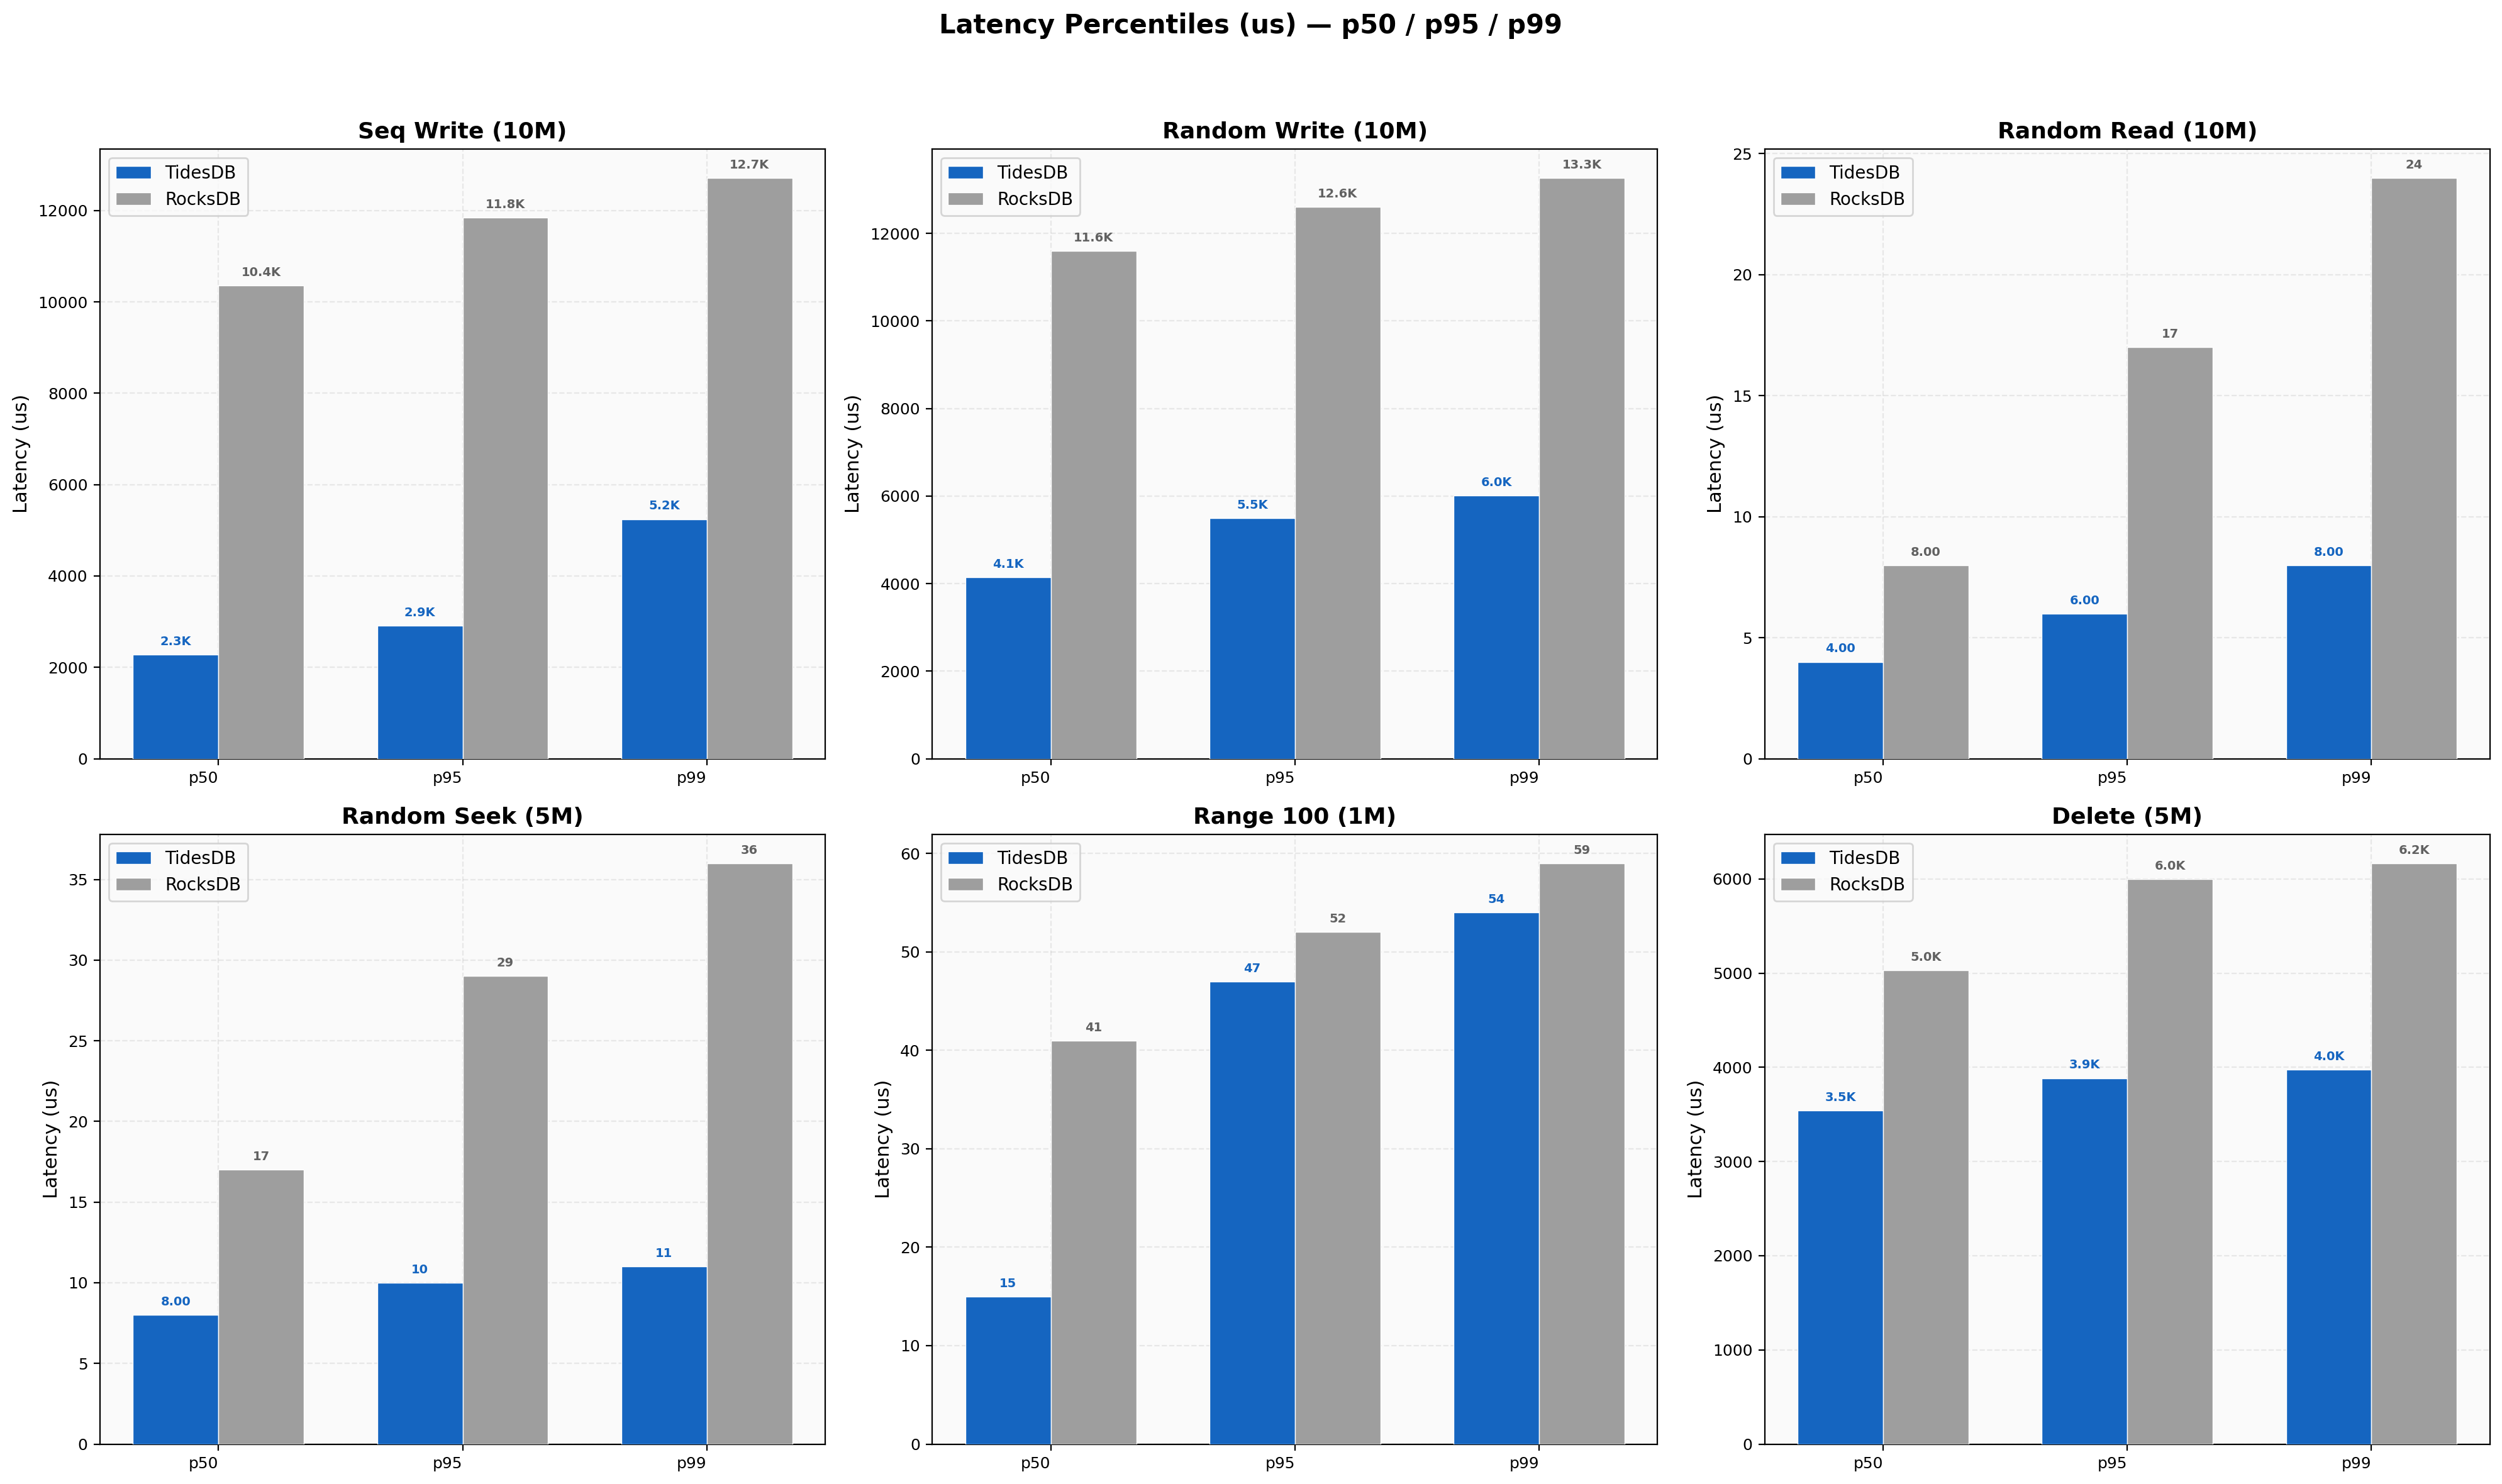
Looking at tail latencies, TidesDB’s p99 for sequential writes is 5,245 us versus RocksDB’s 12,715 us. For random writes, TidesDB p99 is 6,007 us versus RocksDB’s 13,266 us.
Random read p99 latencies are 8 us (TidesDB) versus 24 us (RocksDB). Random seek p99 is 11 us (TidesDB) versus 36 us (RocksDB).
TidesDB maintains tighter latency distributions overall, though its coefficient of variation (CV%) tends to be higher in write workloads (19-25% vs 7-9%), indicating more variability relative to its lower mean. RocksDB’s write latencies are more consistent but clustered around a much higher baseline it seems.
Write Amplification
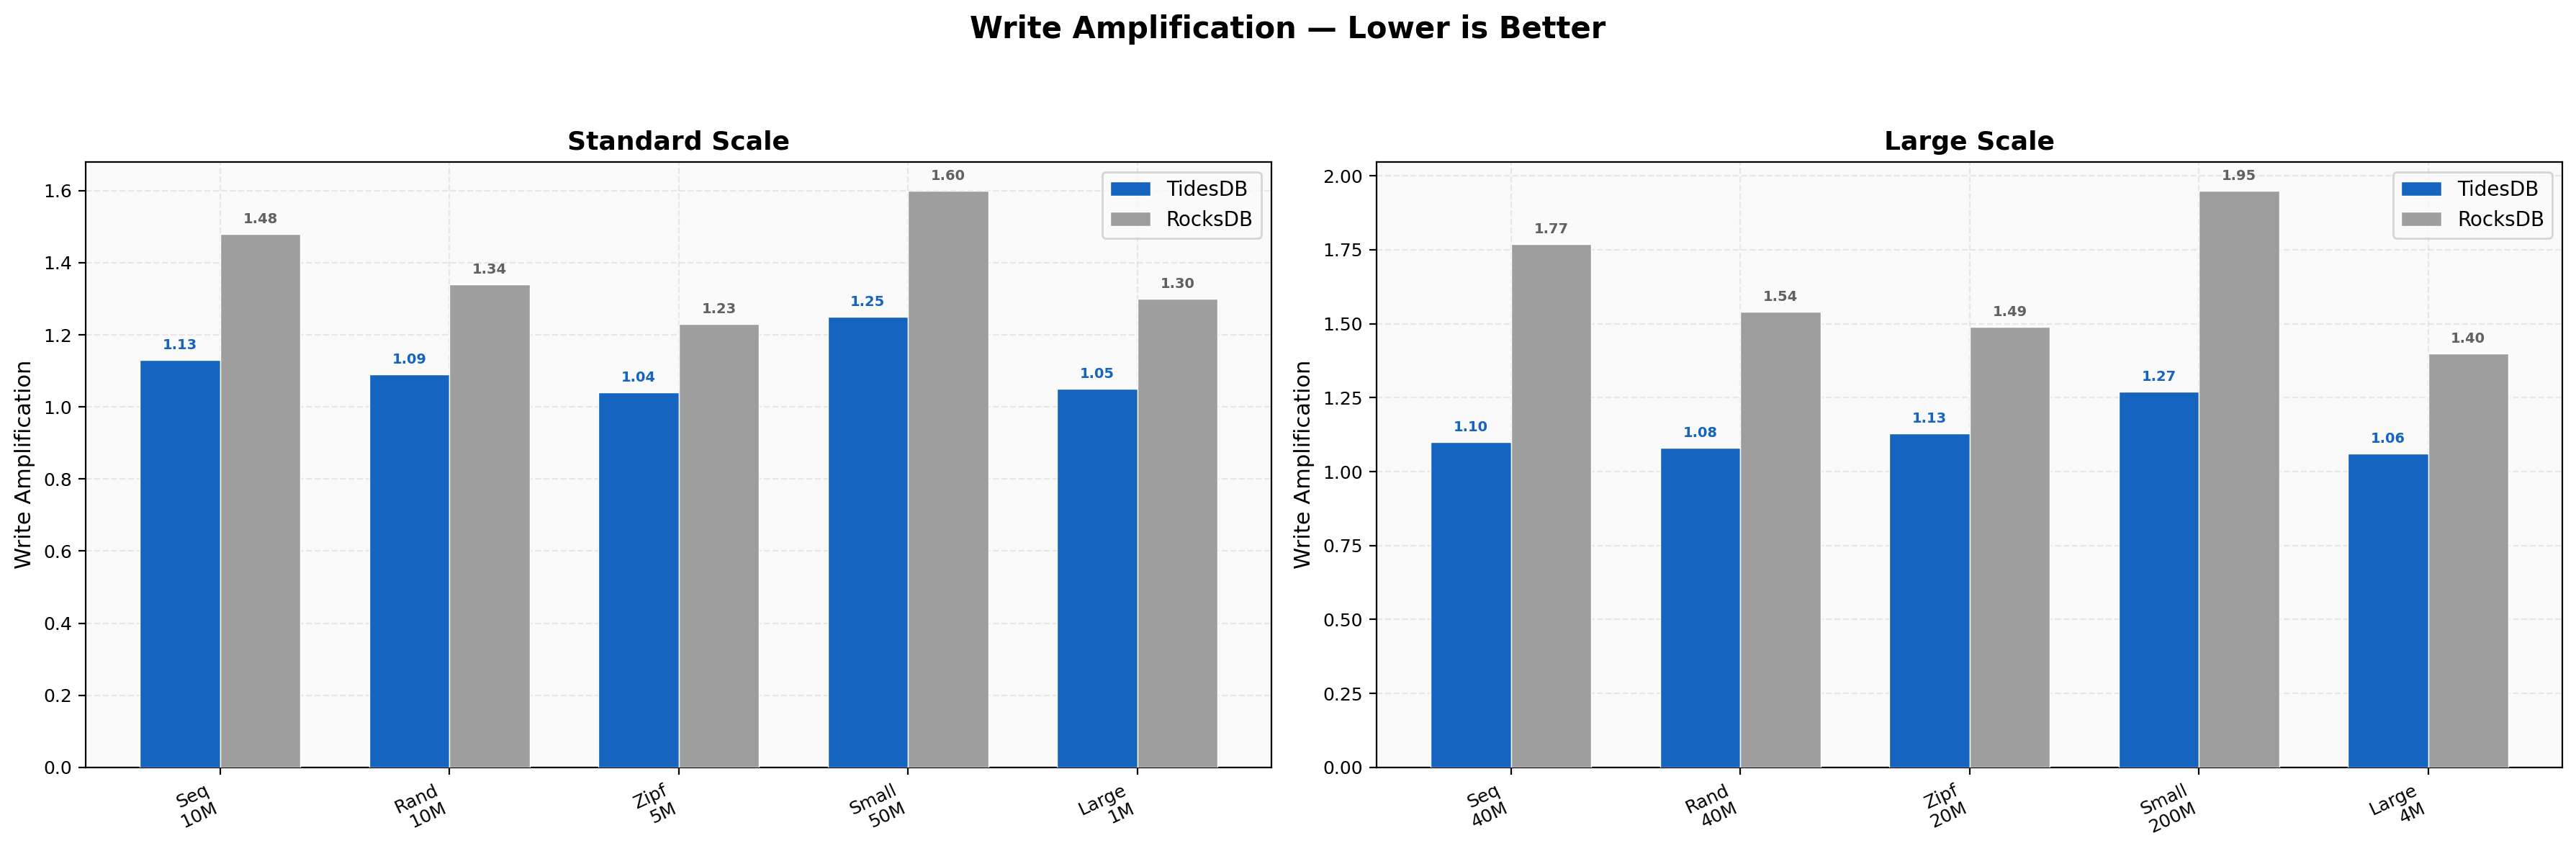
Write amplification measures bytes written to disk divided by logical data written - lower is better for SSD longevity. TidesDB achieves near-ideal amplification, 1.13x for sequential writes, 1.09x for random, and 1.04x for zipfian at standard scale.
RocksDB shows higher amplification at 1.48x, 1.34x, and 1.23x respectively. At large scale, the gap widens - sequential writes show 1.10x (TidesDB) vs 1.77x (RocksDB), and small-value writes show 1.27x vs 1.95x.
This means RocksDB writes nearly twice as much data to disk as TidesDB for the same logical workload, which directly impacts SSD wear and write throughput.
Space Efficiency
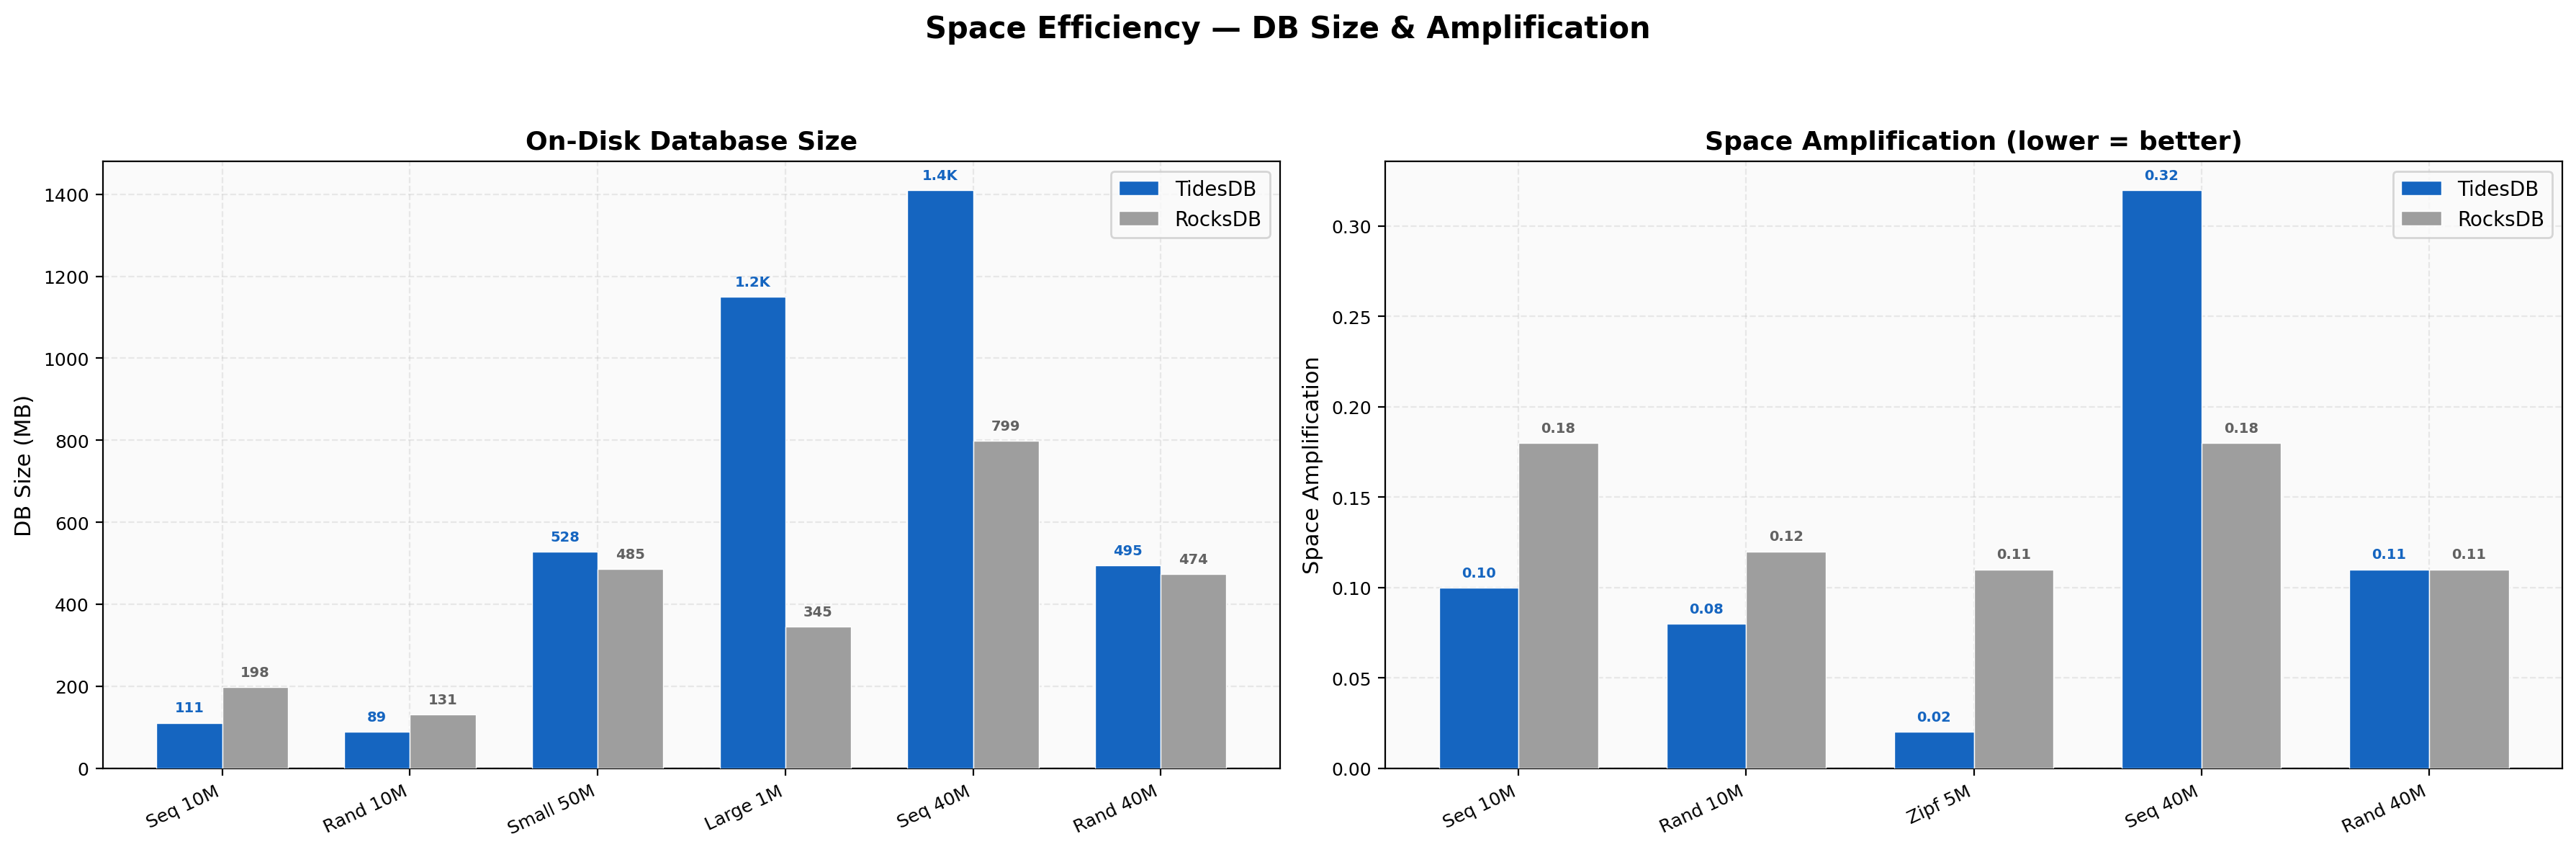
On-disk database sizes reveal different storage strategies. At standard scale, TidesDB uses less space for most workloads, for example 110.57 MB vs 197.83 MB for sequential writes (10M ops), and 89.12 MB vs 130.69 MB for random writes.
Space amplification ratios are low for both engines across all tests, with TidesDB ranging from 0.02x to 0.32x and RocksDB from 0.05x to 0.23x.
Resource Usage
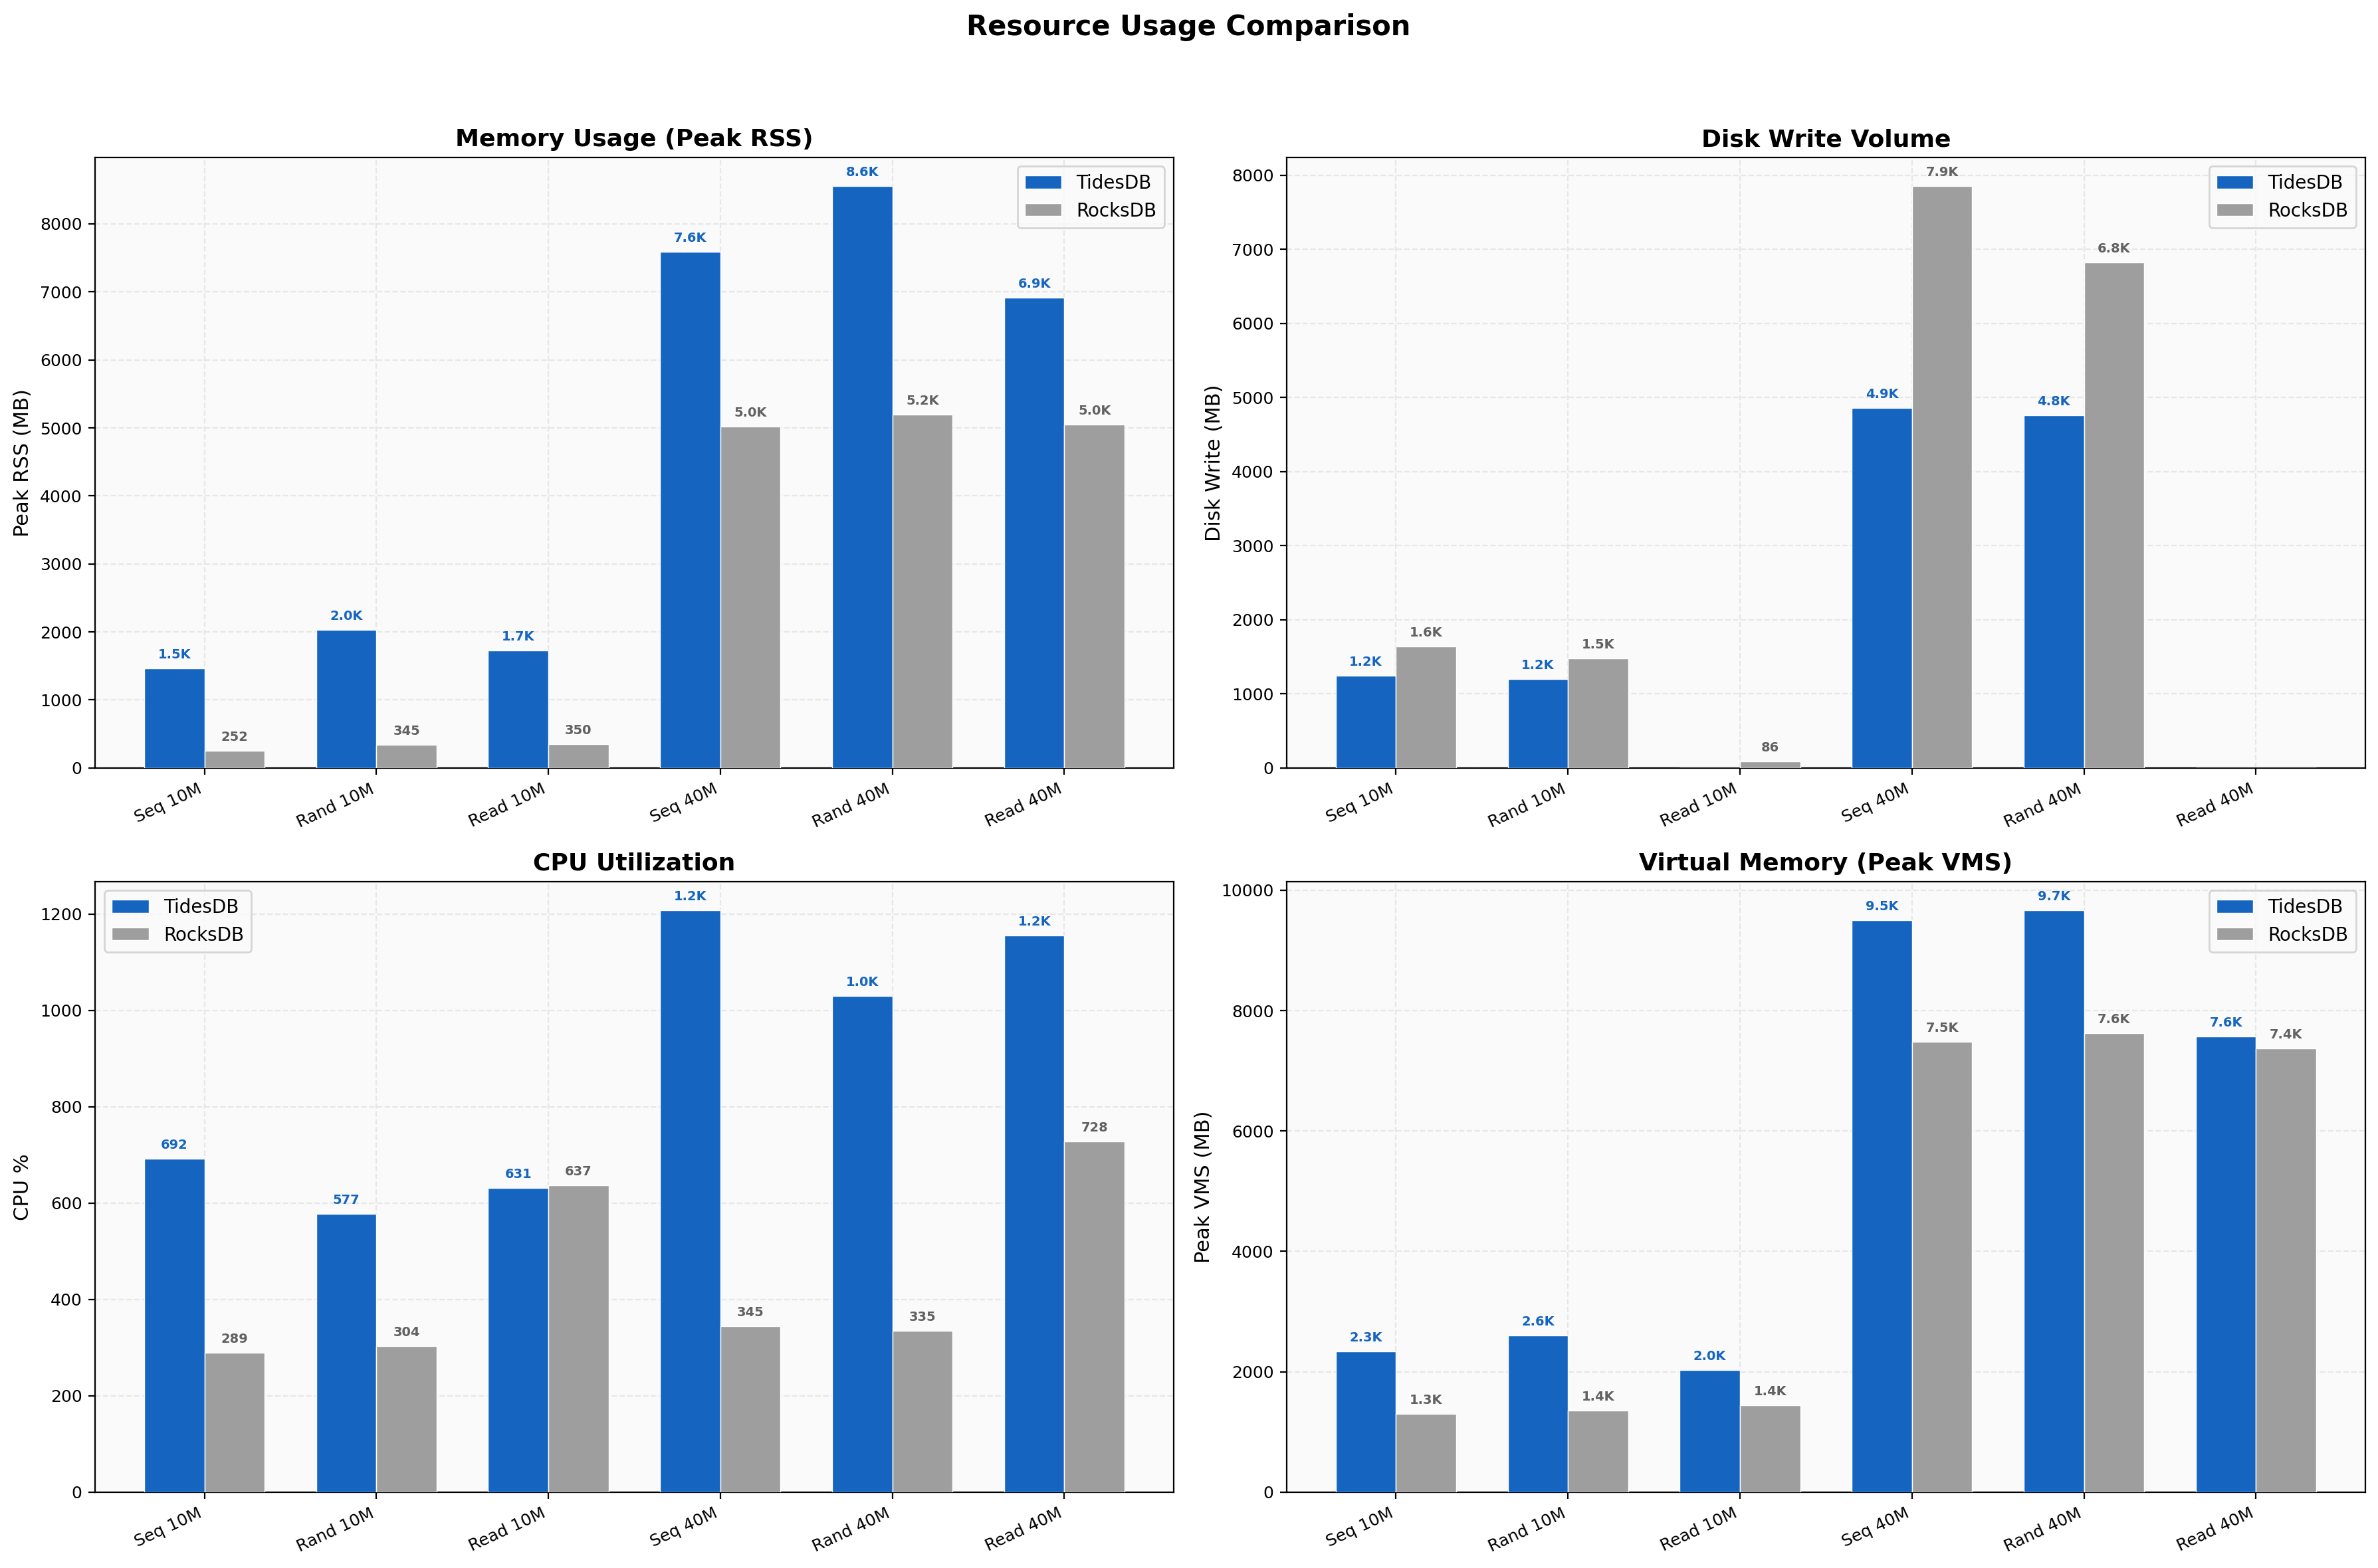
TidesDB uses more memory than RocksDB.
Peak RSS for standard random writes is 2,031 MB (TidesDB) versus 345 MB (RocksDB), and at large scale random writes it reaches 8,552 MB versus 5,193 MB.
This higher memory footprint reflects TidesDB’s in-memory data structures and caching strategy. Disk write volumes are generally lower for TidesDB (1,201 MB vs 1,481 MB for 10M random writes), consistent with lower write amplification. CPU utilization is higher for TidesDB in write workloads (577-691% vs 289-304%), indicating TidesDB leverages more CPU cores to achieve its throughput advantage (linearly scaling).
Tail Latency
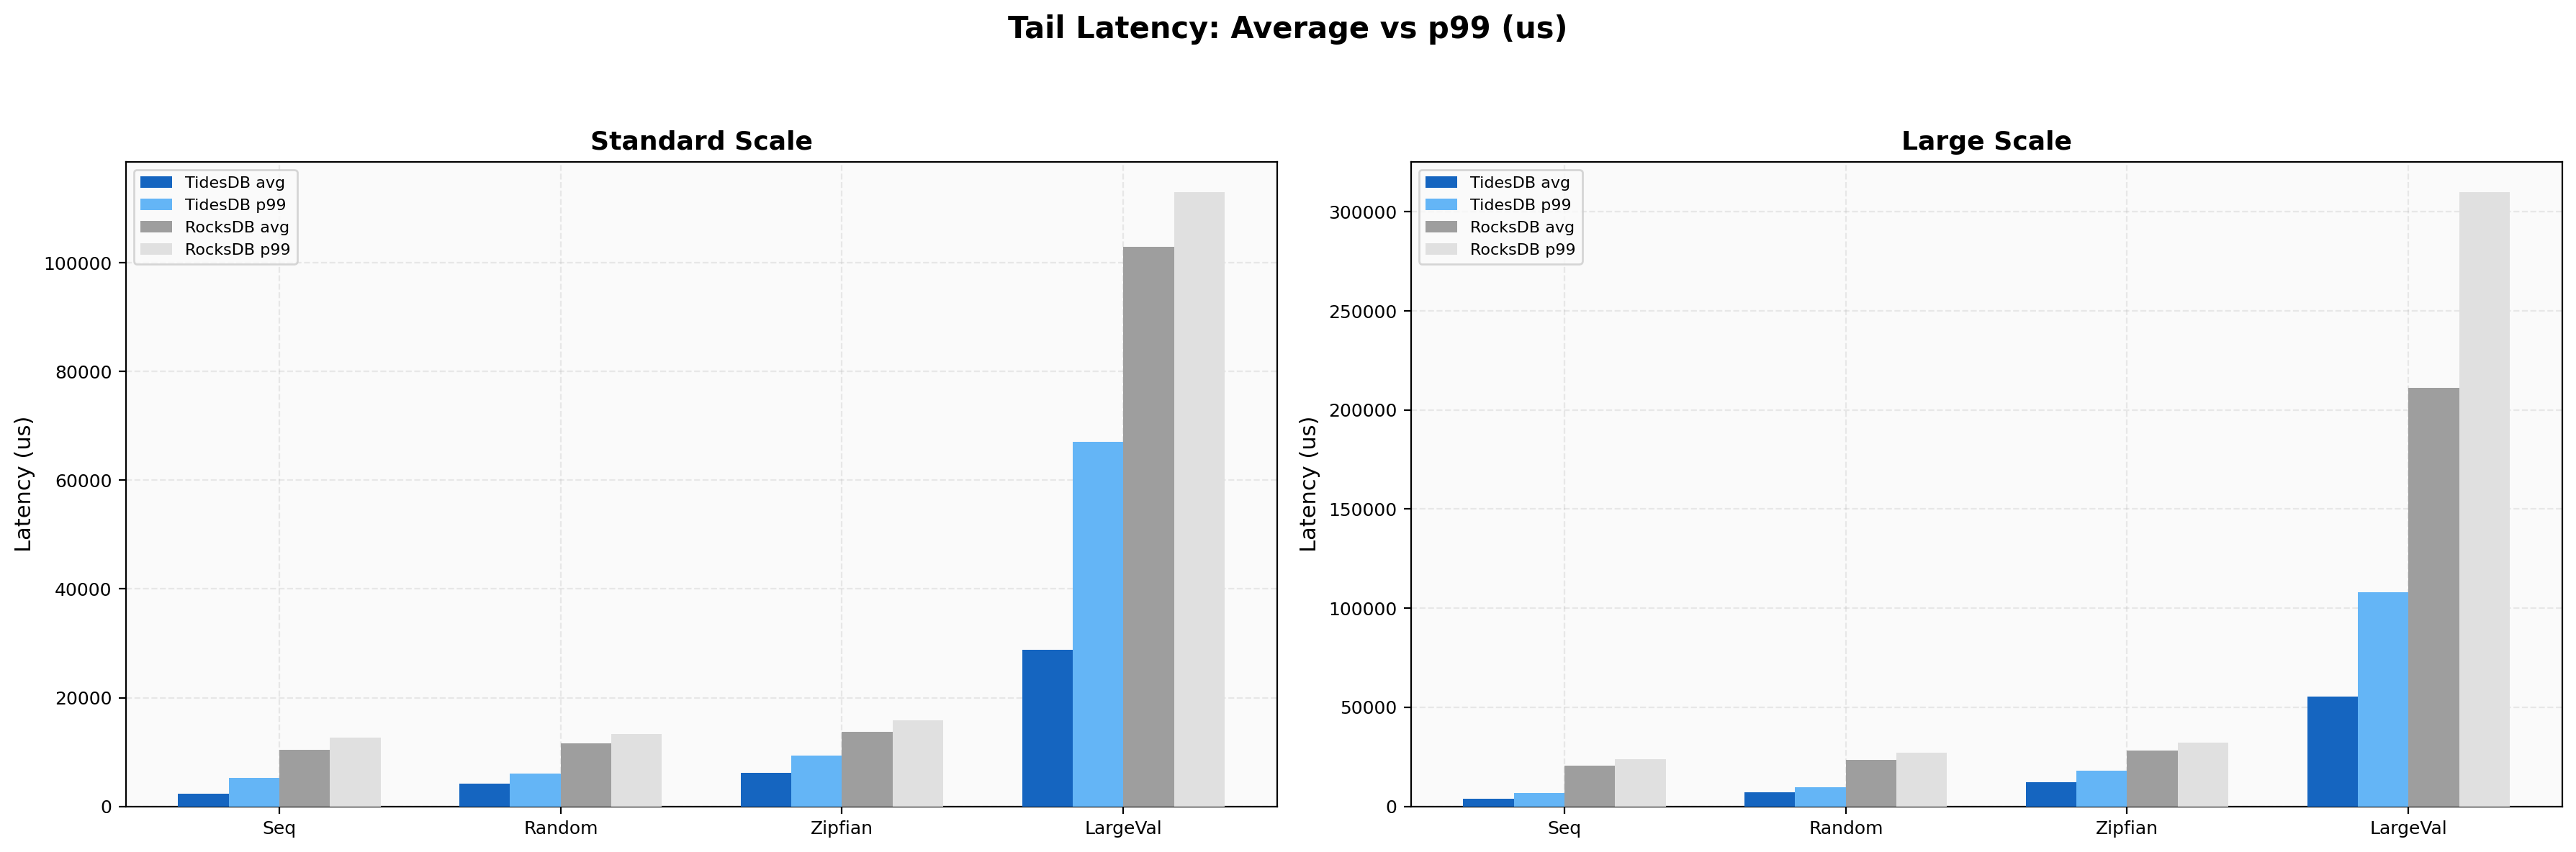
Comparing average latency against p99 latency highlights worst-case behavior. TidesDB’s p99-to-average ratio for sequential writes is 2.25x (5,245/2,330 us), while RocksDB’s is 1.23x (12,715/10,365 us). For random reads, TidesDB’s ratio is 1.67x (8/4.79 us) versus RocksDB’s 2.65x (24/9.06 us).
This shows that while TidesDB’s write tail is wider relative to its mean, its absolute p99 values remain well below RocksDB’s. In read and seek workloads, both engines maintain tight tail latency ratios, with TidesDB’s absolute p99 values consistently lower.
Duration Comparison
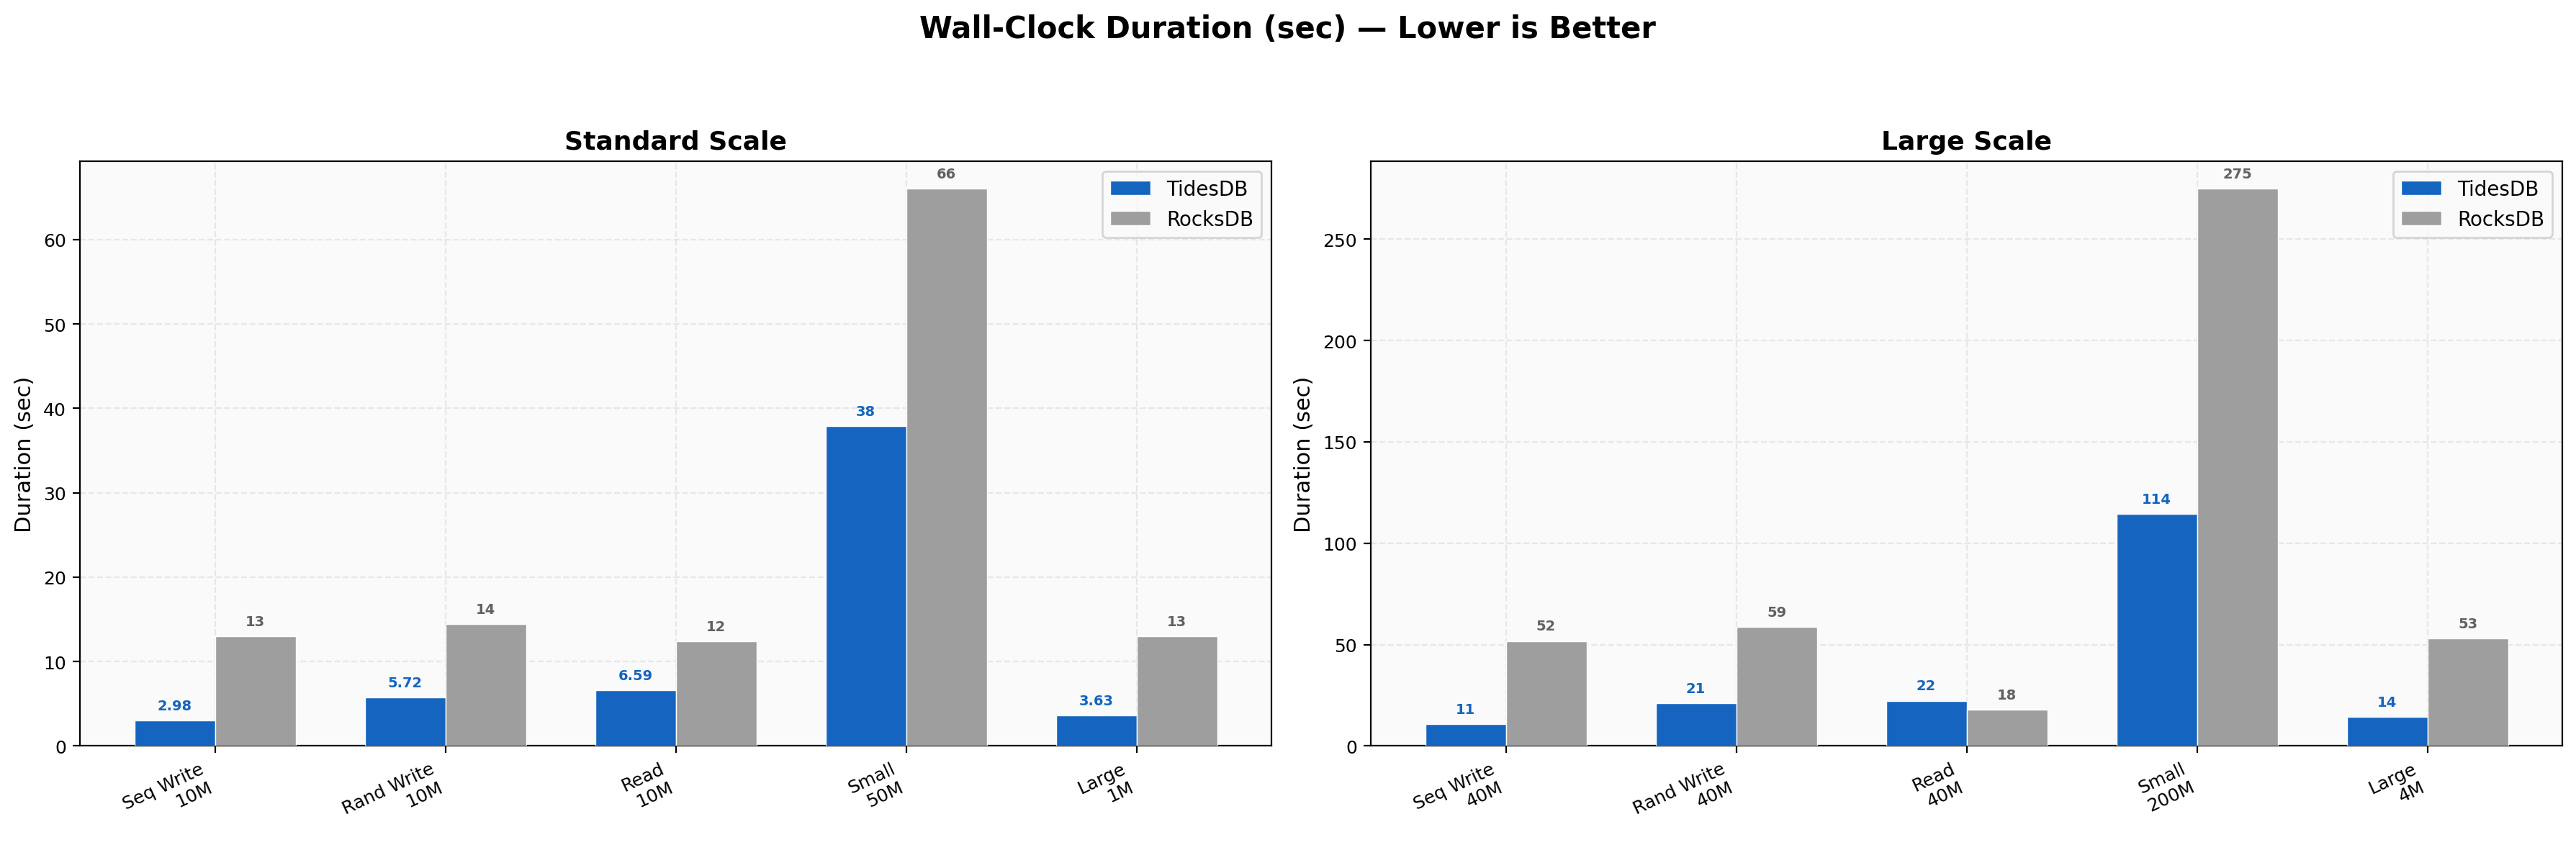
Wall-clock durations directly reflect throughput differences. Standard sequential writes complete in 2.98s (TidesDB) versus 12.96s (RocksDB).
Random writes take 5.72s versus 14.44s. At large scale, sequential writes finish in 10.77s versus 51.79s, and random writes take 20.94s versus 58.66s. The most dramatic difference is in large-value writes - 3.63s versus 12.96s at standard scale, and 14.18s versus 52.91s at large scale. Small-value writes (200M ops, 16 threads) show 114.35s versus 274.91s.
These durations confirm TidesDB completes benchmark workloads in substantially less time across nearly all categories.
Latency Variability
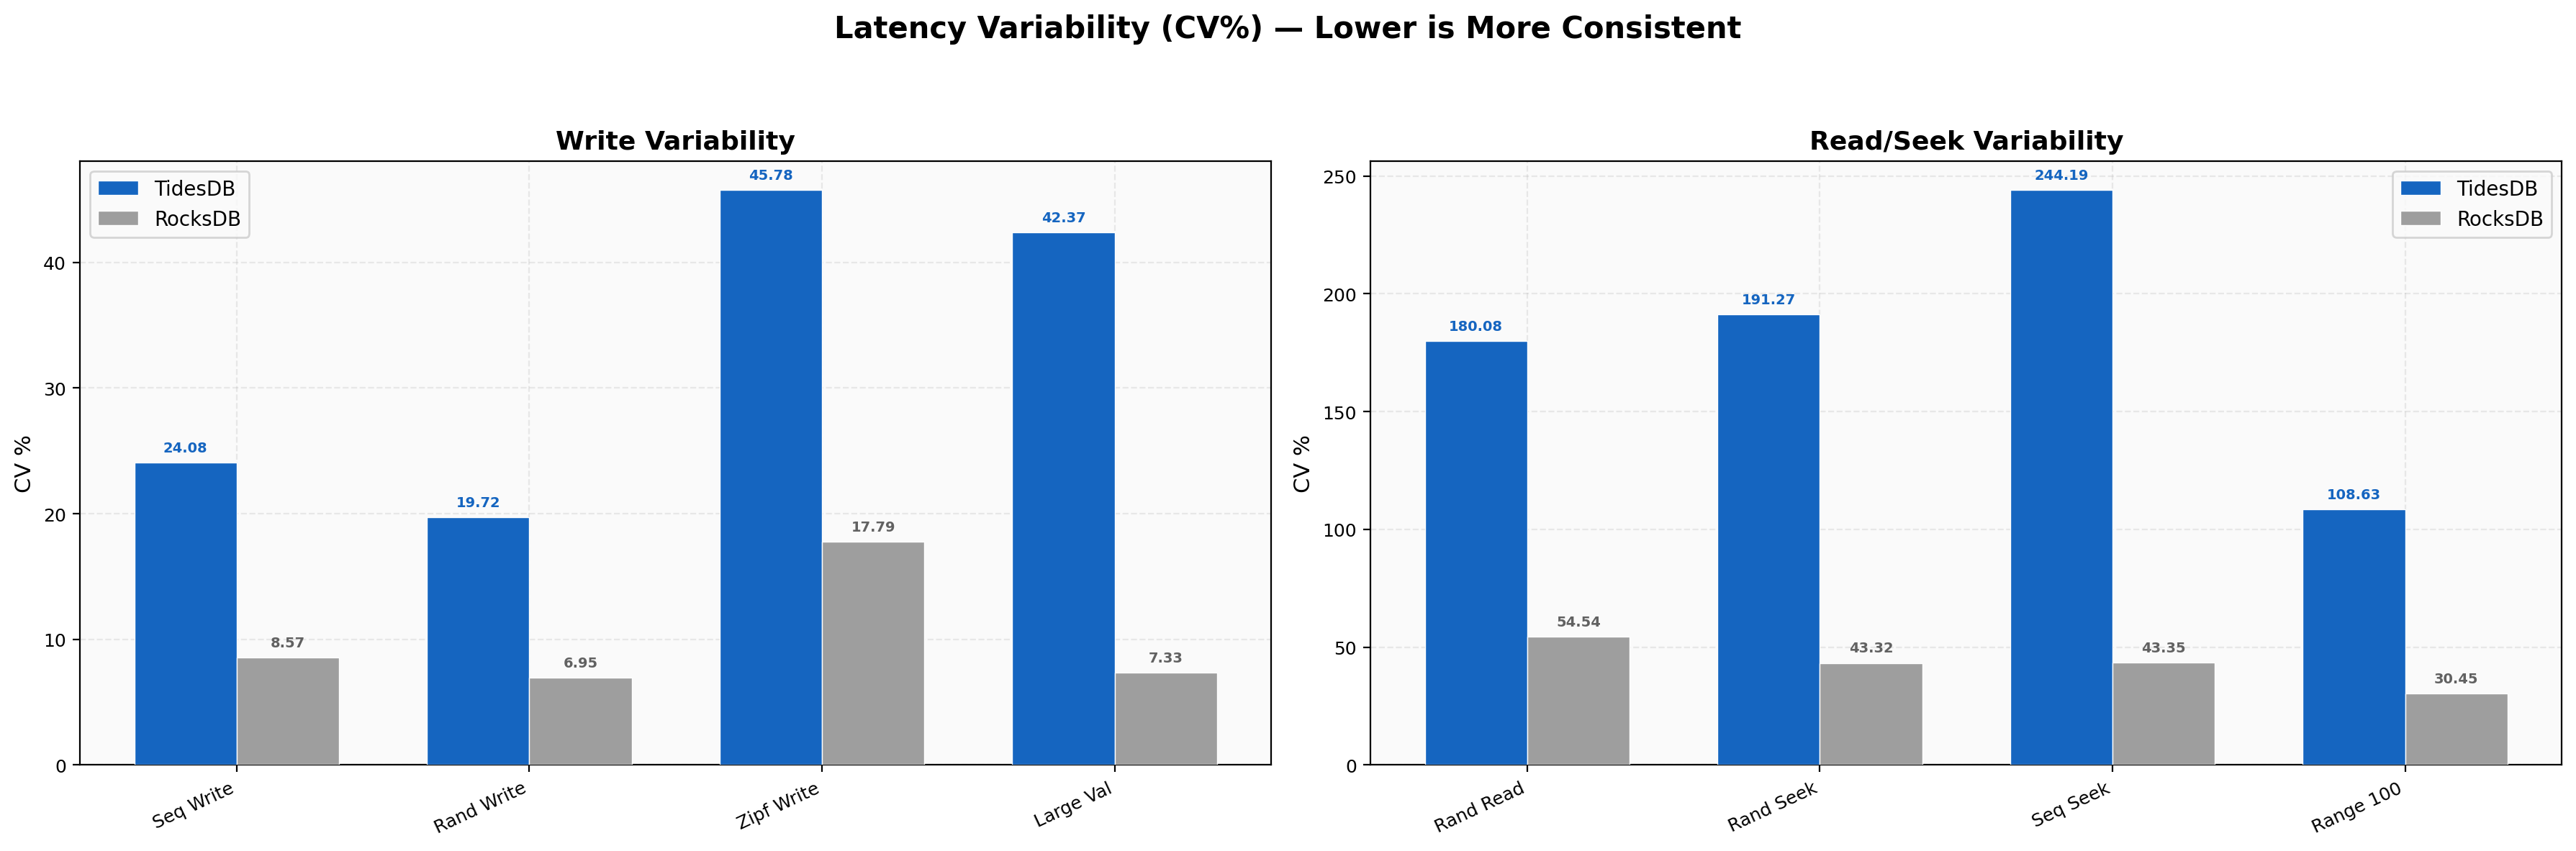
Coefficient of variation (CV% = stddev/mean x 100) measures latency consistency.
For write workloads, TidesDB shows higher CV% at 24.08% (sequential) and 19.72% (random) versus RocksDB’s 8.57% and 6.95%.
This means TidesDB’s writes are more variable relative to their mean, though the absolute latency range is still lower.
Read workloads tell a different story really, TidesDB’s read CV% is 180% due to its very low mean (4.79 us) with occasional outliers, while RocksDB’s is 54.54% with a higher baseline. For seeks, both engines show moderate variability (43-191% for TidesDB, 35-52% for RocksDB), with TidesDB’s higher CV% again reflecting its much lower absolute latencies.
Sync Write Performance
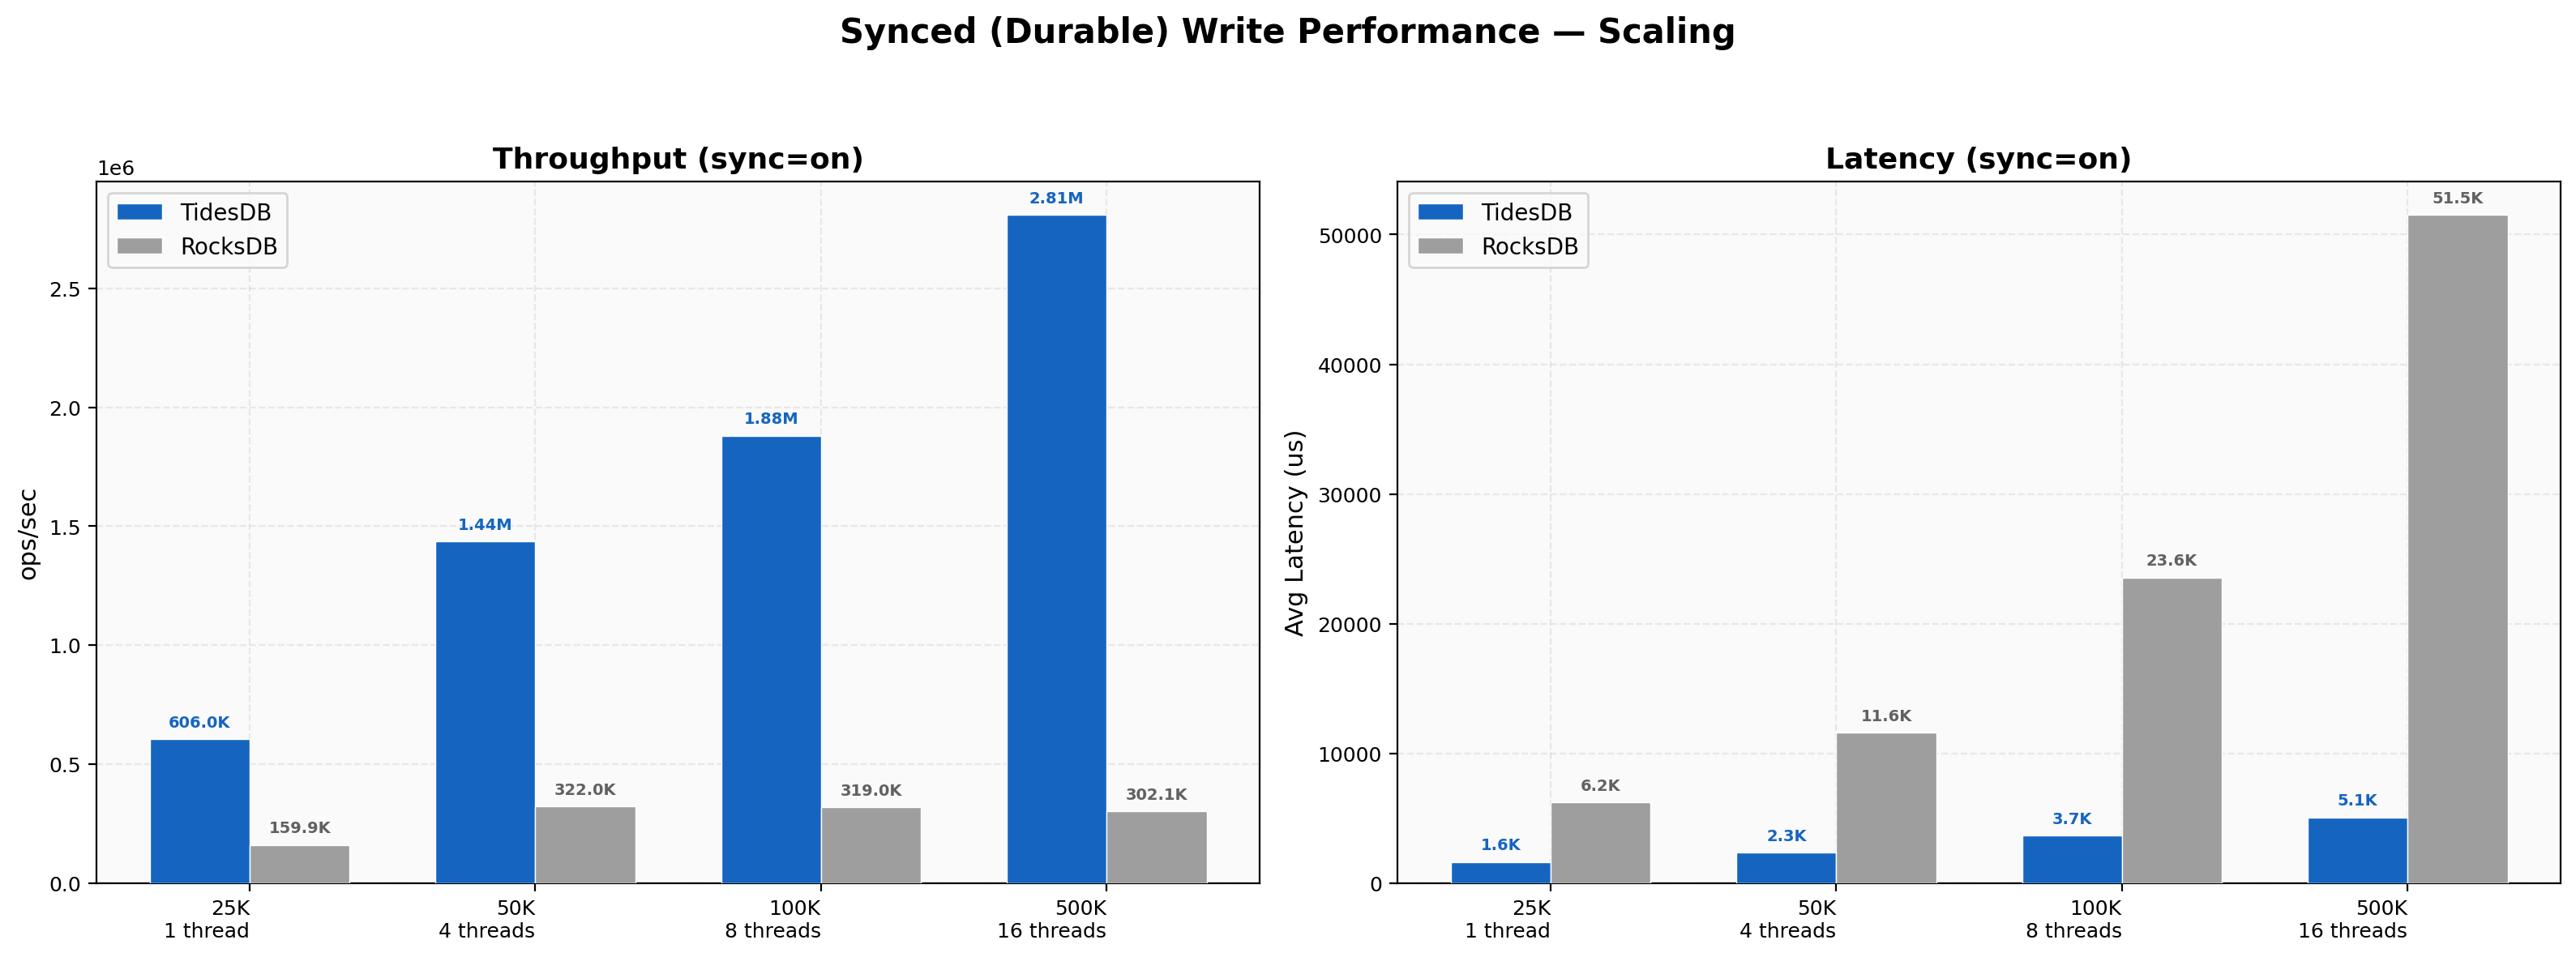
Synced (durable) writes with fsync enabled represent the most demanding write scenario. TidesDB’s advantage grows dramatically with concurrency, at 1 thread (25K ops), TidesDB achieves 606K vs 160K ops/sec (3.79x).
At 4 threads (50K ops), the gap widens to 1.44M vs 322K (4.46x). At 8 threads (100K ops), TidesDB reaches 1.88M vs 319K (5.89x). At 16 threads (500K ops), TidesDB delivers 2.81M vs 302K ops/sec - a 9.30x advantage. RocksDB’s synced write throughput barely scales beyond 1 thread, while TidesDB continues to scale near-linearly. Average latency per batch at 16 threads is 5,066 us (TidesDB) versus 51,522 us (RocksDB).
Summary
Across 25 benchmark categories on a 32-core Threadripper with NVMe storage, TidesDB v8.3.2 outperforms RocksDB v10.10.1 in the majority of workloads. The choice is up to you and your own use case and, really workload and specific requirements.
Thank you for reading!
—
You can find raw results below.
| File | Checksum |
|---|---|
| tidesdb_rocksdb_benchmark_results_20260212_194339.csv | 4af0a0907c2e4fdb8775b025c53916933ab6c8a4438133e1e241e9e00901b4c8 |
| tidesdb_rocksdb_benchmark_results_20260212_194339.txt | c8b9ae75f0bef6a8fb649ef76a20d8031a410b44af7cab21d4353f82f97ff804 |