TidesDB (TideSQL 4) & RocksDB in MariaDB 11.8.6 TPC-C Analysis

published on March 21st, 2026
In this analysis I will be going over results running TPC-C workloads on TidesDB (TideSQL v4.0.0) and RocksDB (MyRocks) in MariaDB 11.8.6.
I attempted this same analysis with 12.2.2 but encountered memory corruption issues with the MyRocks storage engine under concurrent stored procedure execution.
The server crashed with heap corruption (signal 6) and segfaults (signal 11) during the TPC-C run phase with 8 virtual users. TidesDB completed the same workload without issue on 12.2.2. Switching to 11.8.6 resolved the problem for RocksDB.
 TPC-C is a much more complex and realistic benchmark than sysbench. It simulates a complete order-entry environment with five transaction types running concurrently. New Order, Payment, Delivery, Order Status, and Stock Level. Each transaction hits multiple tables with a mix of reads, writes, and joins. To learn more about TPC-C visit TPC-C.
—
I wrote a custom shell script to run the benchmarks and collect the results. You can find it here:
tidesdb_rocksdb_hammerdb.sh (sha256sum d9fde85e65a36c9860c53577c77c1914143872f9ba6c756b77e057182fa000c7)
Ran:
./tidesdb_rocksdb_hammerdb.sh -b tpcc \ --warehouses 40 --tpcc-vu 8 --tpcc-build-vu 8 \ --rampup 1 --duration 5 --settle 20 \ -H ~/HammerDB-5.0 \ -u hammerdb --pass hammerdb123 -S /tmp/mariadb.sockThe test used 40 warehouses which produces a few GB of data, exceeding the buffer and cache sizes configured for both engines. 8 virtual users ran the workload for 5 minutes after a 1 minute ramp-up period. A 20-second settle window after the schema build gave background work time to finish before measurement started. Both engines used the same stored procedures and the same MariaDB configuration.
The MariaDB configs used can be found here (my.cnf):
https://github.com/tidesdb/mariadb-bench-cnf
The specs for the environment are:
- Intel Core i7-11700K (8 cores, 16 threads) @ 4.9GHz
- 48GB DDR4
- Western Digital 500GB WD Blue 3D NAND Internal PC SSD (SATA)
- Ubuntu 23.04 x86_64 6.2.0-39-generic
- GCC (glibc)
Running latest TidesDB v8.9.4 and RocksDB (@@rocksdb_git_hash=79f08d7ffa6d34d9ca3357777bcb335884a56cfb) RocksDB 6.29.5 which is what MariaDB comes with by default and what’s supported.
TPM
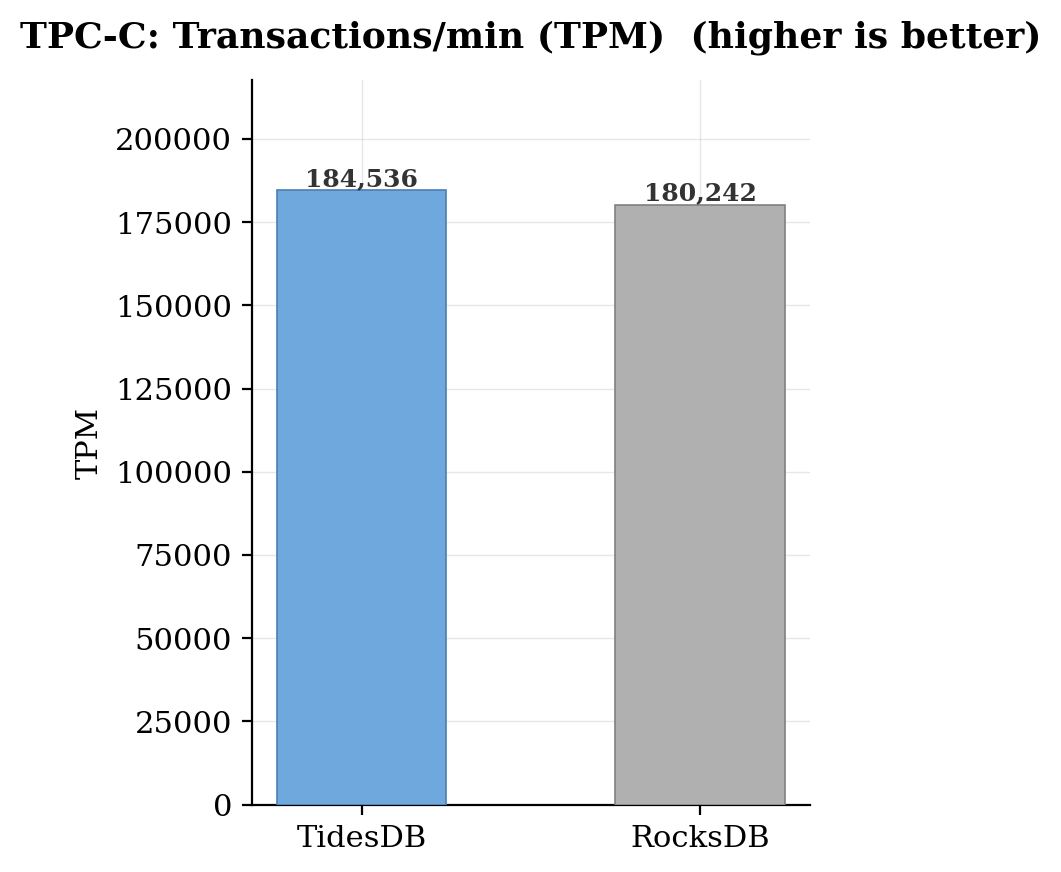
TPM is the total number of MariaDB transactions per minute across all five TPC-C transaction types. TidesDB reached 184,536 TPM versus 180,242 for RocksDB. That is roughly a 2.4% difference. Both engines handled the concurrent stored procedure workload without errors on 11.8.6.
NOPM
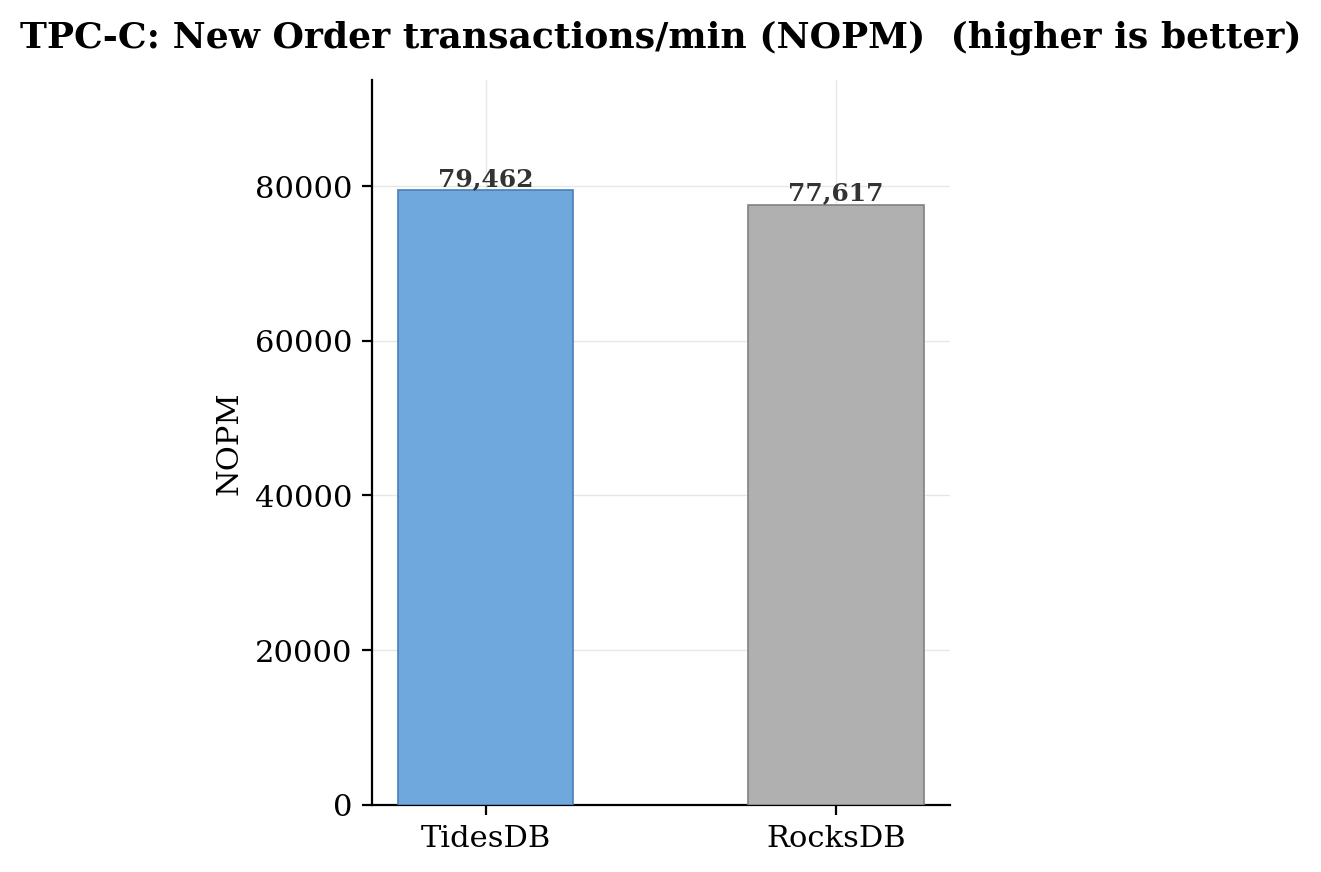
NOPM counts only the New Order transactions per minute. This is the primary TPC-C metric because New Order is the most complex of the five transactions, touching the most tables and involving both reads and writes in a single call. TidesDB posted 79,462 NOPM versus 77,617 for RocksDB. Again a modest lead of about 2.4%.
Latency
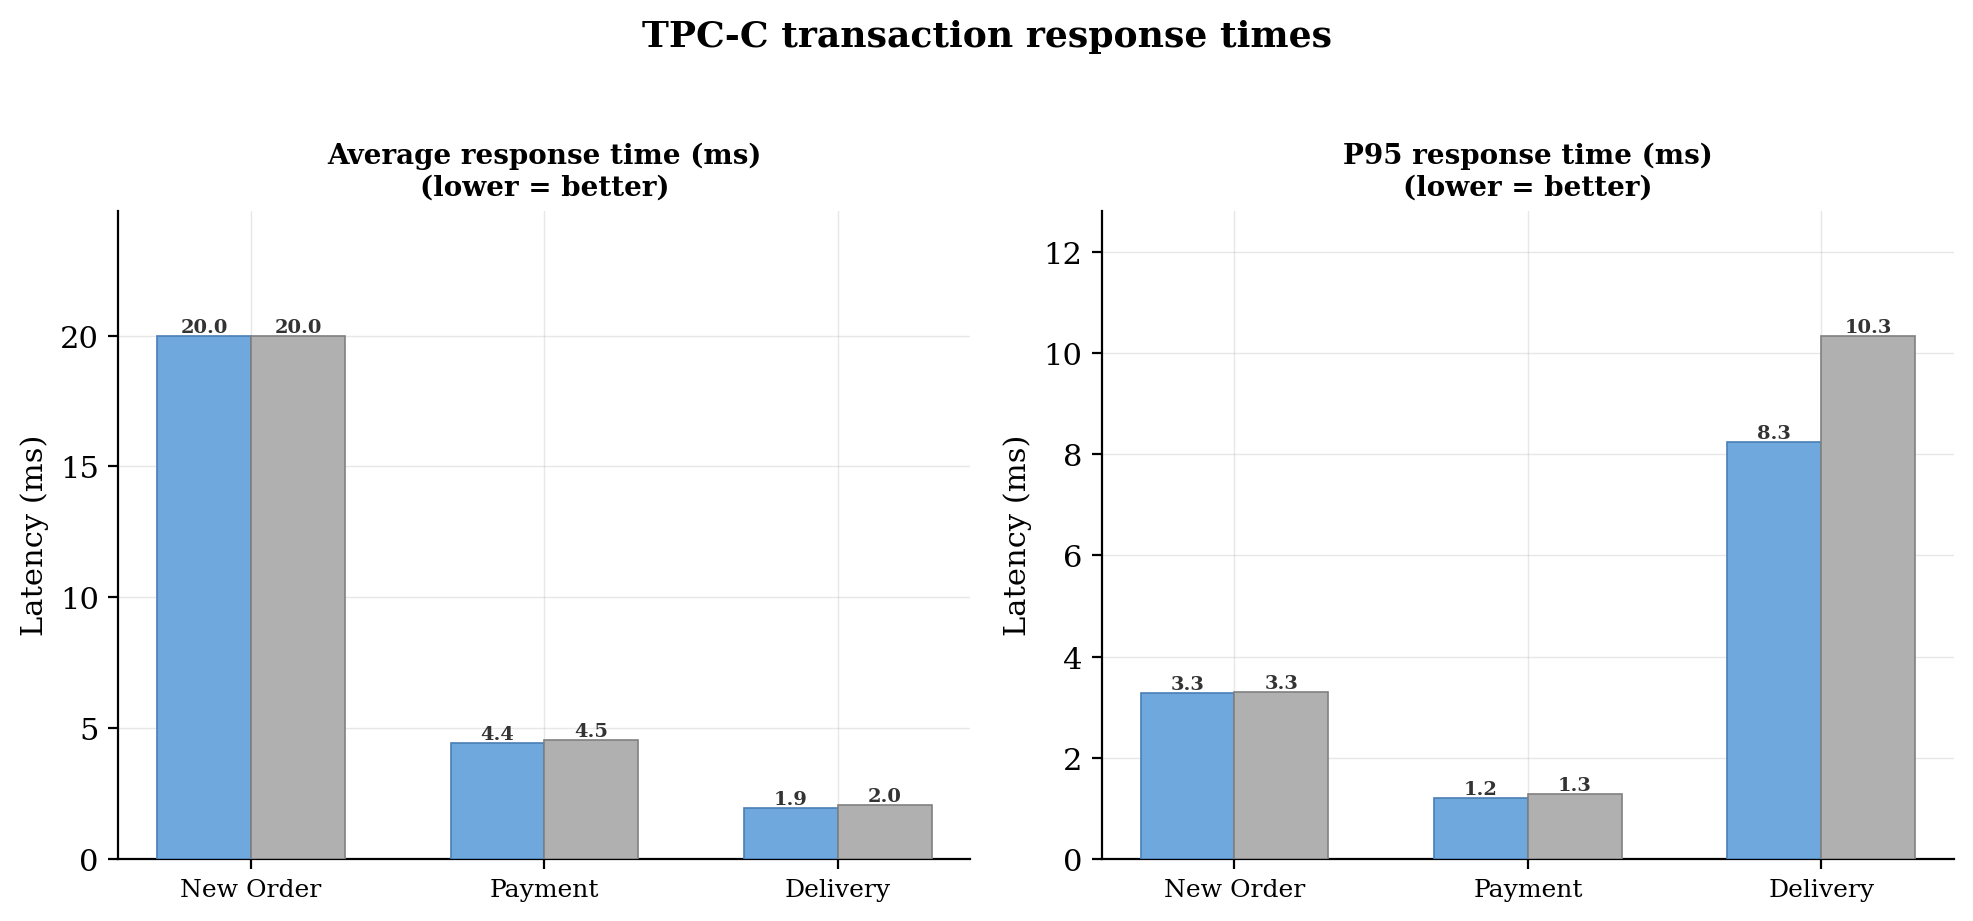
The latency chart breaks down response times for the three heaviest TPC-C transactions. New Order average was 3.27 ms for TidesDB versus 3.30 ms for RocksDB, essentially identical.
Payment was 1.20 ms versus 1.29 ms. The biggest gap showed up in Delivery where TidesDB averaged 8.25 ms versus 10.35 ms for RocksDB. Delivery is the most write-intensive of the five transaction types, scanning and updating multiple rows per call. This lines up with the sysbench results where TidesDB showed its largest advantages on write-heavy workloads.
P95 latency followed the same pattern. New Order P95 was 4.43 ms versus 4.55 ms. Payment was 1.93 ms versus 2.03 ms. Delivery P95 was 10.91 ms for TidesDB versus 12.43 ms for RocksDB, a 12% difference. The tail latency gap on Delivery suggests RocksDB occasionally stalls on the write path, consistent with what we saw in the sysbench maximum latency numbers.
Summary
The TPC-C results are very different than the sysbench numbers. Where sysbench showed TidesDB winning by 5x to 7x on pure write workloads, TPC-C narrows that gap significantly.
That said, TidesDB still came out ahead on every metric. TPM, NOPM, and all six latency measurements favored TidesDB. The Delivery transaction showed the most separation, reinforcing the write-path advantage seen in sysbench.
The fact that RocksDB crashed on MariaDB 12.2.2 under this same workload but ran cleanly on 11.8.6 is worth noting. Both engines are stable on the LTS release. For production deployments, 11.8.6 is the safer choice for either engine at this time.
With that thank you all for reading.
—
Raw data:
| File | SHA256 Checksum |
|---|---|
| hammerdb_results_20260321_124012.csv | 24cd148038984dc7eb69e4253adc1b2a580275df4f728aa198ee99636044fead |
| TPC-C_tidesql4-myrocks-11-8-6.zip | 38718b78f4d209508458a9527a51a8dfc9b72904f3d4d62a97fc1cd0c2a6cb2e |
Learn more about TideSQL by visiting the reference.