Benchmark Analysis on TideSQL v4.3.0 MINOR in MariaDB v11.8.6 TPC-C with jemalloc and PGO

published on April 24th, 2026
With the latest release of TidesDB v9.1.0 and TideSQL v4.3.0 I decided to publish another article walking through the work done and the TPC-C and iibench analysis comparing v4.2.6 to v4.3.0.
The two minor releases primarily address the delete bottleneck identified by Mark Callaghan from Small Datum in TideSQL issue #122.
Without getting into too much detail, the TidesDB minor improves iterator efficiency and tombstone handling by removing allocations, stabilizing key comparisons, and reducing overhead under delete-heavy workloads. It adds single delete, enabling early cancellation of put+delete pairs during compaction to reduce tombstones and improve scans, with fixes to ensure correct propagation and flush behavior.
On the TideSQL side, a new tidesdb_single_delete_primary session variable (default off) controls safe use of single delete on primary keys, with refactored delete paths, expanded tests, and minor bug fixes. Performance tuning shows faster bulk insert and index builds with smaller batch sizes.
Batch constant sweep
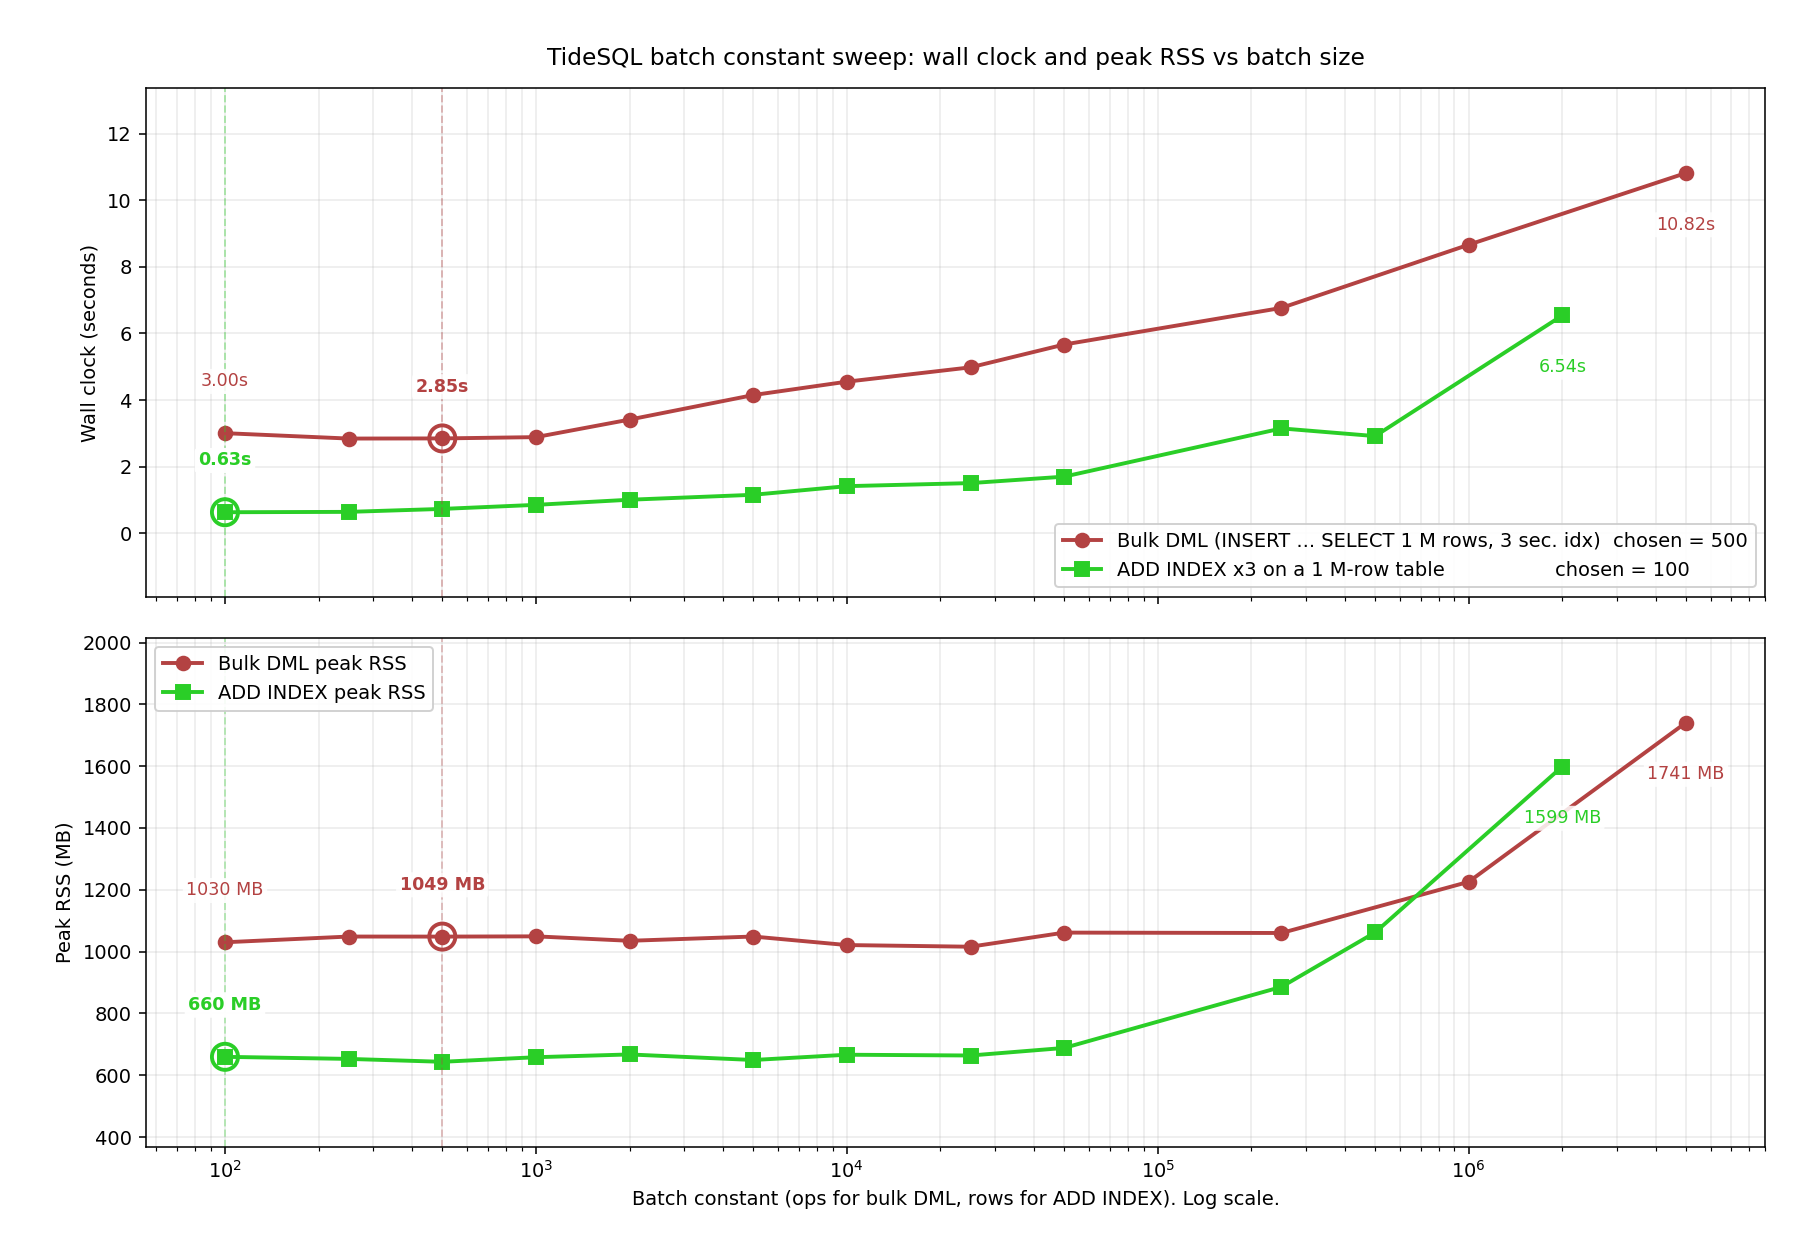
Two compile-time batch constants were swept from 100 to 5M. The red curve represents a 1M-row INSERT … SELECT into a table with three secondary indexes, measuring TIDESDB_BULK_INSERT_BATCH_OPS. The green curve represents ALTER TABLE ADD INDEX (x3) on a 1M-row table, measuring TIDESDB_INDEX_BUILD_BATCH. The top chart shows wall-clock time, and the bottom shows peak RSS. The x-axis is on a log scale, and circled points indicate the v4.3.0 selections.
Both curves move monotonically beyond their plateau. Bulk DML bottoms out around 250 to 500 ops at 2.85s, then rises to 10.82s at 5M. ADD INDEX bottoms out around 100 to 250 rows at 0.63s, then rises to 6.54s at 2M. RSS follows the same pattern.
At large batch sizes the cost of keeping a large transaction state in memory (the ops vector and the write set hash) dominates, and one huge commit triggers a synchronous memtable rotation instead of letting flushes pipeline with continued writes. v4.3.0 selects batch sizes of 500 and 100, roughly 50% faster bulk DML and 63% faster ADD INDEX compared to the previous 50,000 defaults, at lower peak memory usage.
Issue #122 delete latency regime shift
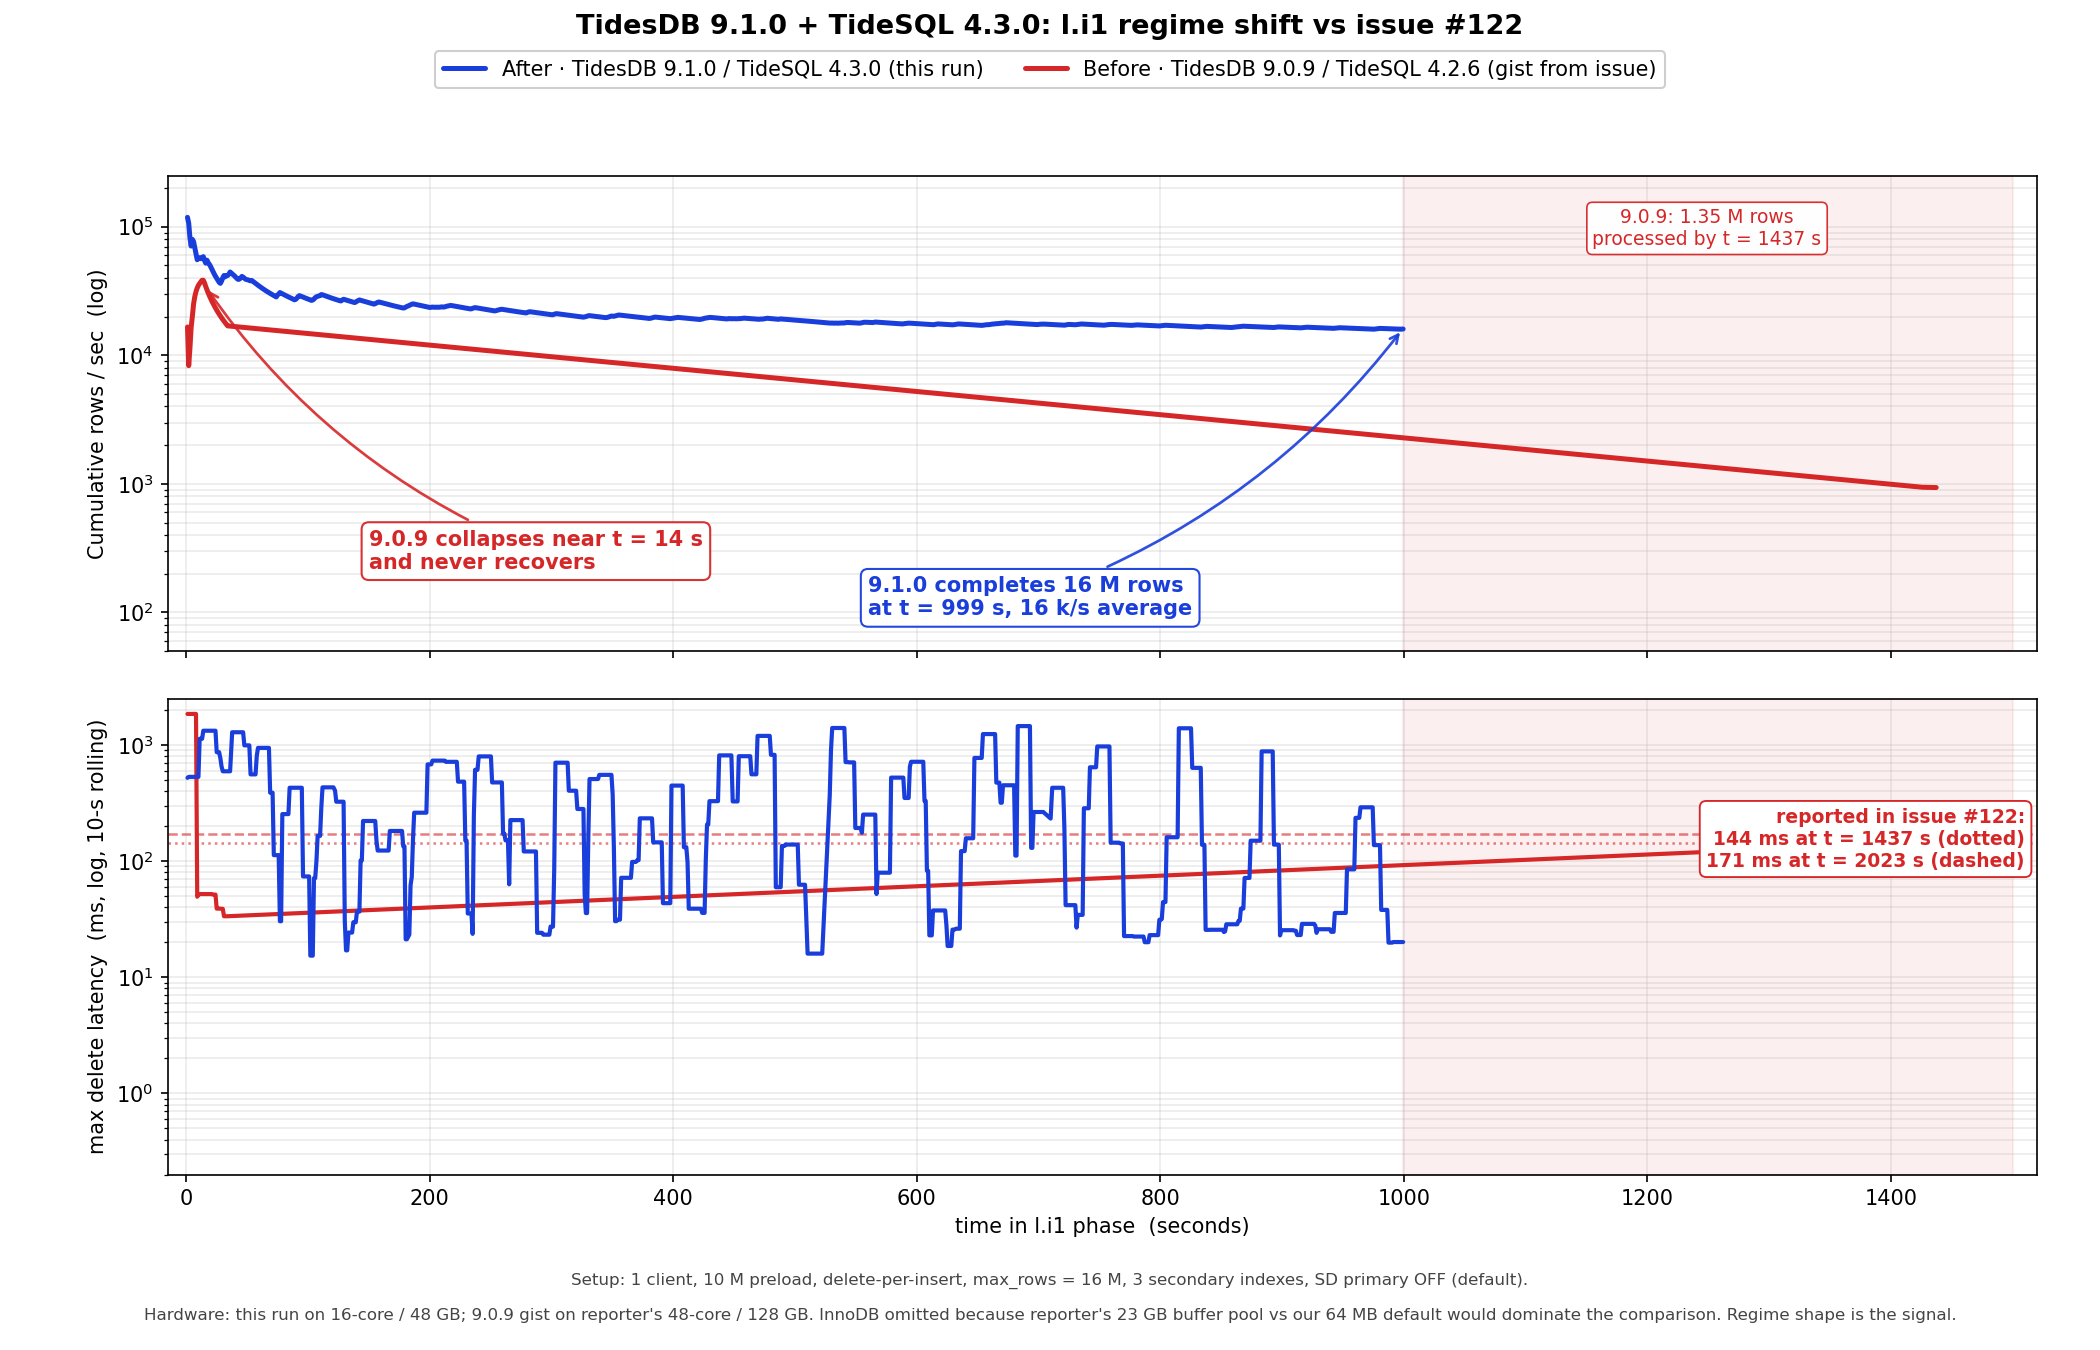
Reproduces the l.i1 phase from issue #122. One connection inserts at the high end of the primary key while another deletes from the low end at the same rate. The table has three secondary indexes. Configuration matches cl.repro.sh with one client, 10M preload, one delete per insert, 16M row cap, one second reporting, and tidesdb_single_delete_primary disabled.
Blue is TidesDB v9.1.0 with TideSQL v4.3.0 on a 16 core machine. Red is v9.0.9 and v4.2.6 from Mark’s 48 core system. Timing is not comparable across hardware but regime shape is. Top shows cumulative rows per second on a log scale. Bottom shows worst case delete latency with a ten second rolling max.
Red collapses within 20 seconds and never recovers, reaching only 1.35M rows by t = 1437 s, consistent with the tombstone walking PMP stack in the issue. Reference lines mark steady state peaks of 144 ms at t = 1437 s and 171 ms at t = 2023 s.
Blue sustains about 16k rows per second end to end and completes 16M rows at t = 999 s. Throughput oscillates rather than staying flat. Compaction pressure stalls drop the rate to 2 to 3k rows per second for 50 to 500 ms, then drain over seconds and recover to 30 to 70k rows per second with sub millisecond latencies.
Now we check for regressions, carrying on from this article, taking the jemalloc PGO results and the configuration and rerunning with the latest minors to compare, 2 runs plus an extra large block cache run.
- hammerdb_results_20260423_181701.csv
- hammerdb_results_20260423_182443.csv
Those are the two previous article runs on TidesDB v9.0.9, TideSQL v4.2.6, MariaDB v11.8.6.
Environment
- AMD Ryzen Threadripper 2950X (16 cores 32 threads) @ 3.5GHz
- 128GB DDR4
- Ubuntu 22.04 x86_64
- GCC (glibc)
- XFS raw NVMe (SAMSUNG MZVLB512HAJQ-00000) with discard, inode64, nodiratime, noatime, logbsize=256k, logbufs=8
- TidesDB v9.1.0, TideSQL v4.3.0, MariaDB v11.8.6
My steps are as follows
-- I clone TideSQL and install with MariaDB 11.8.6 and jemalloc PGO
./install.sh --mariadb-prefix /data/mariadb --tidesdb-prefix /data/tidesdb --build-dir /data/tidesql-build  --mariadb-version mariadb-11.8.6 --skip-engines mroonga,rocksdb,connect,spider,oqgraph,columnstore --pgo --allocator jemalloc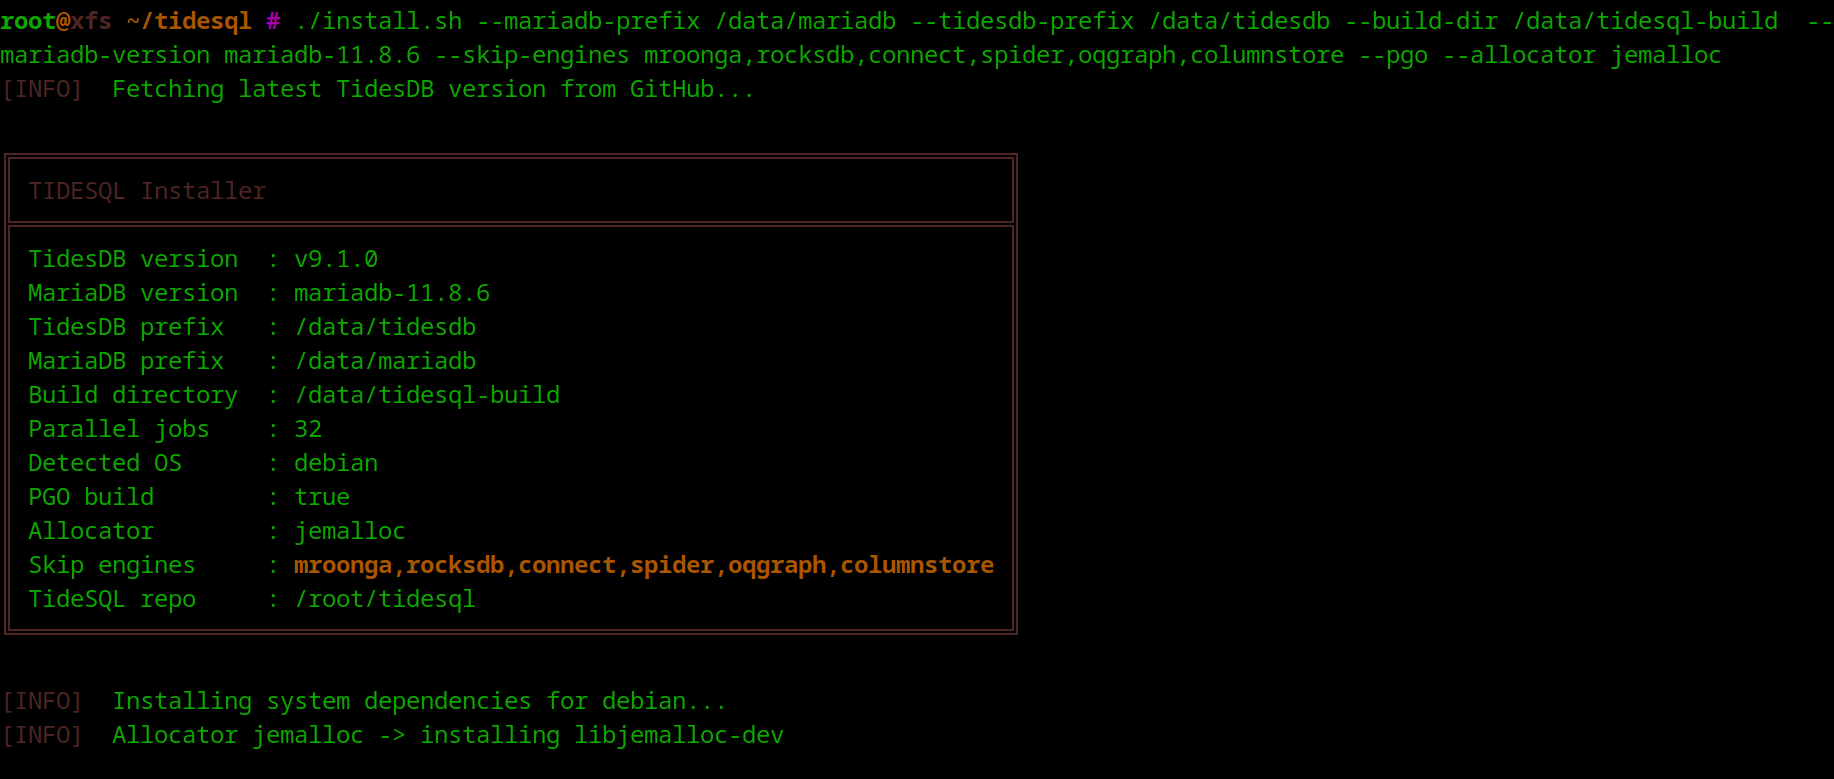
I then modify /data/mariadb/my.cnf to use a certain config and start MariaDB.
my.cnf
[mysqld]basedir = /data/mariadbdatadir = /data/mariadb/dataport    = 3306socket  = /tmp/mariadb.sockuser    = rootpid-file = /data/mariadb/data/mariadb.pidlog-error = /data/mariadb/data/mariadb.err
# Networkingbind-address = 127.0.0.1max_connections = 1024table_open_cache=2000table_open_cache_instances=16back_log=1500max_prepared_stmt_count=102400innodb_open_files=1024
sort_buffer_size = 4Mjoin_buffer_size = 4Mread_buffer_size = 2Mread_rnd_buffer_size = 2Mtmp_table_size = 64Mmax_heap_table_size = 64M
skip-log-binsync_binlog = 0
table_open_cache = 4096table_definition_cache = 2048
# InnoDB (inspired by https://hammerdb.com/ci-config/maria.cnf)default_storage_engine = InnoDBinnodb_buffer_pool_size = 64M#innodb_buffer_pool_instances = 4innodb_log_file_size = 64Minnodb_log_buffer_size = 64Minnodb_flush_log_at_trx_commit = 0innodb_file_per_table = ONinnodb_doublewrite = 0innodb_flush_method = O_DIRECTinnodb_io_capacity = 10000innodb_io_capacity_max = 20000innodb_purge_threads = 4innodb_max_purge_lag_wait=0innodb_max_purge_lag=0innodb_max_purge_lag_delay=1innodb_lru_scan_depth=128innodb_read_only=0innodb_adaptive_hash_index=0innodb_undo_log_truncate=oninnodb_undo_tablespaces=1innodb_fast_shutdown=0innodb_max_dirty_pages_pct=1innodb_max_dirty_pages_pct_lwm=0.1innodb_adaptive_flushing=1innodb_adaptive_flushing_lwm=0.1innodb_flush_neighbors=0innodb_read_io_threads=4innodb_write_io_threads=4innodb_read_ahead_threshold=0innodb_buffer_pool_dump_at_shutdown=0innodb_buffer_pool_load_at_startup=0join_buffer_size=32Ksort_buffer_size=32Kinnodb_use_native_aio=1innodb_stats_persistent=1innodb_log_write_ahead_size=4096performance_schema=OFF
# Loggingslow_query_log = ONslow_query_log_file = /data/mariadb/data/slow.loglong_query_time = 2
# Character setcharacter-set-server = utf8mb4collation-server = utf8mb4_general_ci
# TidesDBplugin_load_add = ha_tidesdb.soplugin_maturity = gamma
tidesdb_pessimistic_locking = OFF
tidesdb_block_cache_size = 64Mtidesdb_max_open_sstables = 512tidesdb_unified_memtable_sync_mode = NONEtidesdb_unified_memtable_write_buffer_size = 64Mtidesdb_default_write_buffer_size = 64Mtidesdb_default_sync_mode = NONEtidesdb_default_compression = NONEtidesdb_flush_threads = 4tidesdb_compaction_threads = 4tidesdb_log_level = NONE
[client]port = 3306socket = /tmp/mariadb.sockdefault-character-set = utf8mb4
[mysqldump]quickmax_allowed_packet = 64M
[mariadb-backup]
In this run and the second I use 64mb unified write buffer size and block cache, except for the last run where I bump the block cache to 16G, so we have a small cache and large cache run.
From here I start my server, create my HammerDB script user and run my analysis, any time I modify cnf I shut down then start again.
LD_PRELOAD=/usr/lib/x86_64-linux-gnu/libjemalloc.so.2 /data/mariadb/bin/mariadbd-safe --defaults-file=/data/mariadb/my.cnf &

/data/mariadb/bin/mariadb -u root --socket=/tmp/mariadb.sock
CREATE USER 'hammerdb'@'localhost' IDENTIFIED BY 'hammerdb123';GRANT ALL PRIVILEGES ON *.* TO 'hammerdb'@'localhost';FLUSH PRIVILEGES;
The script I use is simple, you pick an engine and configure your HammerDB workload parameters.
./hammerdb_runner.sh -b tpcc --warehouses 40 --tpcc-vu 8 --tpcc-build-vu 8 --rampup 1 --duration 2 --settle 5 -H ~/HammerDB-5.0 -e tidesdb -u hammerdb --pass hammerdb123 -S /tmp/mariadb.sockRegression check
Large cache
Summary
v4.3.0 works on issue #122 by addressing the delete slowness from two sides at the library level.
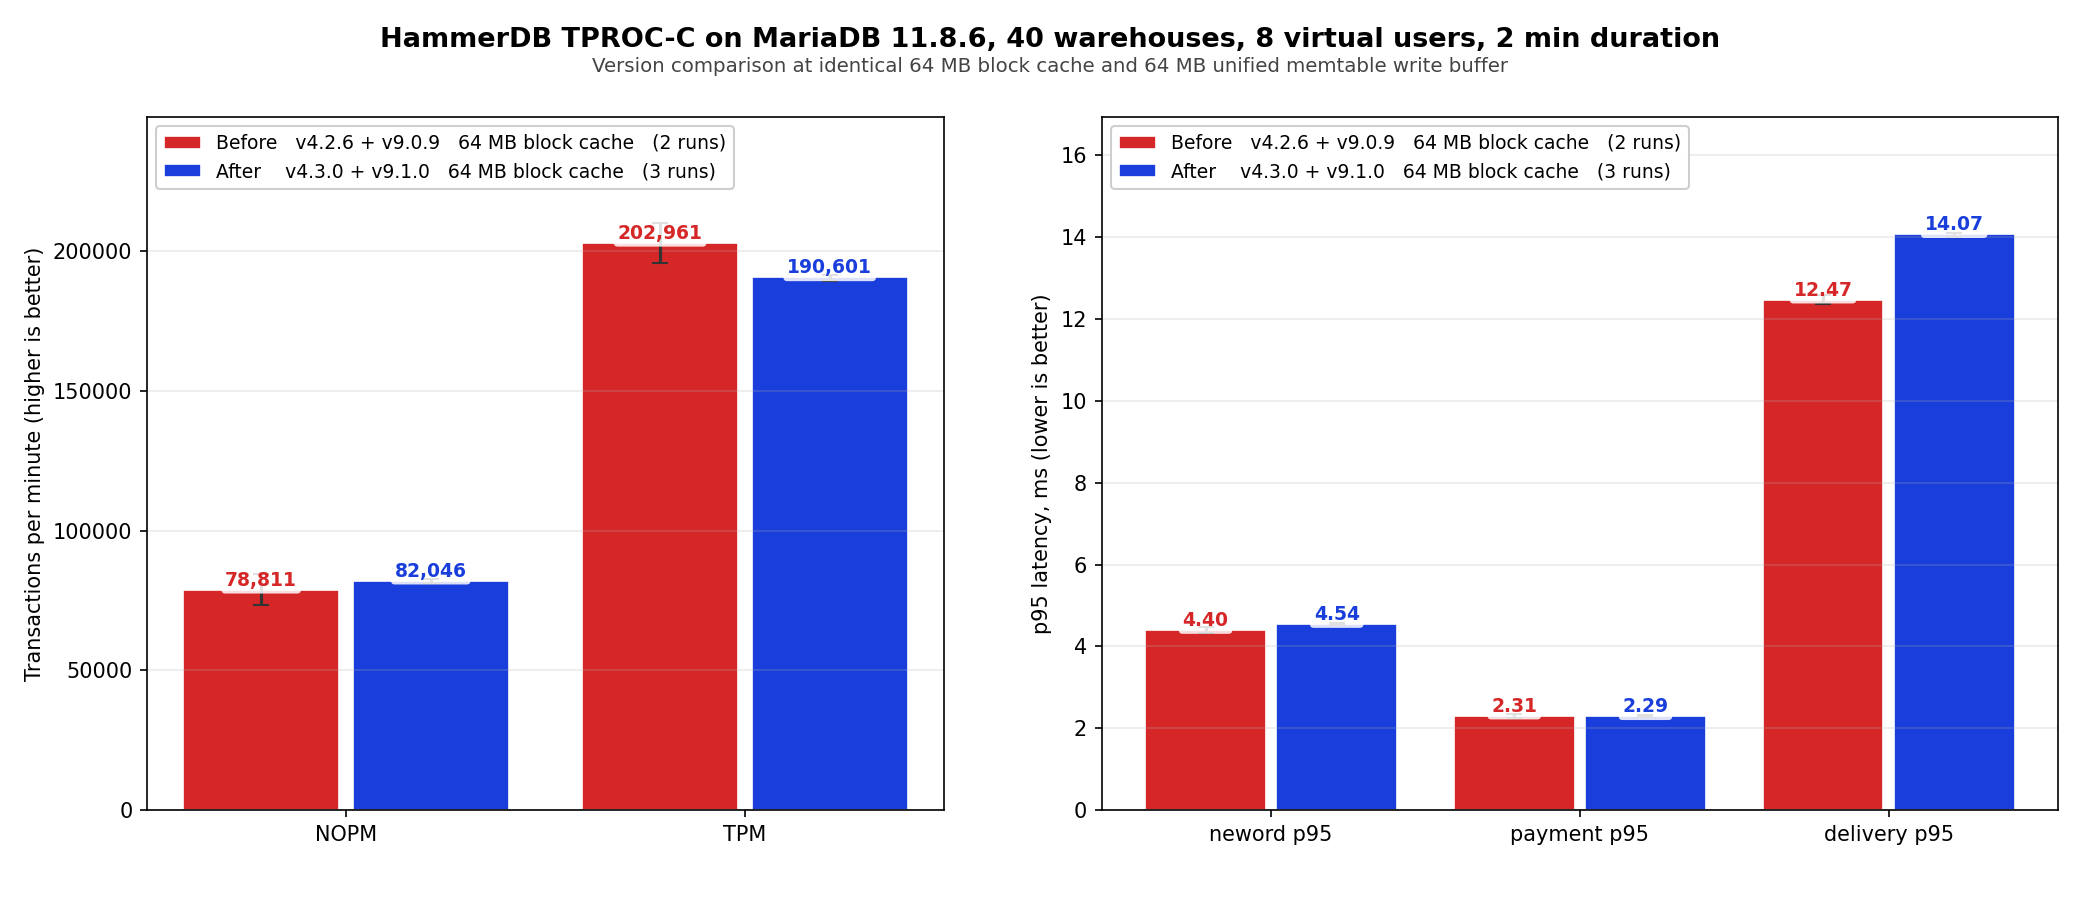
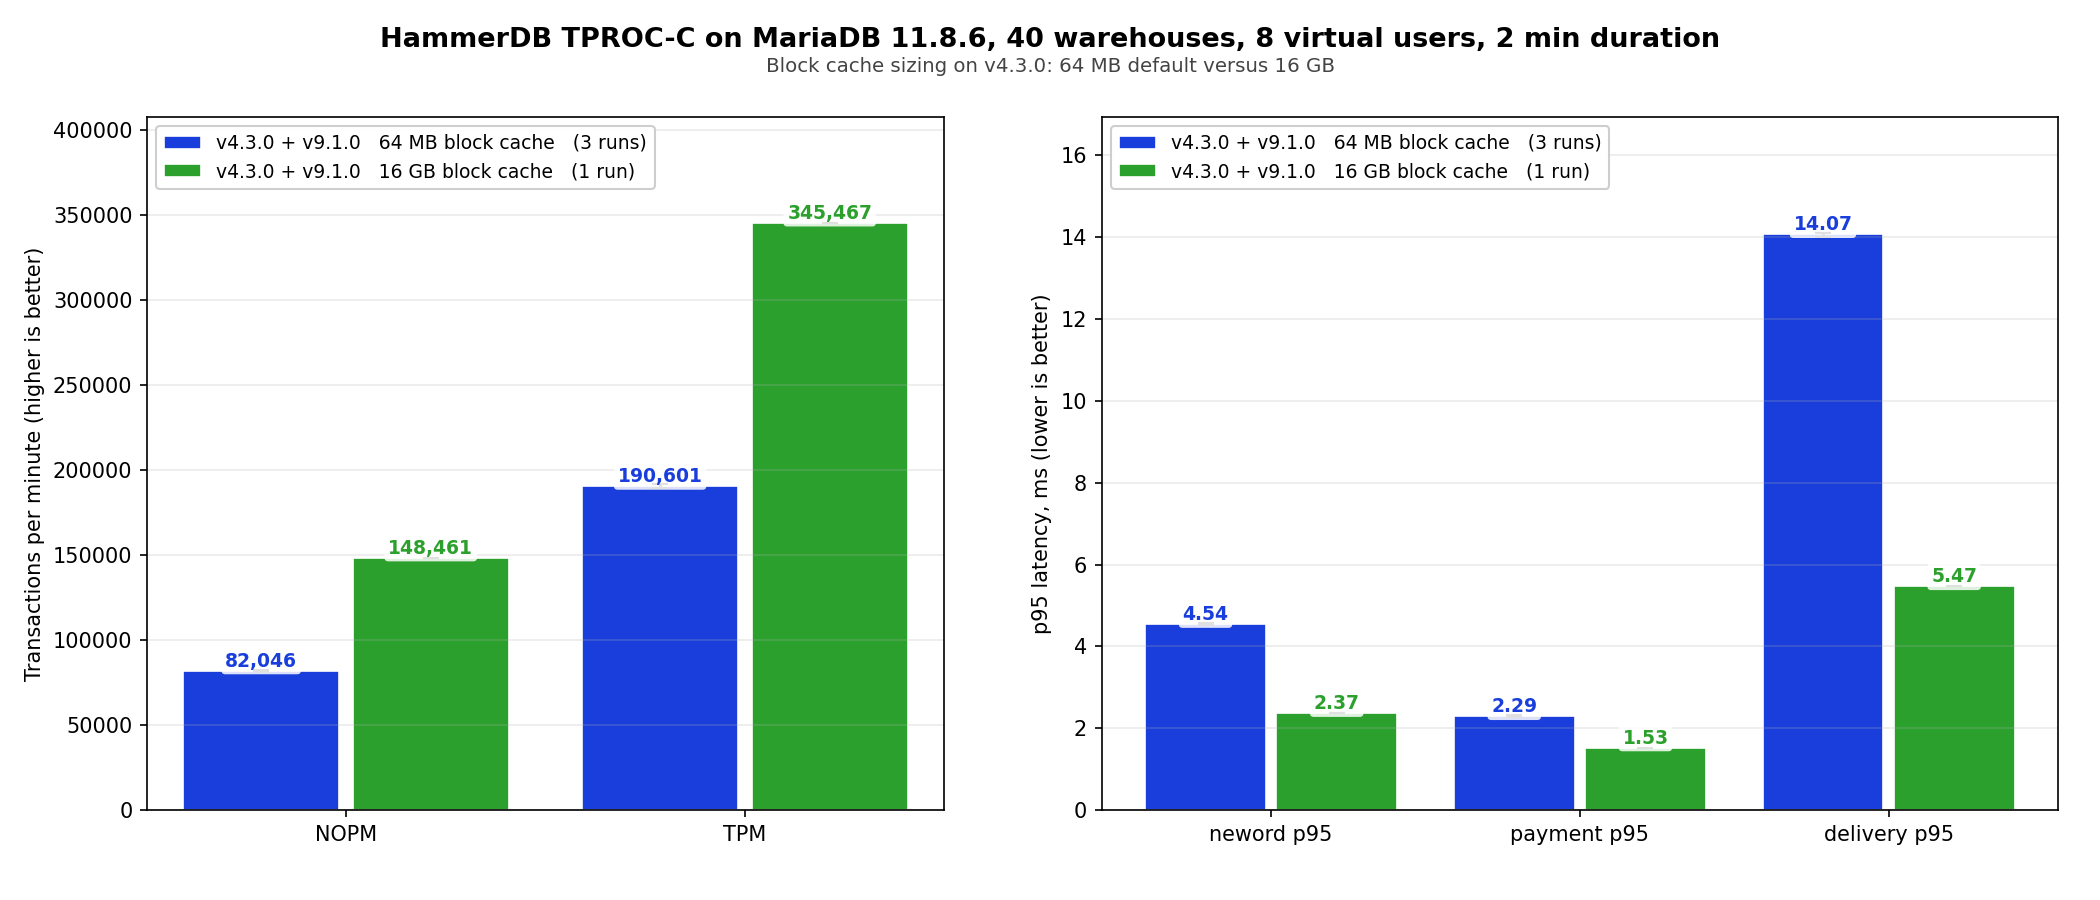
On TPROC-C at 40 warehouses and 8 virtual users, v4.3.0 averages 190,601 TPM and 82,046 NOPM versus v4.2.6’s 202,961 TPM and 78,811 NOPM, both at 64 MB block cache. The TPM delta is minus 6 percent and the NOPM delta is plus 4 percent, and v4.2.6’s own two run spread is wider (196 k to 210 k TPM, 73 k to 84 k NOPM) so the version difference falls inside the run to run variance of the baseline. The delete and batch work does not regress the general OLTP mix.
Bumping the block cache to 16 GB on v4.3.0 raises throughput from 190,601 to 345,467 TPM (1.81x) and cuts delivery p95 from 14.07 ms to 5.47 ms. That is cache sizing rather than version difference, but worth showing. If you have the resources these few configs are worth tuning,
tidesdb_default_l0_queue_stall_threshold     is set at 20 but you can bump it to 30 or 40 if you have enough memory to fit many immutable memtables.
tidesdb_default_use_btree                    if you want TidesDB to use less memory for internal klog indexing you can default to the btree klog layout which saves memory but uses more disk.
tidesdb_unified_memtable_write_buffer_size   defaults to 128M shared across every column family.  Increasing allows for more writes across TidesDB tables and indexes before a memtable becomes immutable and queued.
tidesdb_unified_memtable_sync_mode           defaults to FULL though you can set to INTERVAL if you want to trade some durability for better performance.
tidesdb_flush_threads                        defaults to 4 but you can increase if you have a lot of tables
tidesdb_compaction_threads                   defaults to 4 but you can increase if you have a lot of tables
tidesdb_block_cache_size                     defaults to 256 M and as shown above increasing it directly improves performance.
That’s all for now, thank you for reading!
—
You can find raw data for this analysis below
| Name | Cache Size | SHA256 |
|---|---|---|
| hammerdb_results_20260423_181701.csv (prev article) | small cache | f1f40449707bb140bd57d2d6a06f225ed29edec6bf1893f0c7dfec5c4205d1d5 |
| hammerdb_results_20260423_182443.csv (prev article) | small cache | af184c1b974cd82226b8c39b2831e9e7caf1a716e2e0cc50f0519497ecaf4b1b |
| hammerdb_results_20260424_180146.csv (this article) | small cache | cb4acaae81d5da3e8c5564203d7308662b043489e30fa00729710b60ce808232 |
| hammerdb_results_20260424_181053.csv (this article) | small cache | c440b3d45a3e4d17afc42f976d78ff4793d20861d321ac51cc1374e85c92c3ad |
| hammerdb_results_20260424_193644.csv (this article) | small cache | 4ef473f3b26bf1fdf8ce19b3bd38bc61632e06d4111ddd2454f60af2a47fe1dc |
| hammerdb_results_20260424_181939.csv (this article) | large cache | 4df6160336eba67d18c3561ae841d3ca30e26b9e34908e510e3d123ae50d0ab3 |
All raw data logs can be found here (0e4481e92510c8ab5da81378c59a14e13ff1f443427030b83205e610f7717c84)