TidesDB v7.3.1 vs RocksDB v10.9.1 Performance Benchmark

published on January 21st, 2026
The latest patch of TidesDB (v7.3.1) improves latency consistency and overall performance across several core subsystems, with measurable gains across a range of workloads compared to earlier releases.
You can find the complete benchmark report below in 2 formats:
You can find the source for the benchtool here.
Test environment:
- Intel i7-11700K (16 cores), 46GB RAM, Linux 6.2.0, sync disabled, Western Digital 500GB WD Blue 3D NAND Internal PC SSD (SATA)
Engine Comparison
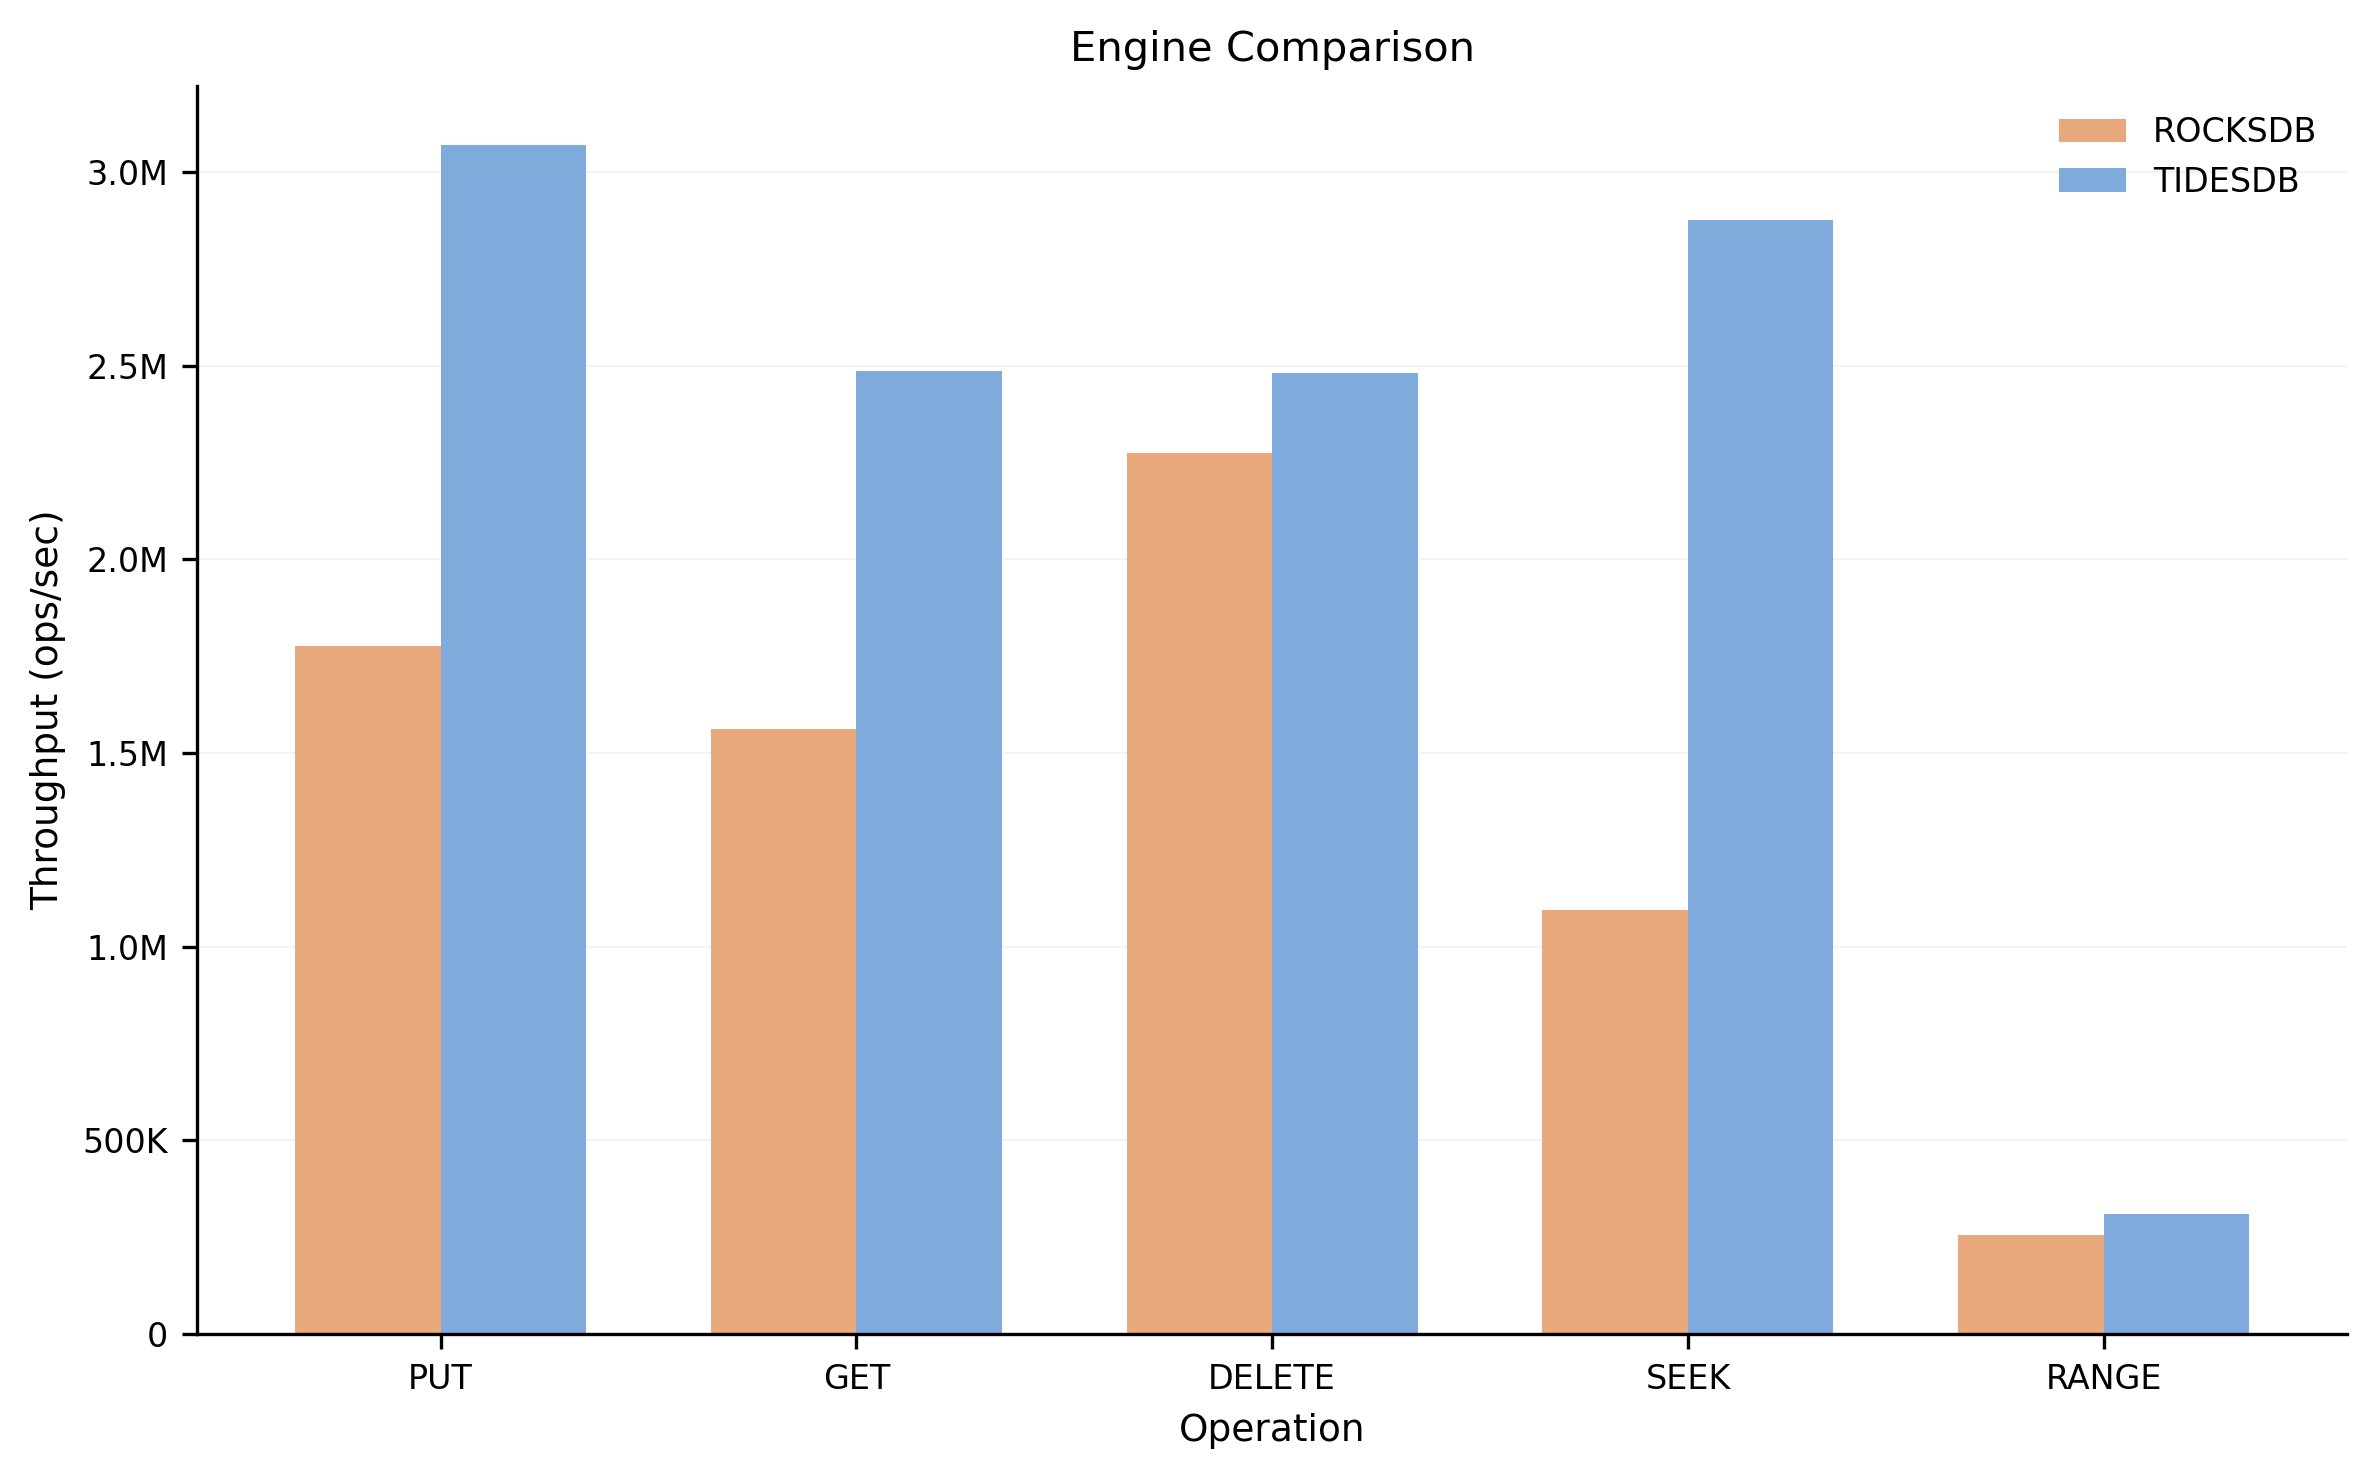
This chart shows the average throughput (operations per second) for each operation type. TidesDB outperforms RocksDB across all operations, with the most significant gains in PUT and SEEK operations.
Throughput Overview
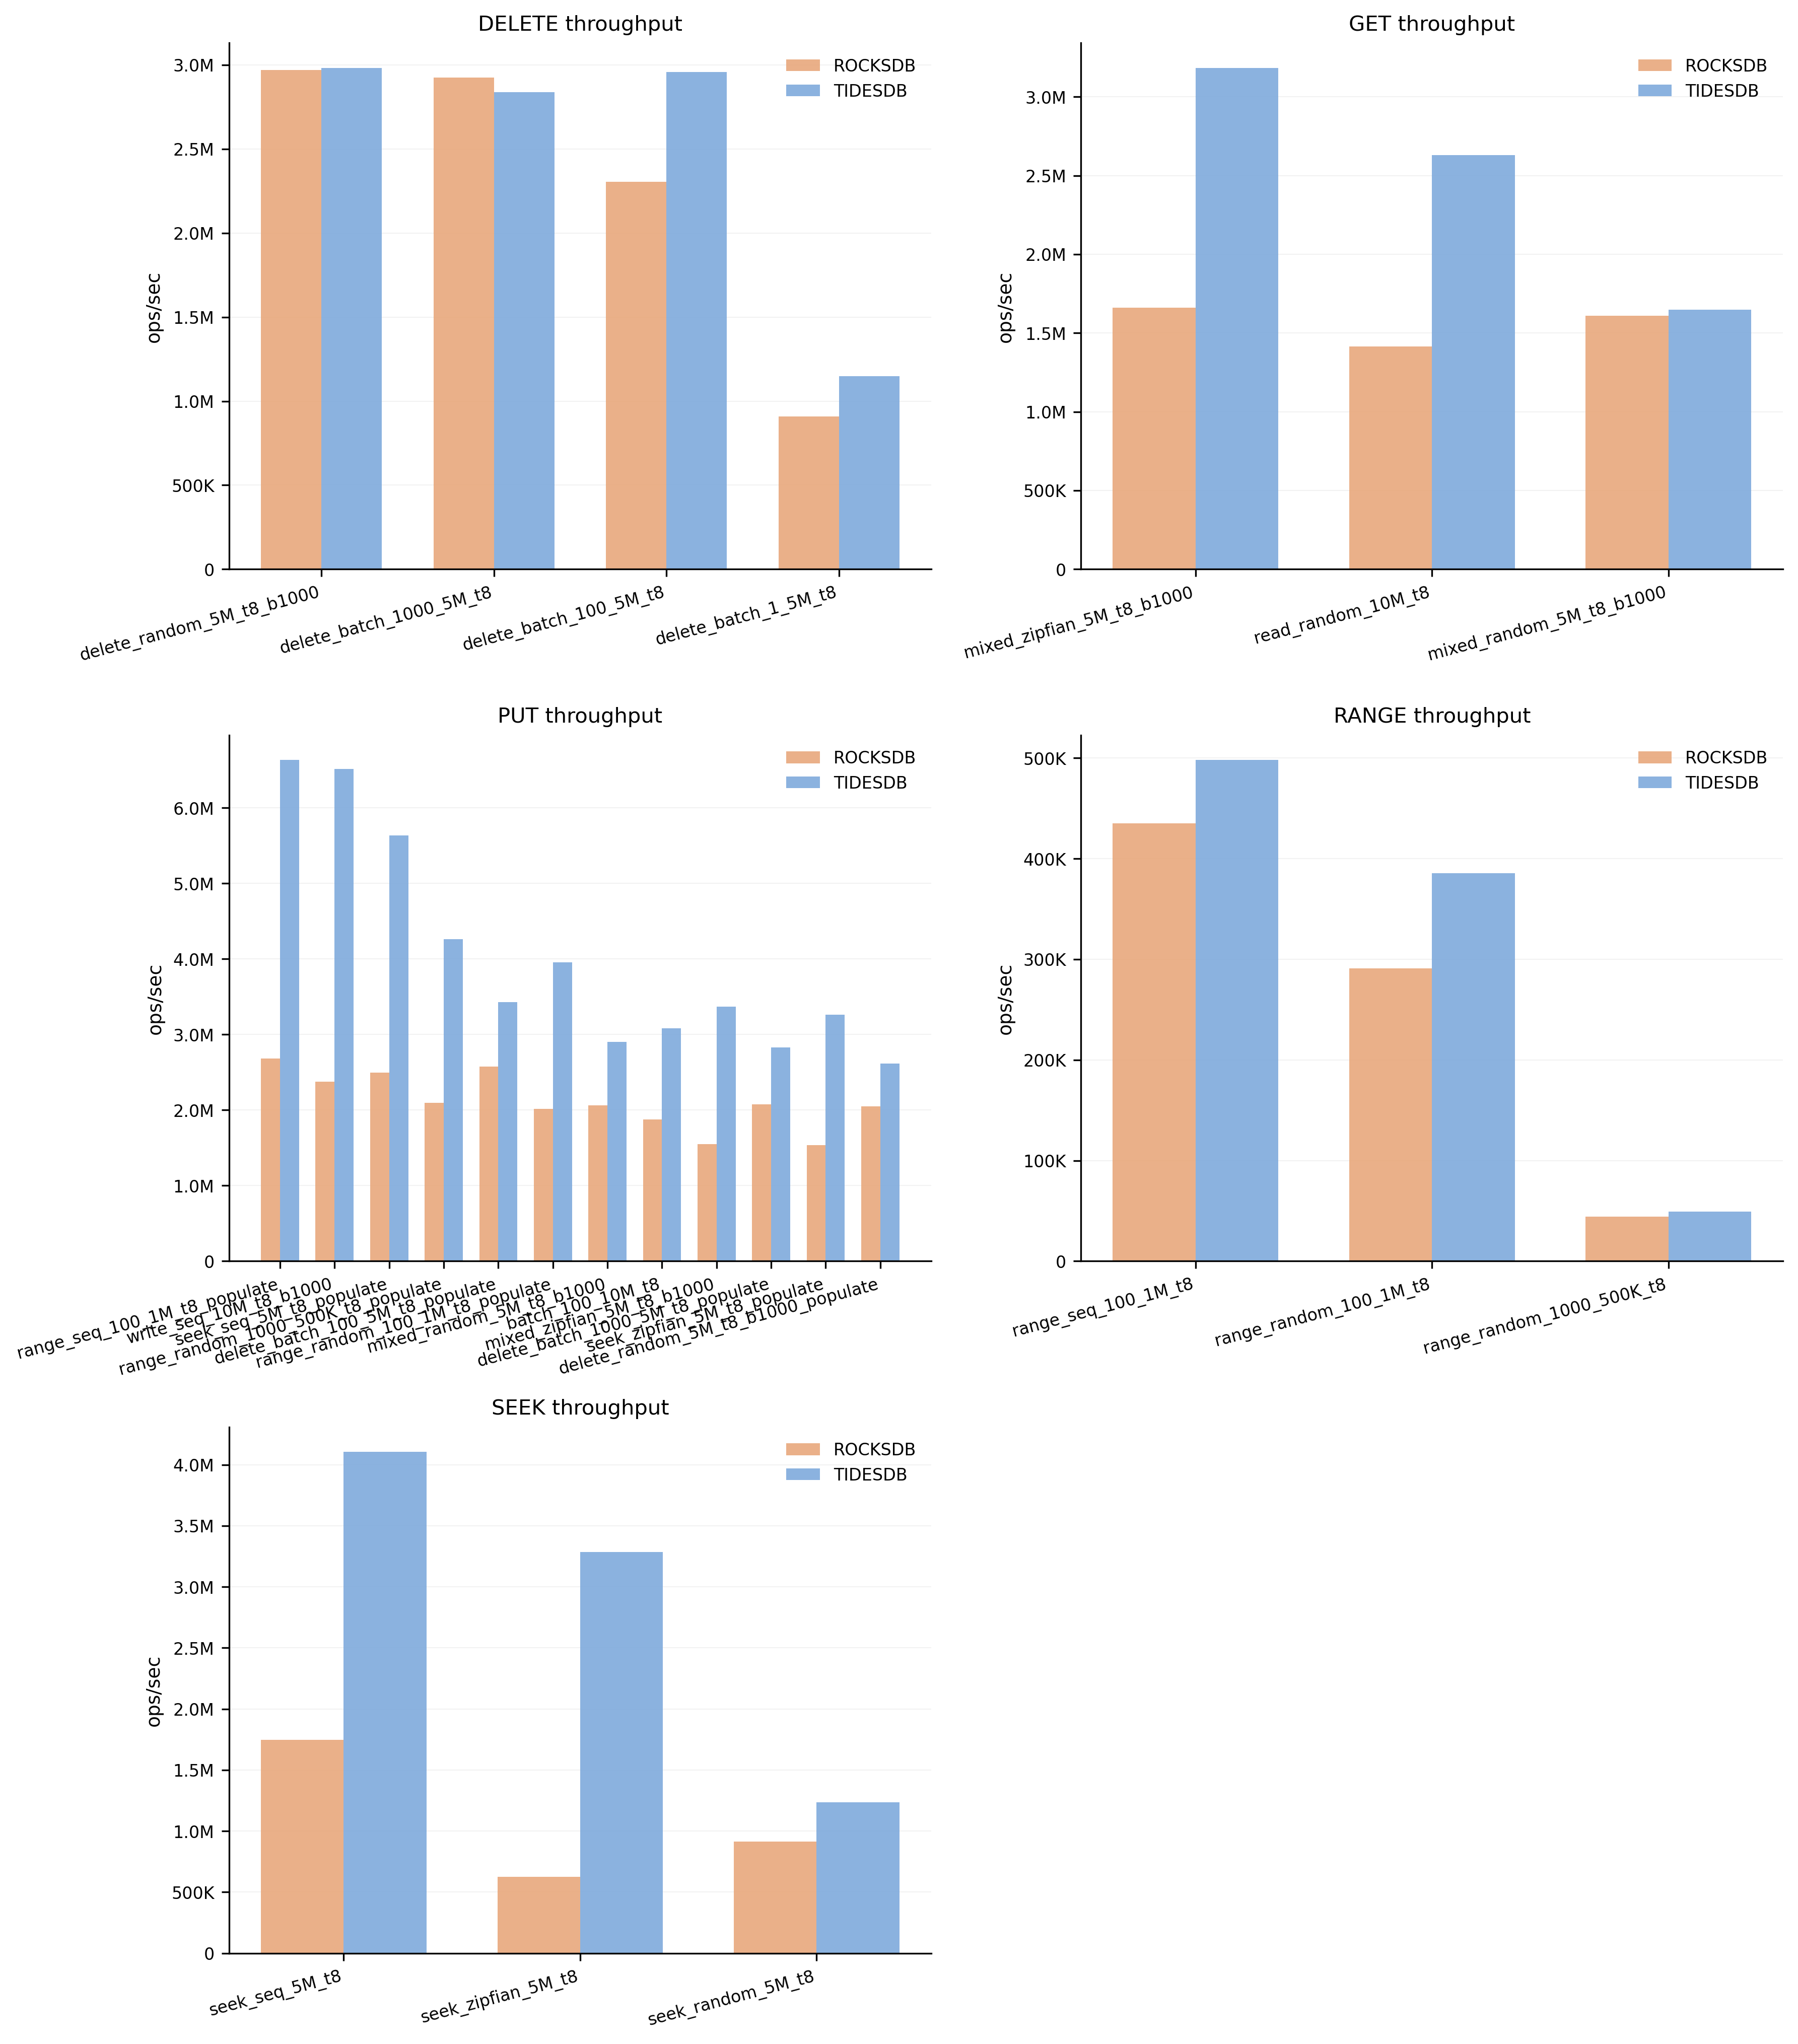
A detailed breakdown of throughput across individual test configurations. Each test varies parameters like batch size, key pattern, and value size. TidesDB consistently achieves higher throughput across the majority of test scenarios.
Operation Mix
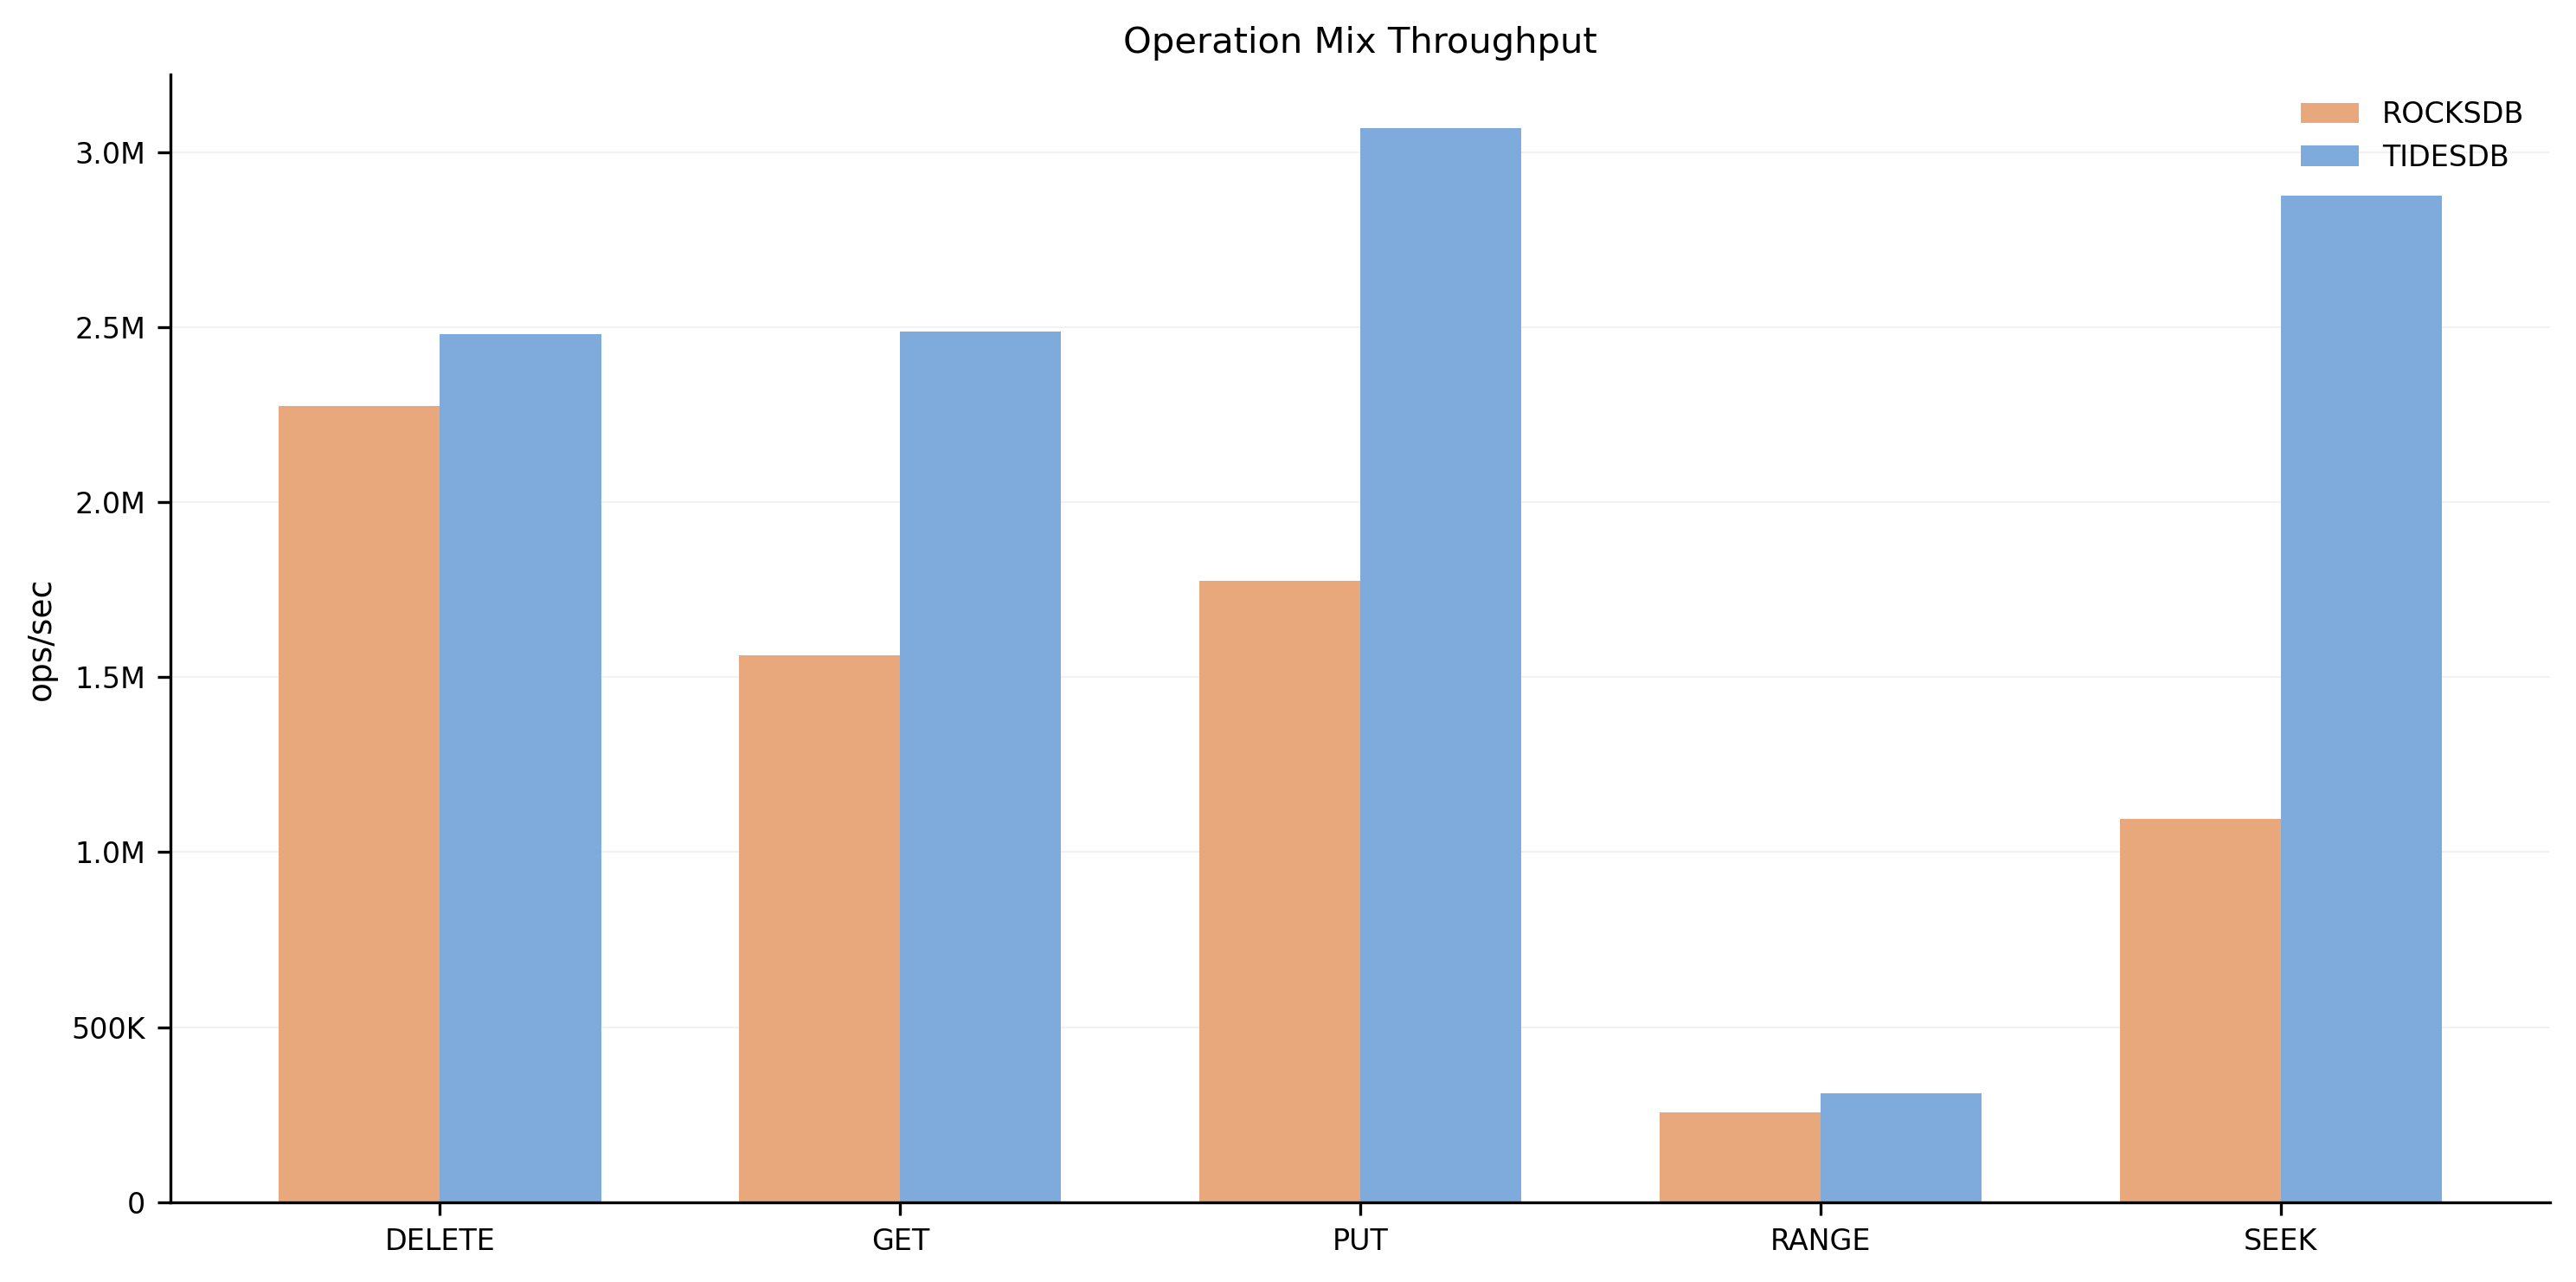
Aggregate throughput by operation type. TidesDB shows strong performance in DELETE, GET, PUT, RANGE, and SEEK operations.
Latency Overview
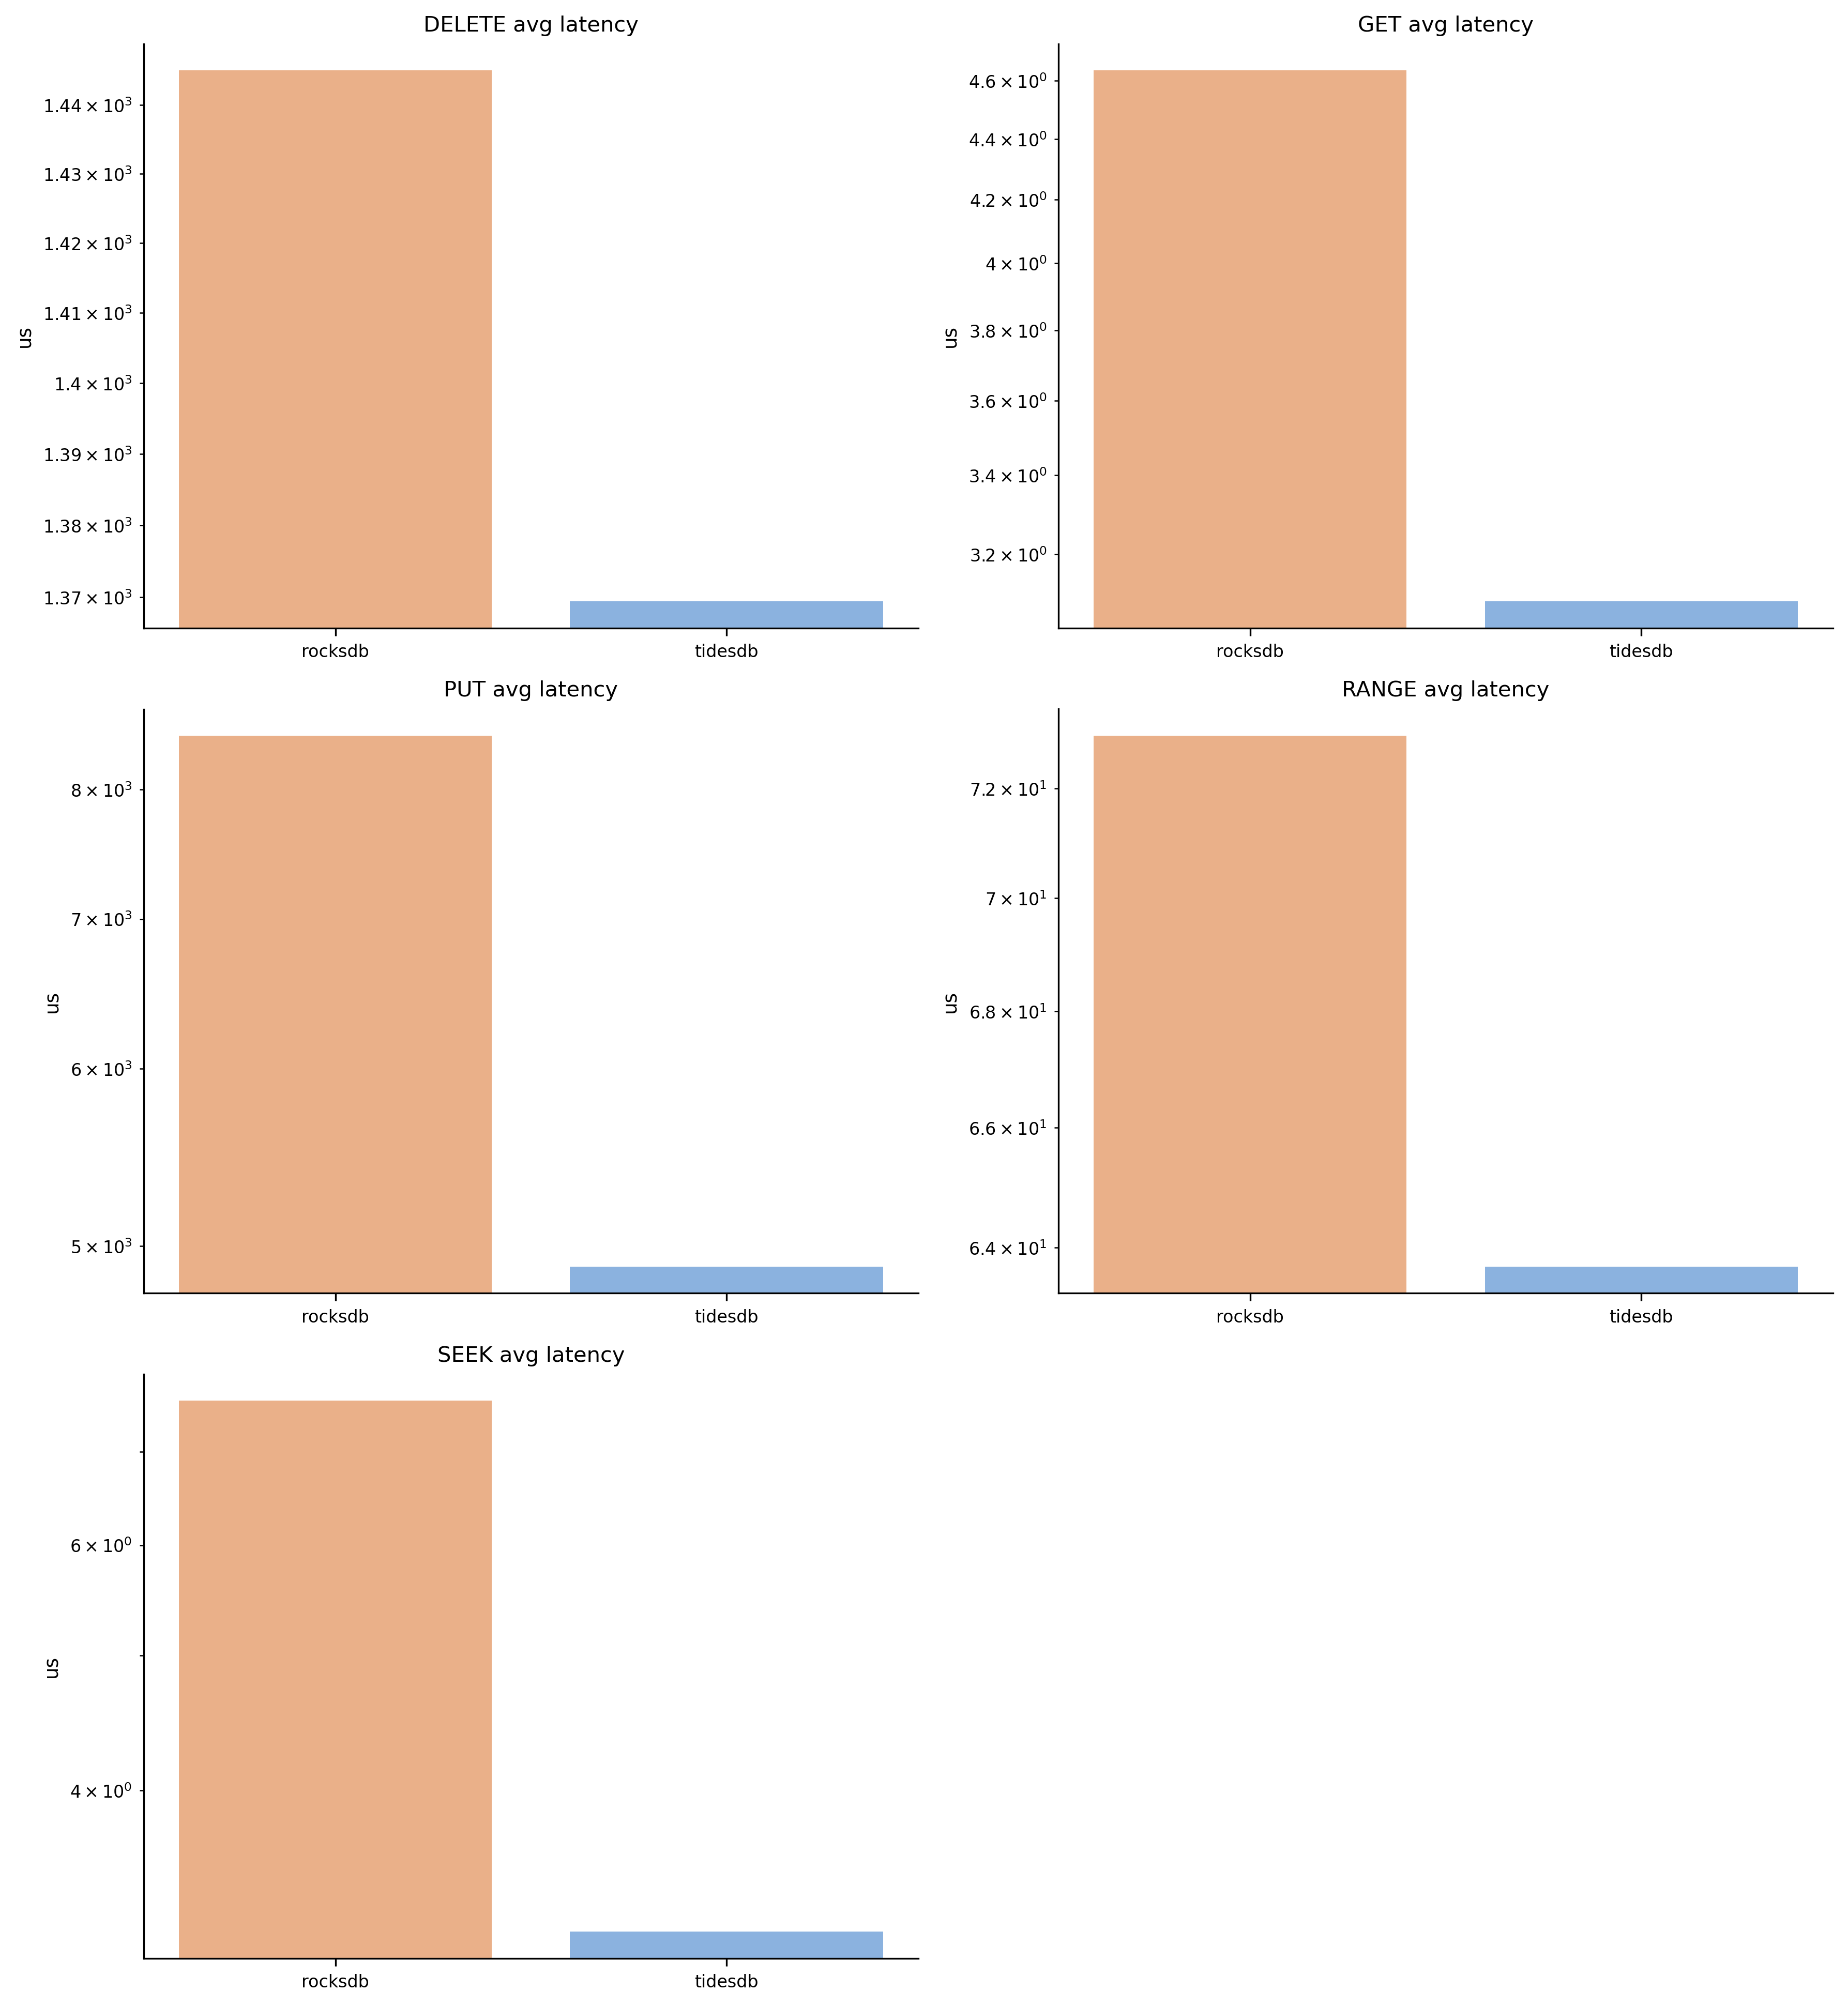
Average latency (in microseconds) for each operation type. Lower is better. TidesDB demonstrates lower average latency across most operations, particularly in PUT and SEEK workloads.
Latency Percentiles
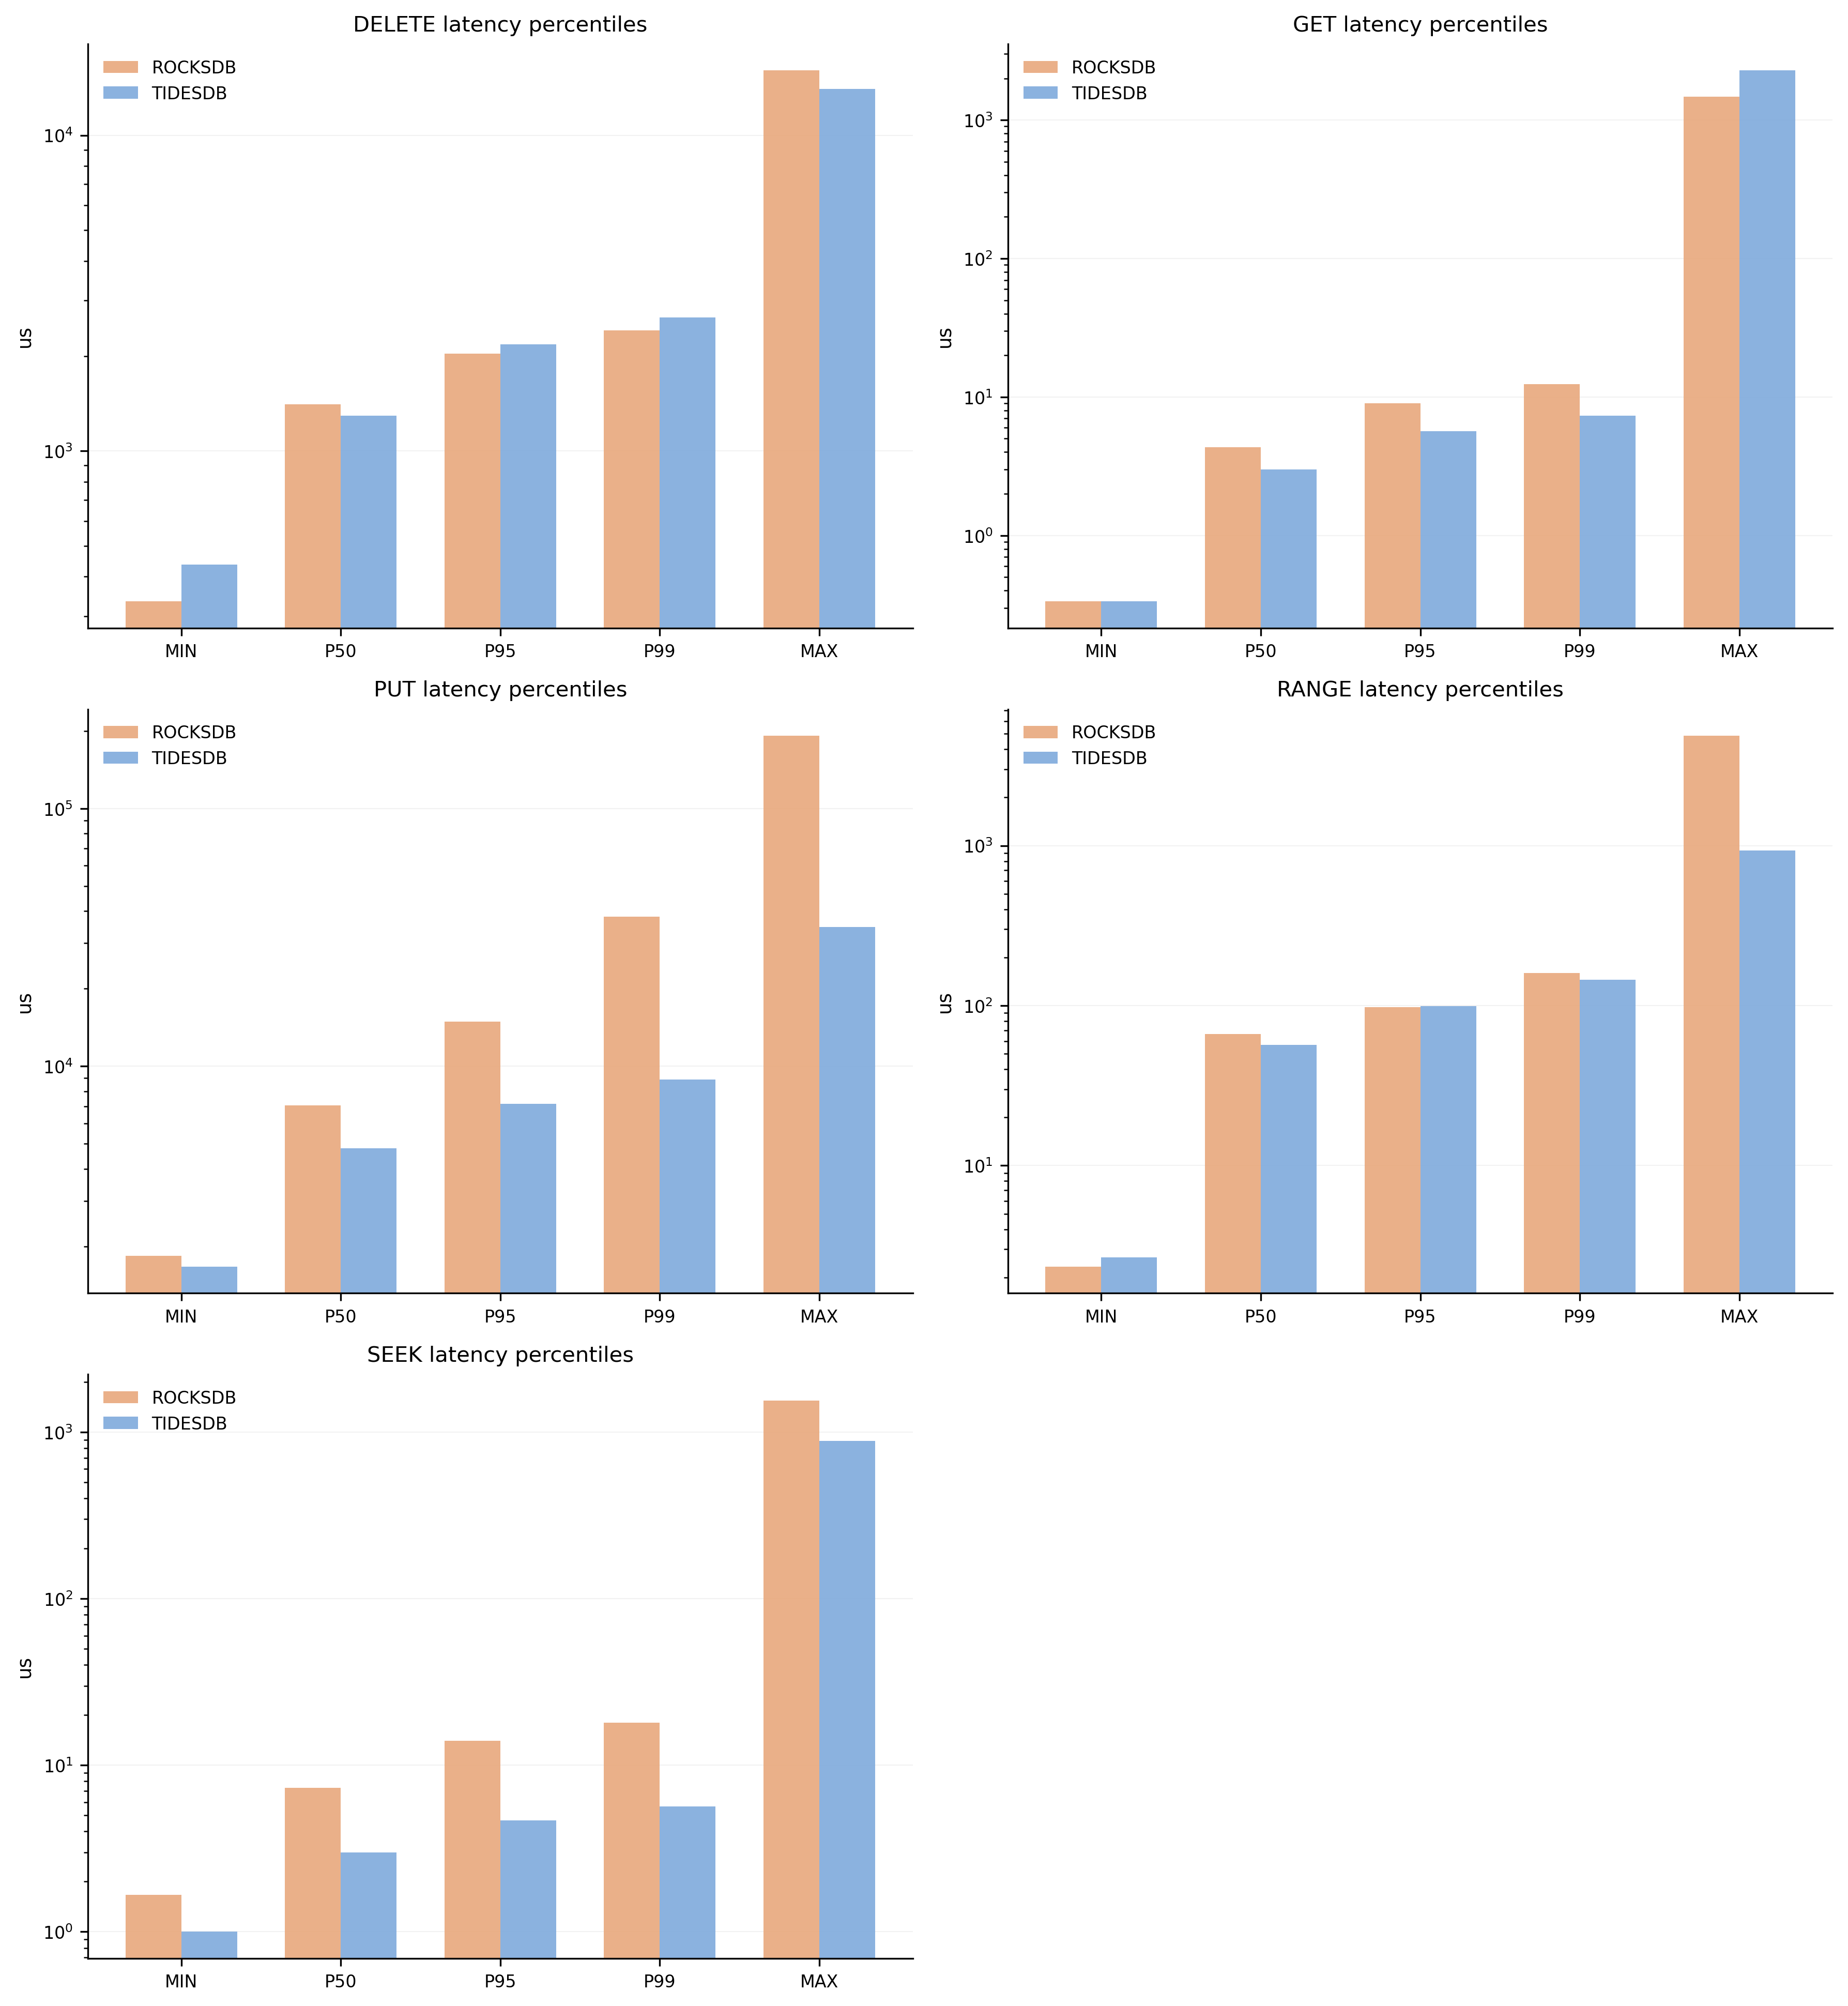
Latency distribution showing min, p50, p95, p99, and max latencies. TidesDB shows tighter latency distributions with lower tail latencies, indicating more predictable performance.
Latency Variability (CV%)
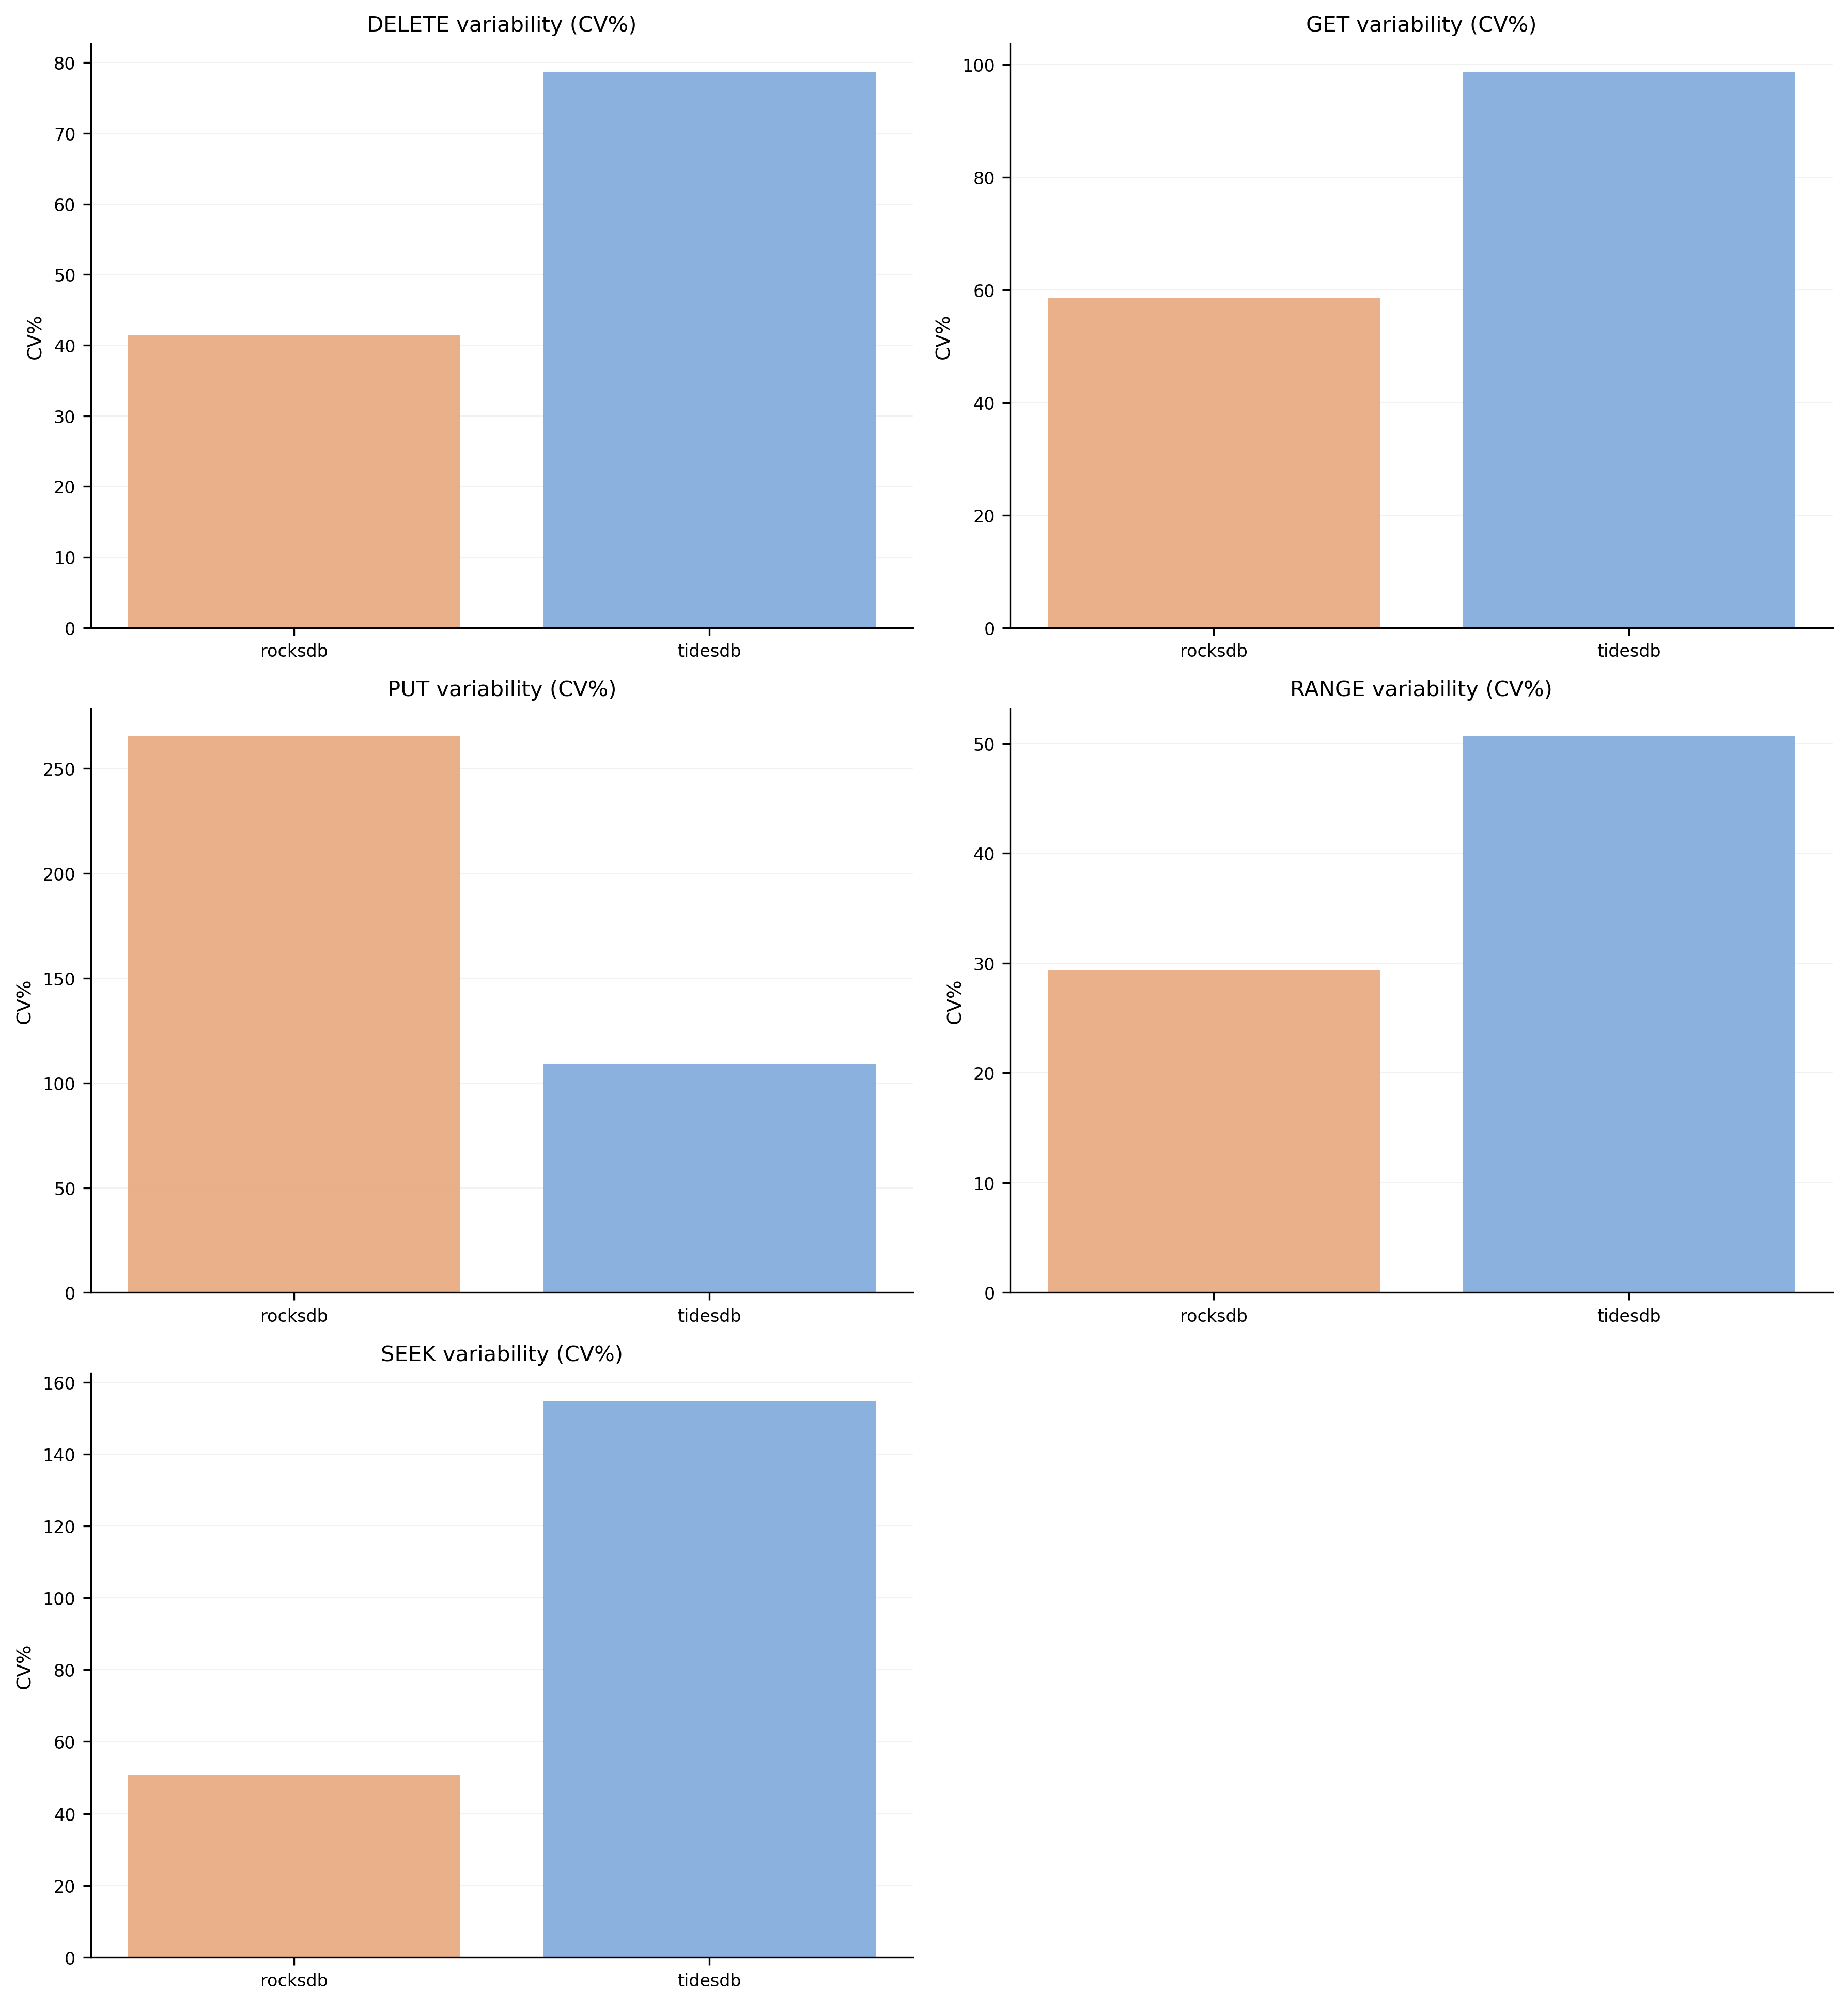
Coefficient of Variation (CV%) measures latency consistency. Lower CV% means more consistent performance. Note that average CV values in this benchmark are higher than typical because this suite aggregates results across many different test configurations (batch sizes from 1 to 10,000, different key patterns, value sizes, etc.). The high throughput achieved by TidesDB, especially at smaller batch sizes, can contribute to higher relative variance. RocksDB shows notably higher CV on PUT operations due to background compaction causing latency spikes.
Latency Standard Deviation
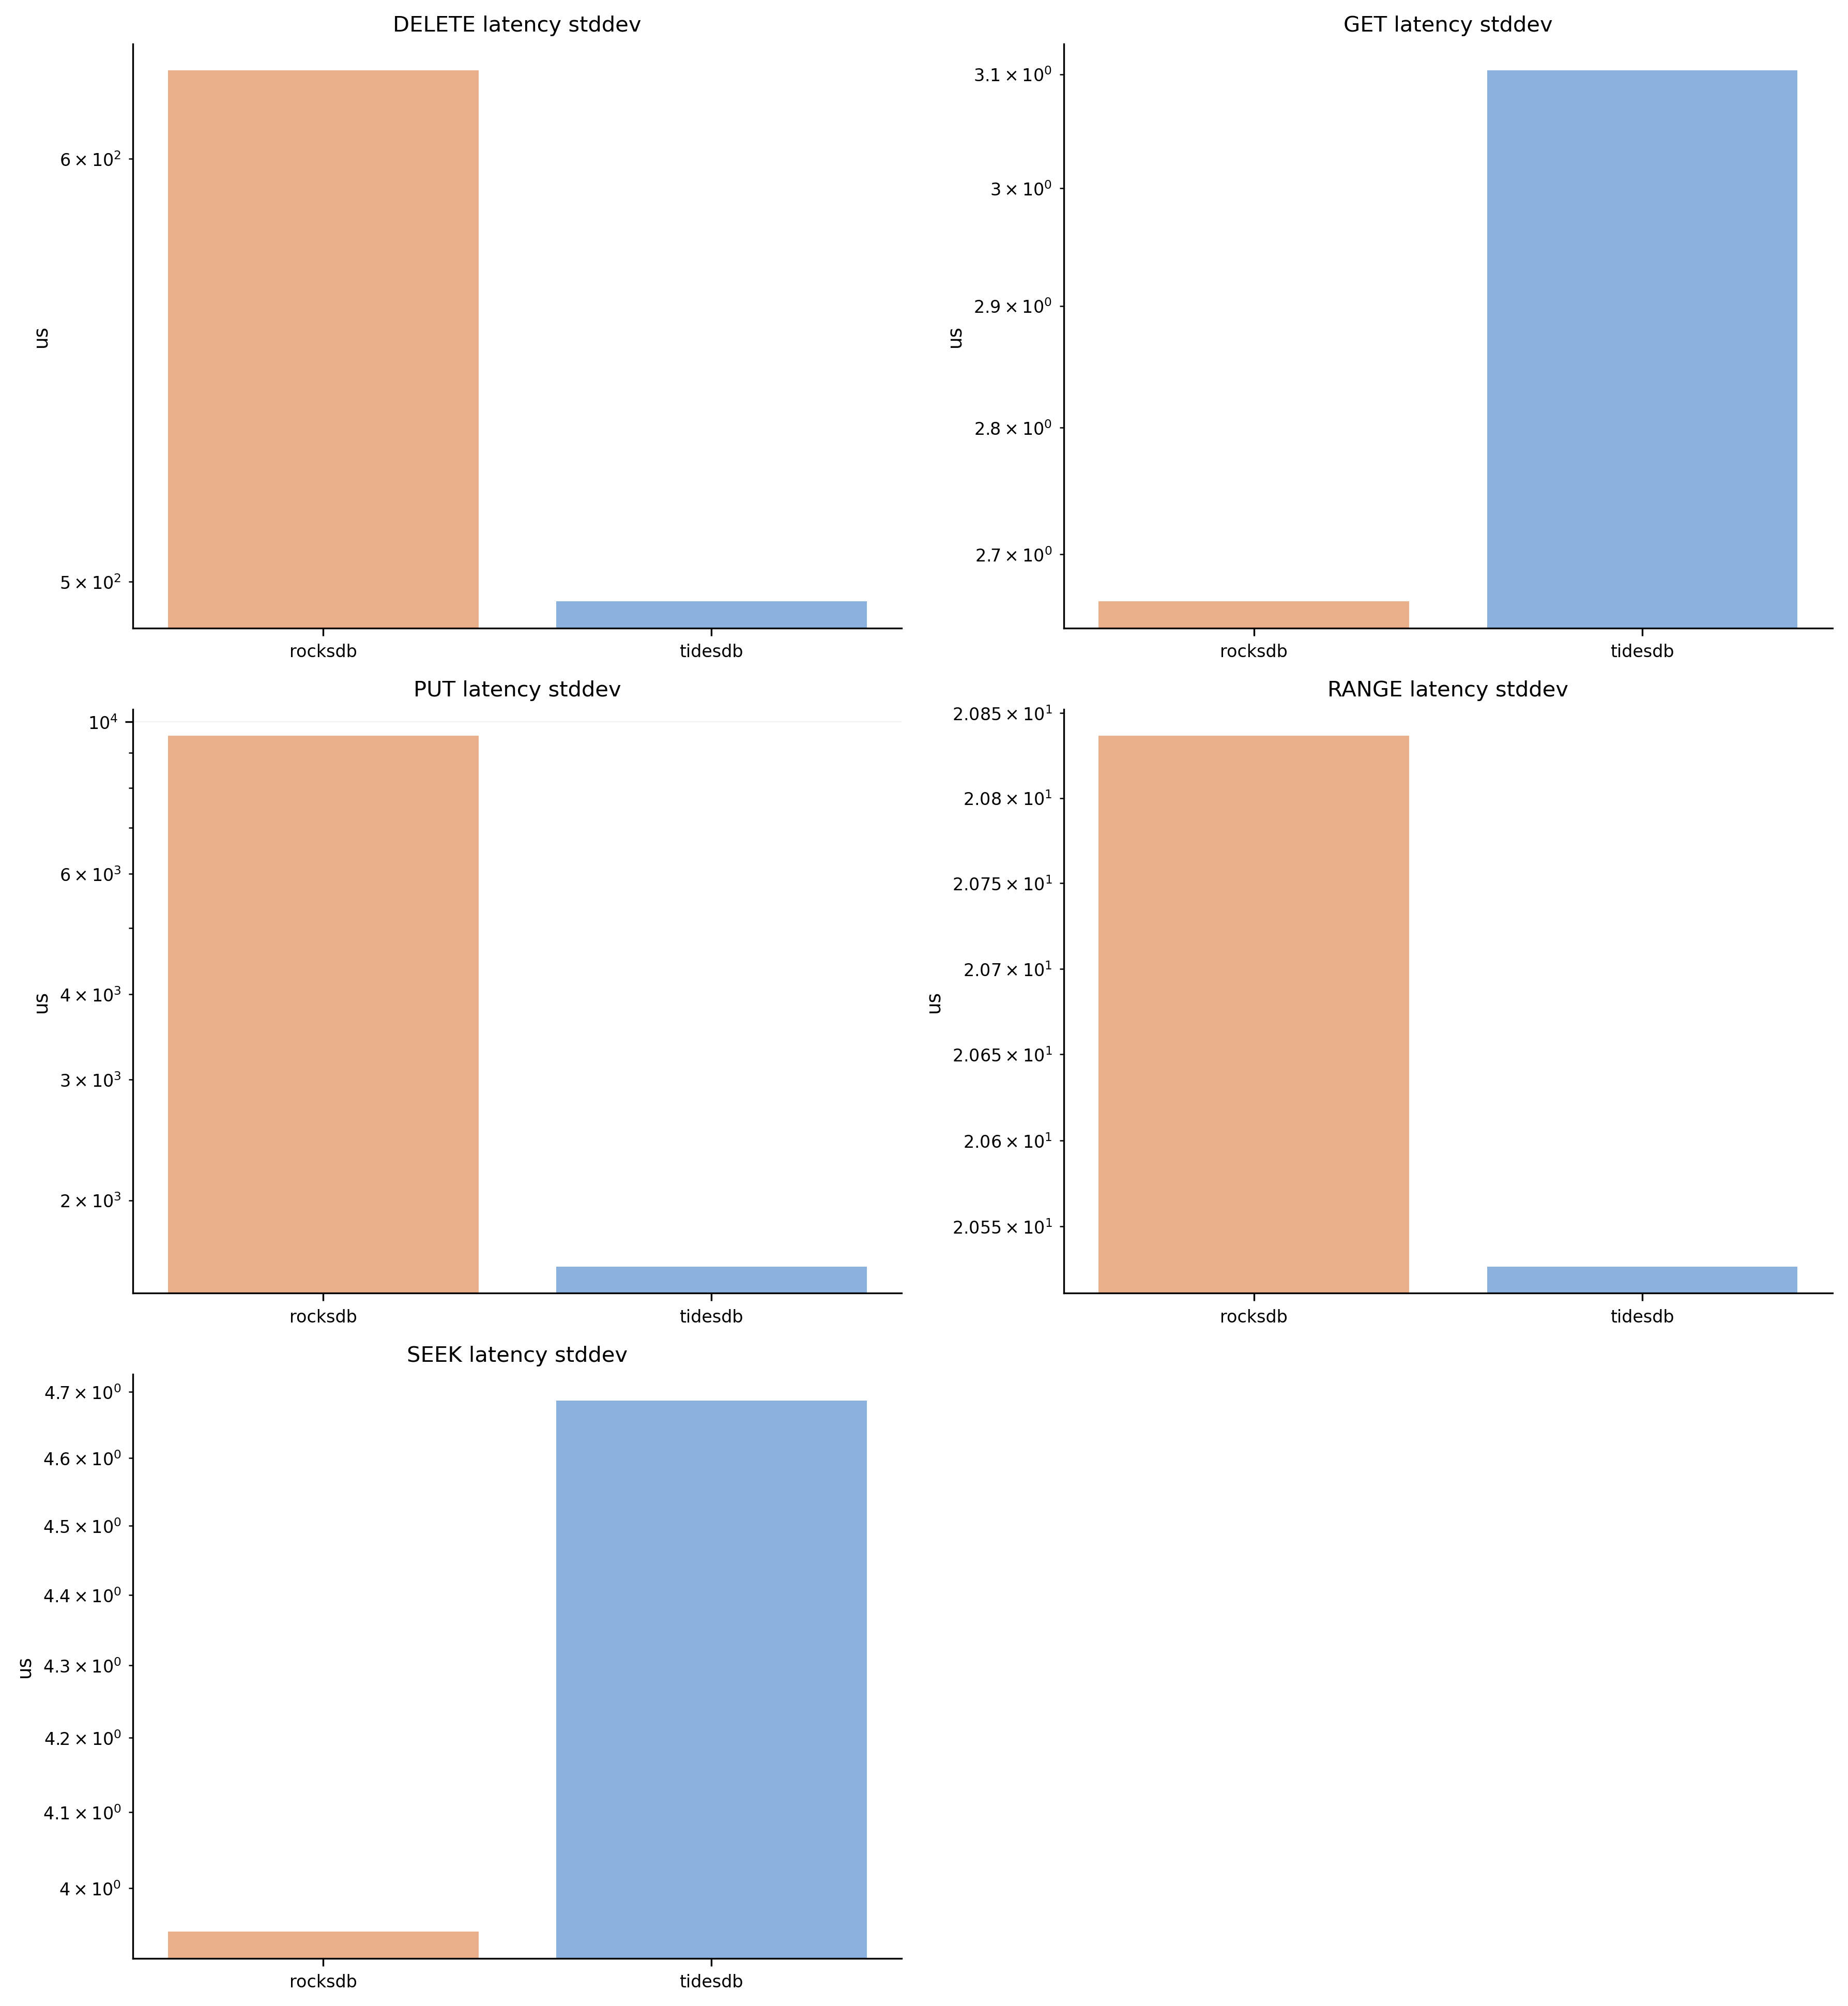
Standard deviation of latency in microseconds. Lower values indicate more consistent response times. TidesDB maintains lower standard deviation in most workloads.
Workload Comparison
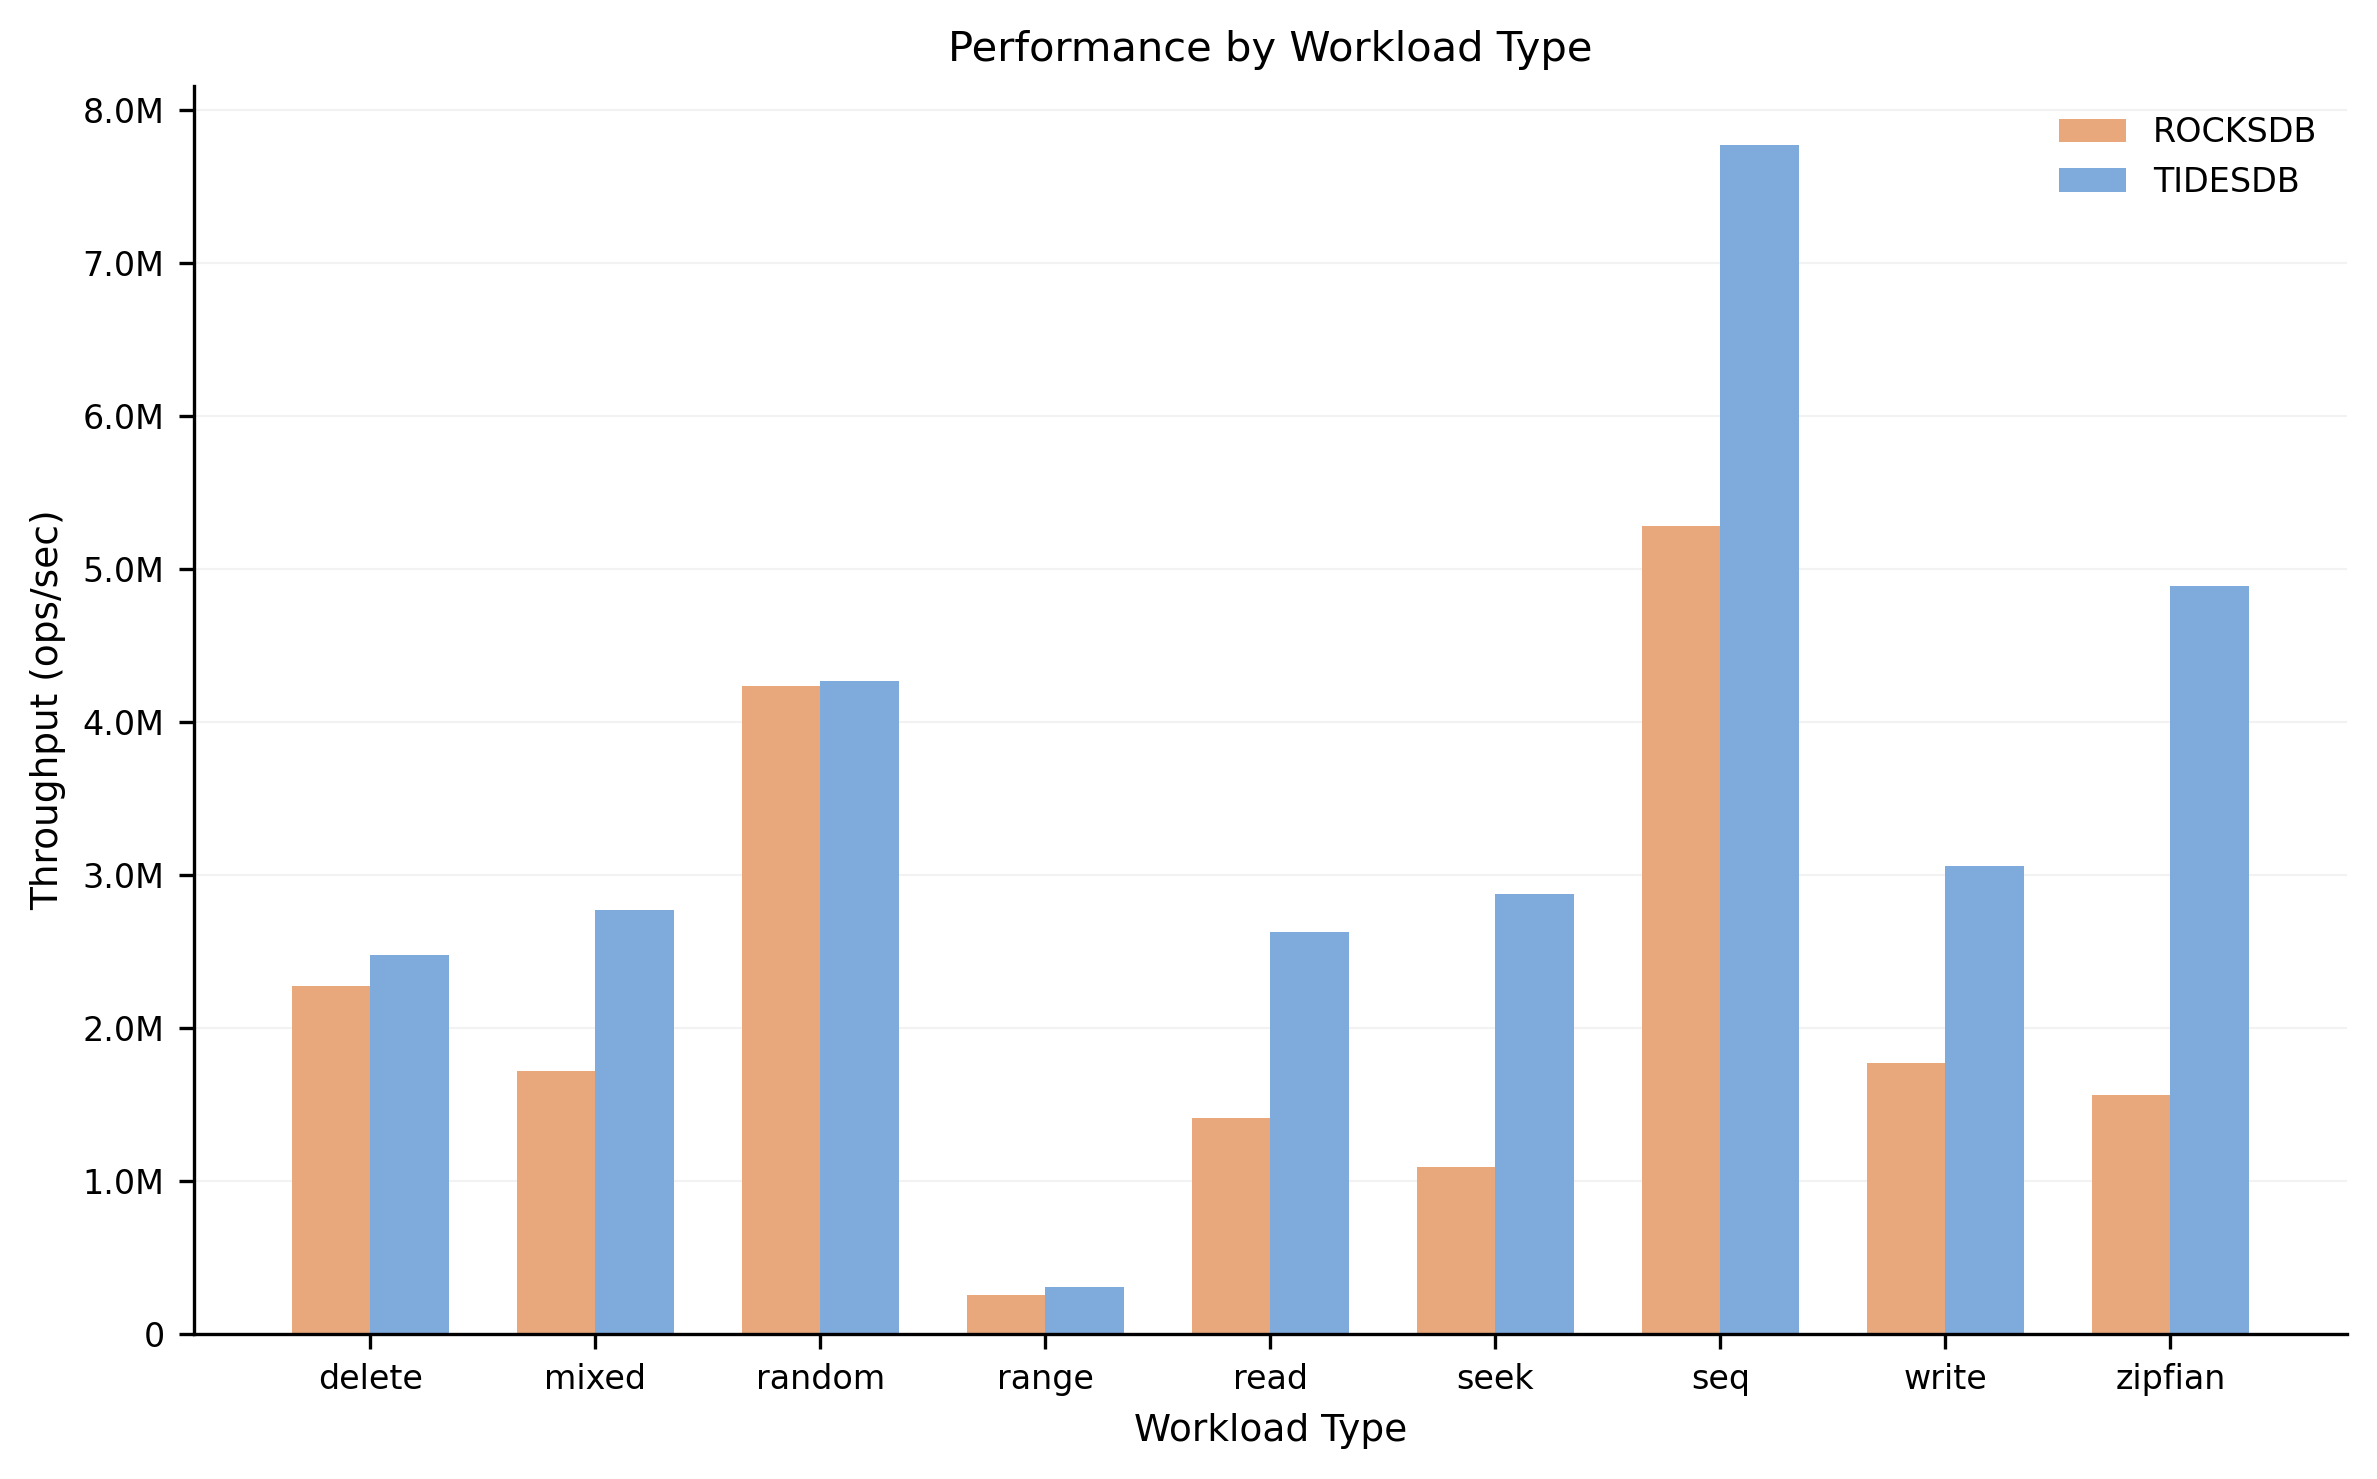
Performance comparison across different workload types delete, mixed, range, read, seek, and write. TidesDB leads in all workload categories.
Key Pattern Comparison

PUT throughput across different key patterns (random, sequential, zipfian). TidesDB shows strong performance across all access patterns.

GET throughput by key pattern. Both engines perform similarly on random reads, with TidesDB having a slight edge.
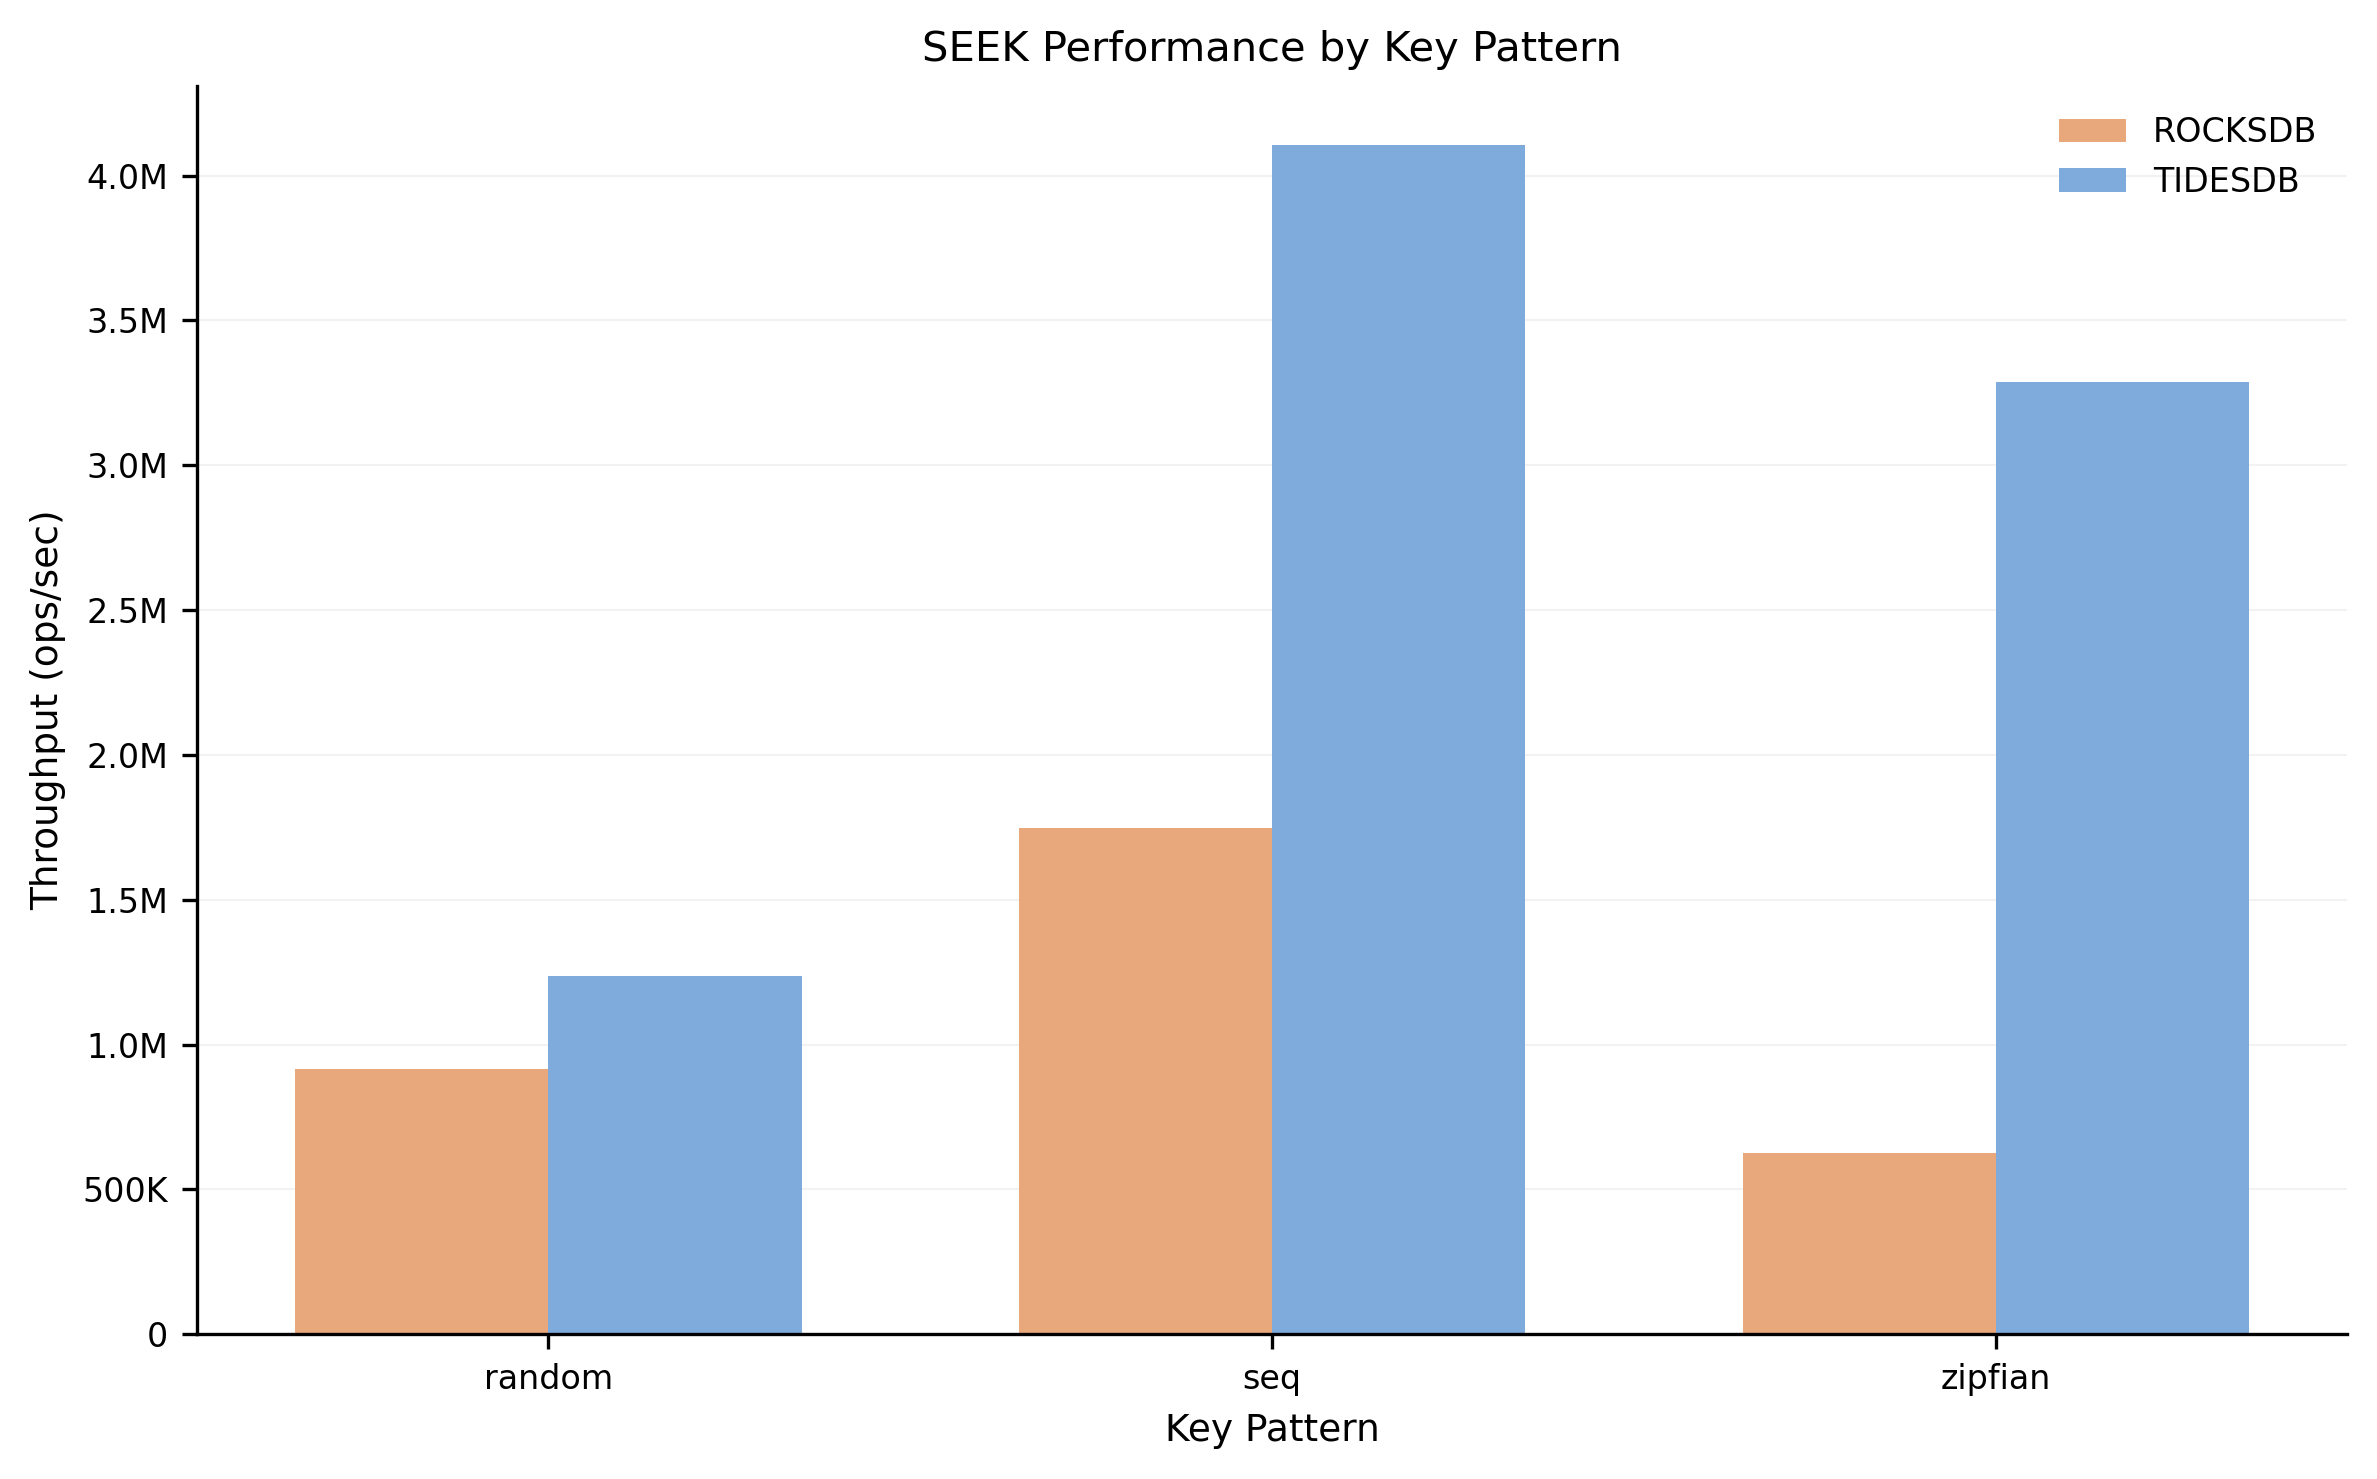
SEEK throughput by key pattern. TidesDB significantly outperforms RocksDB, especially on sequential and zipfian patterns.
Batch Size Impact
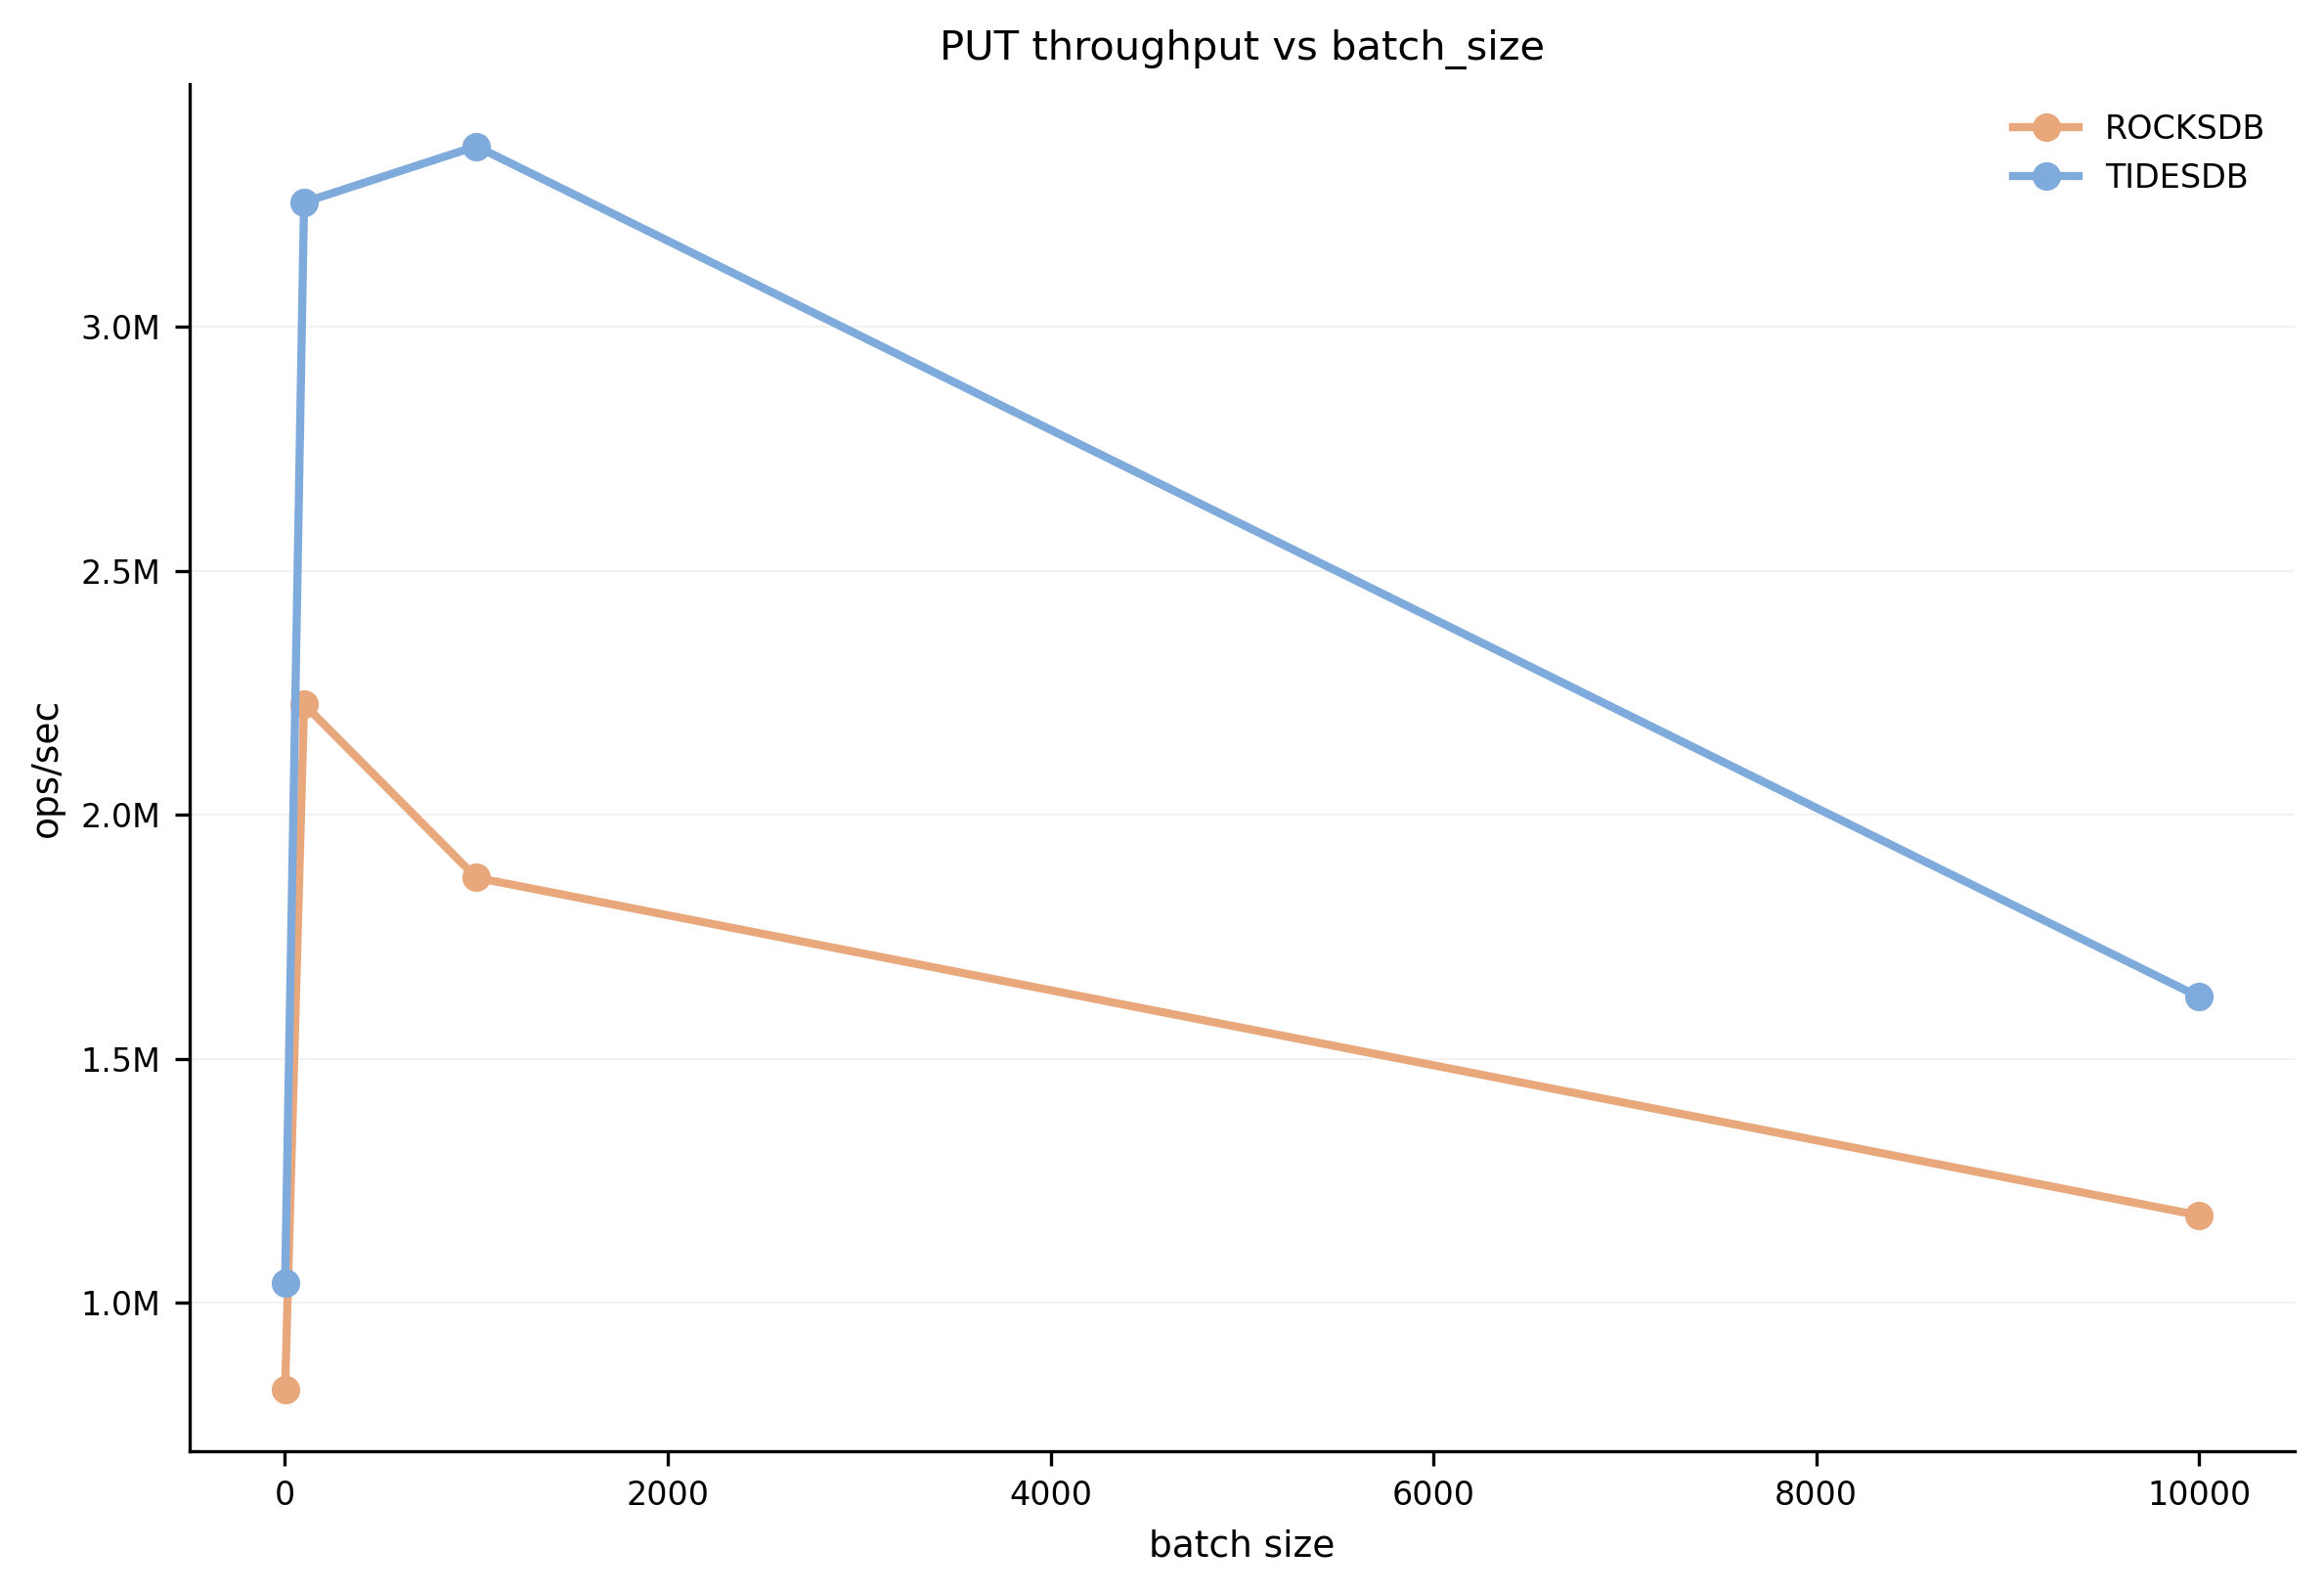
How batch size affects PUT throughput. Both engines benefit from batching, with TidesDB maintaining higher throughput across all batch sizes.
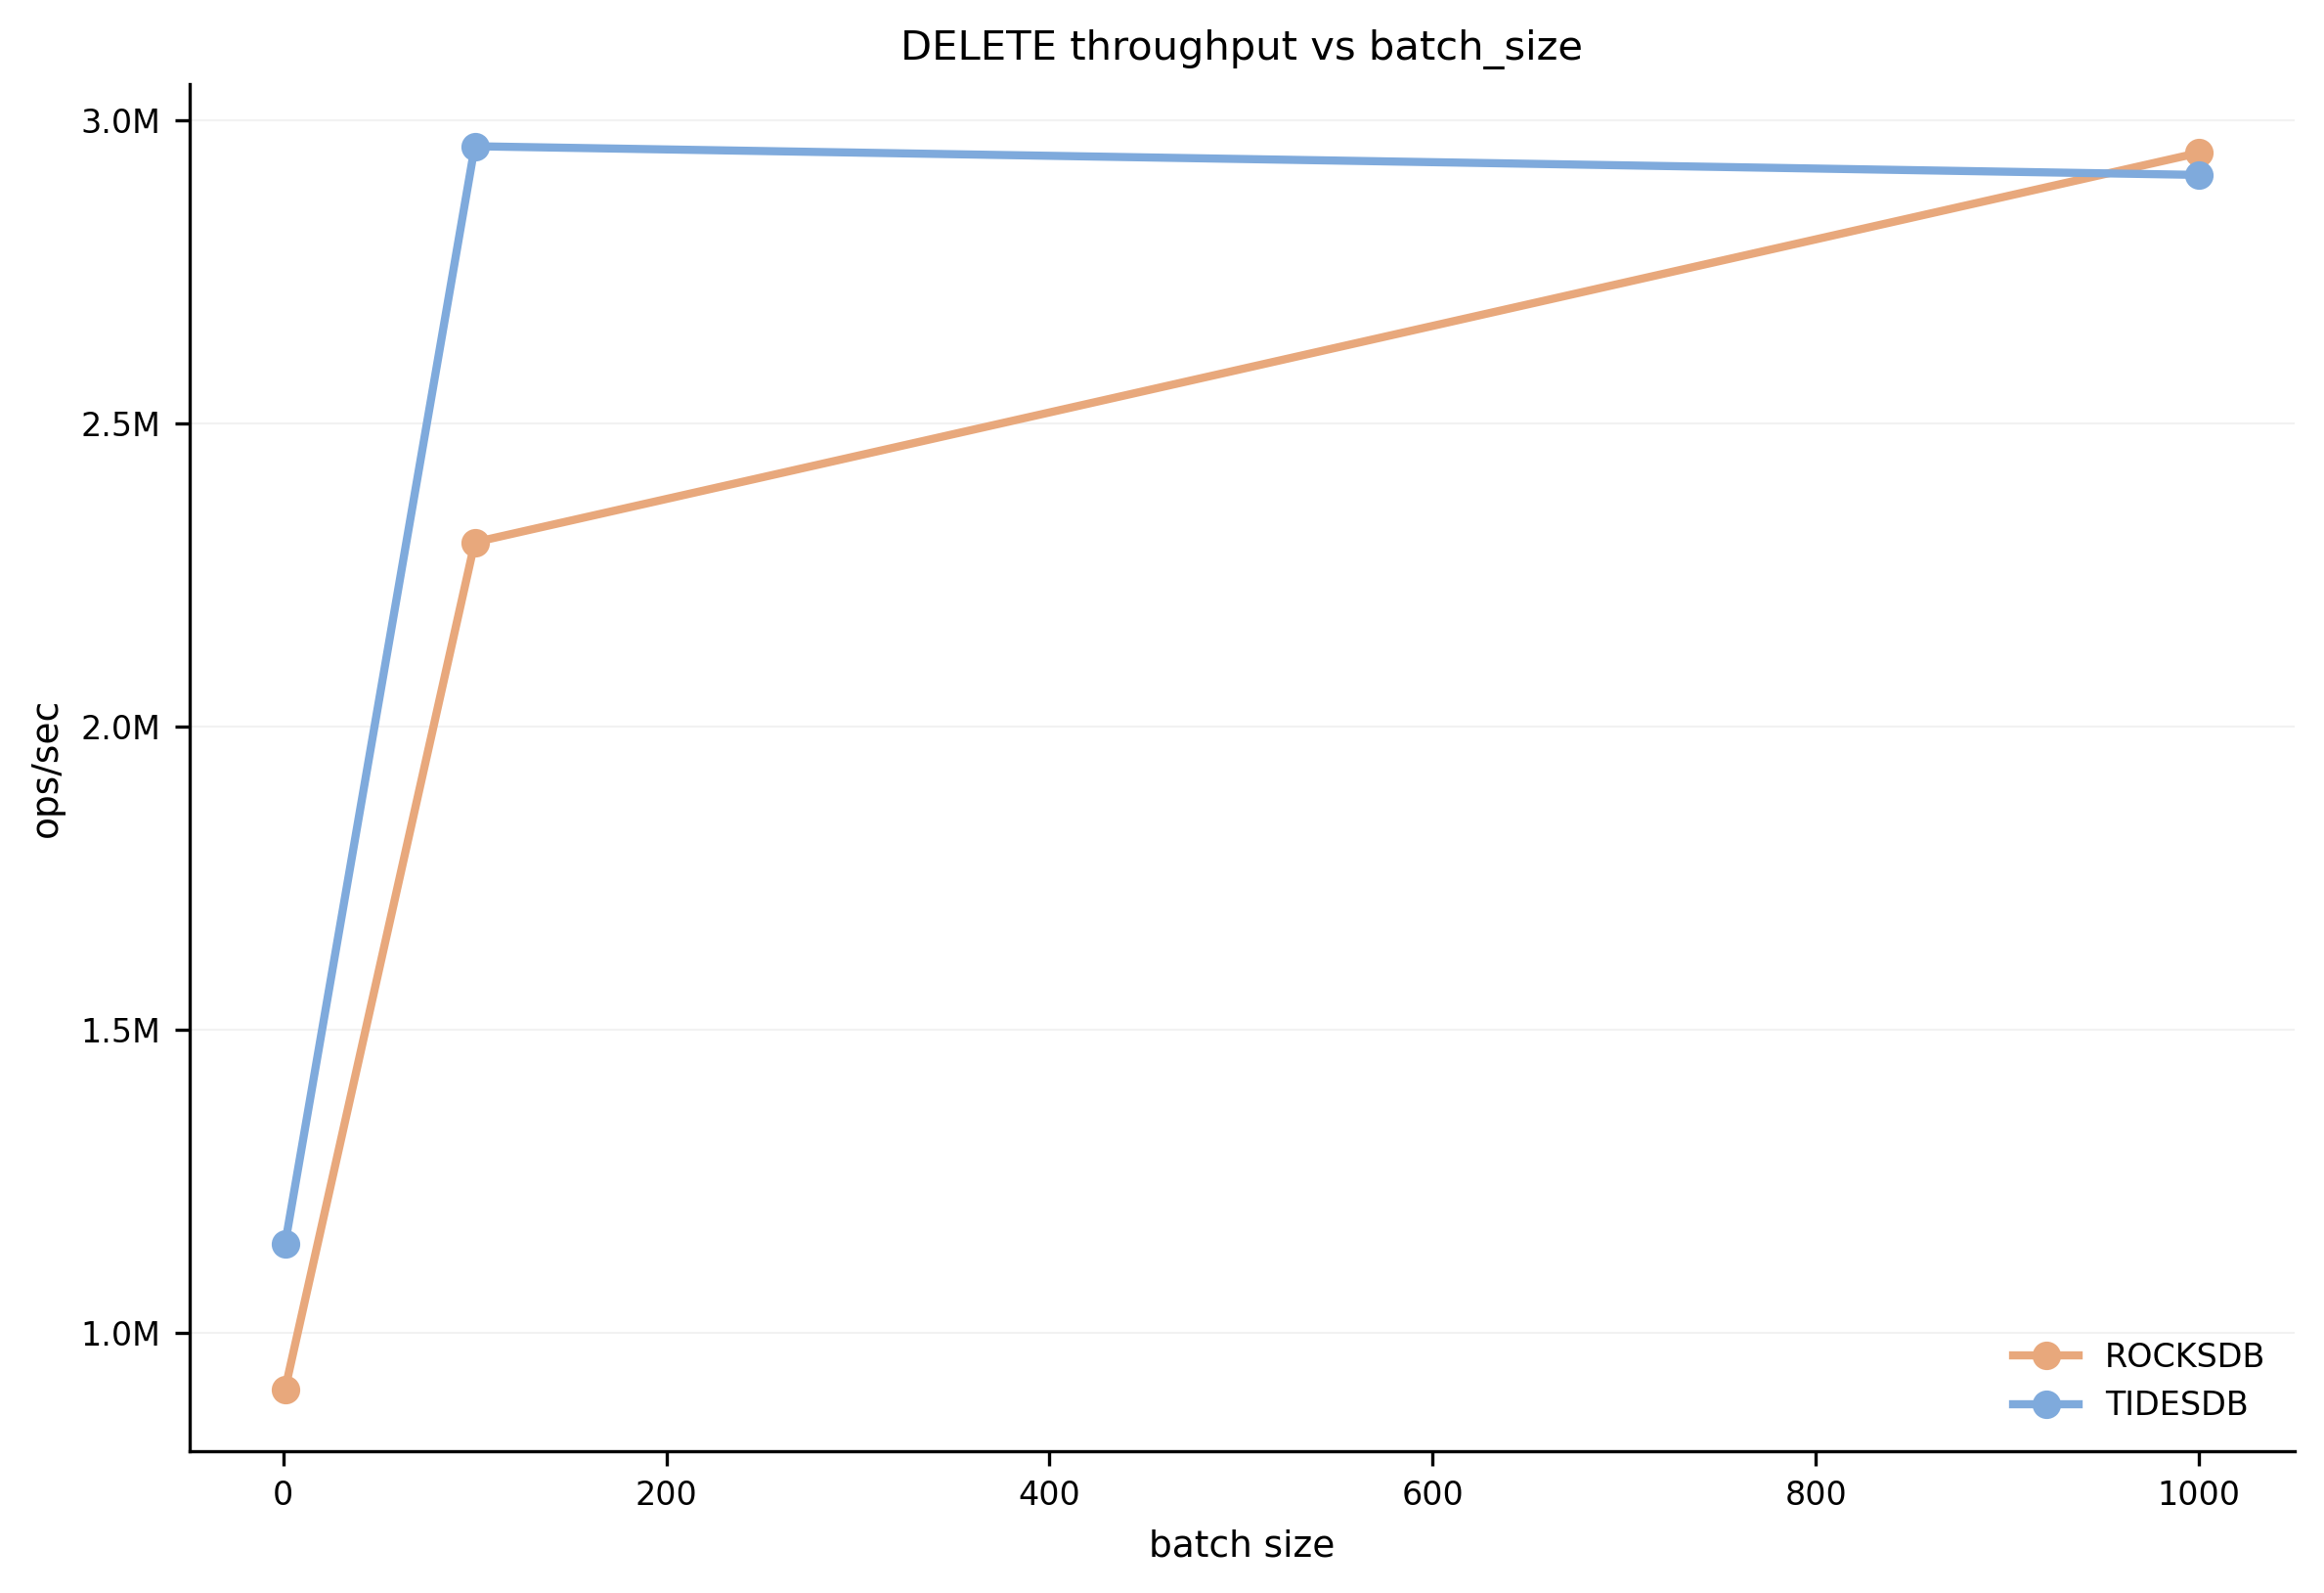
DELETE throughput vs batch size. Performance scales similarly for both engines with increasing batch sizes.
Value Size Impact
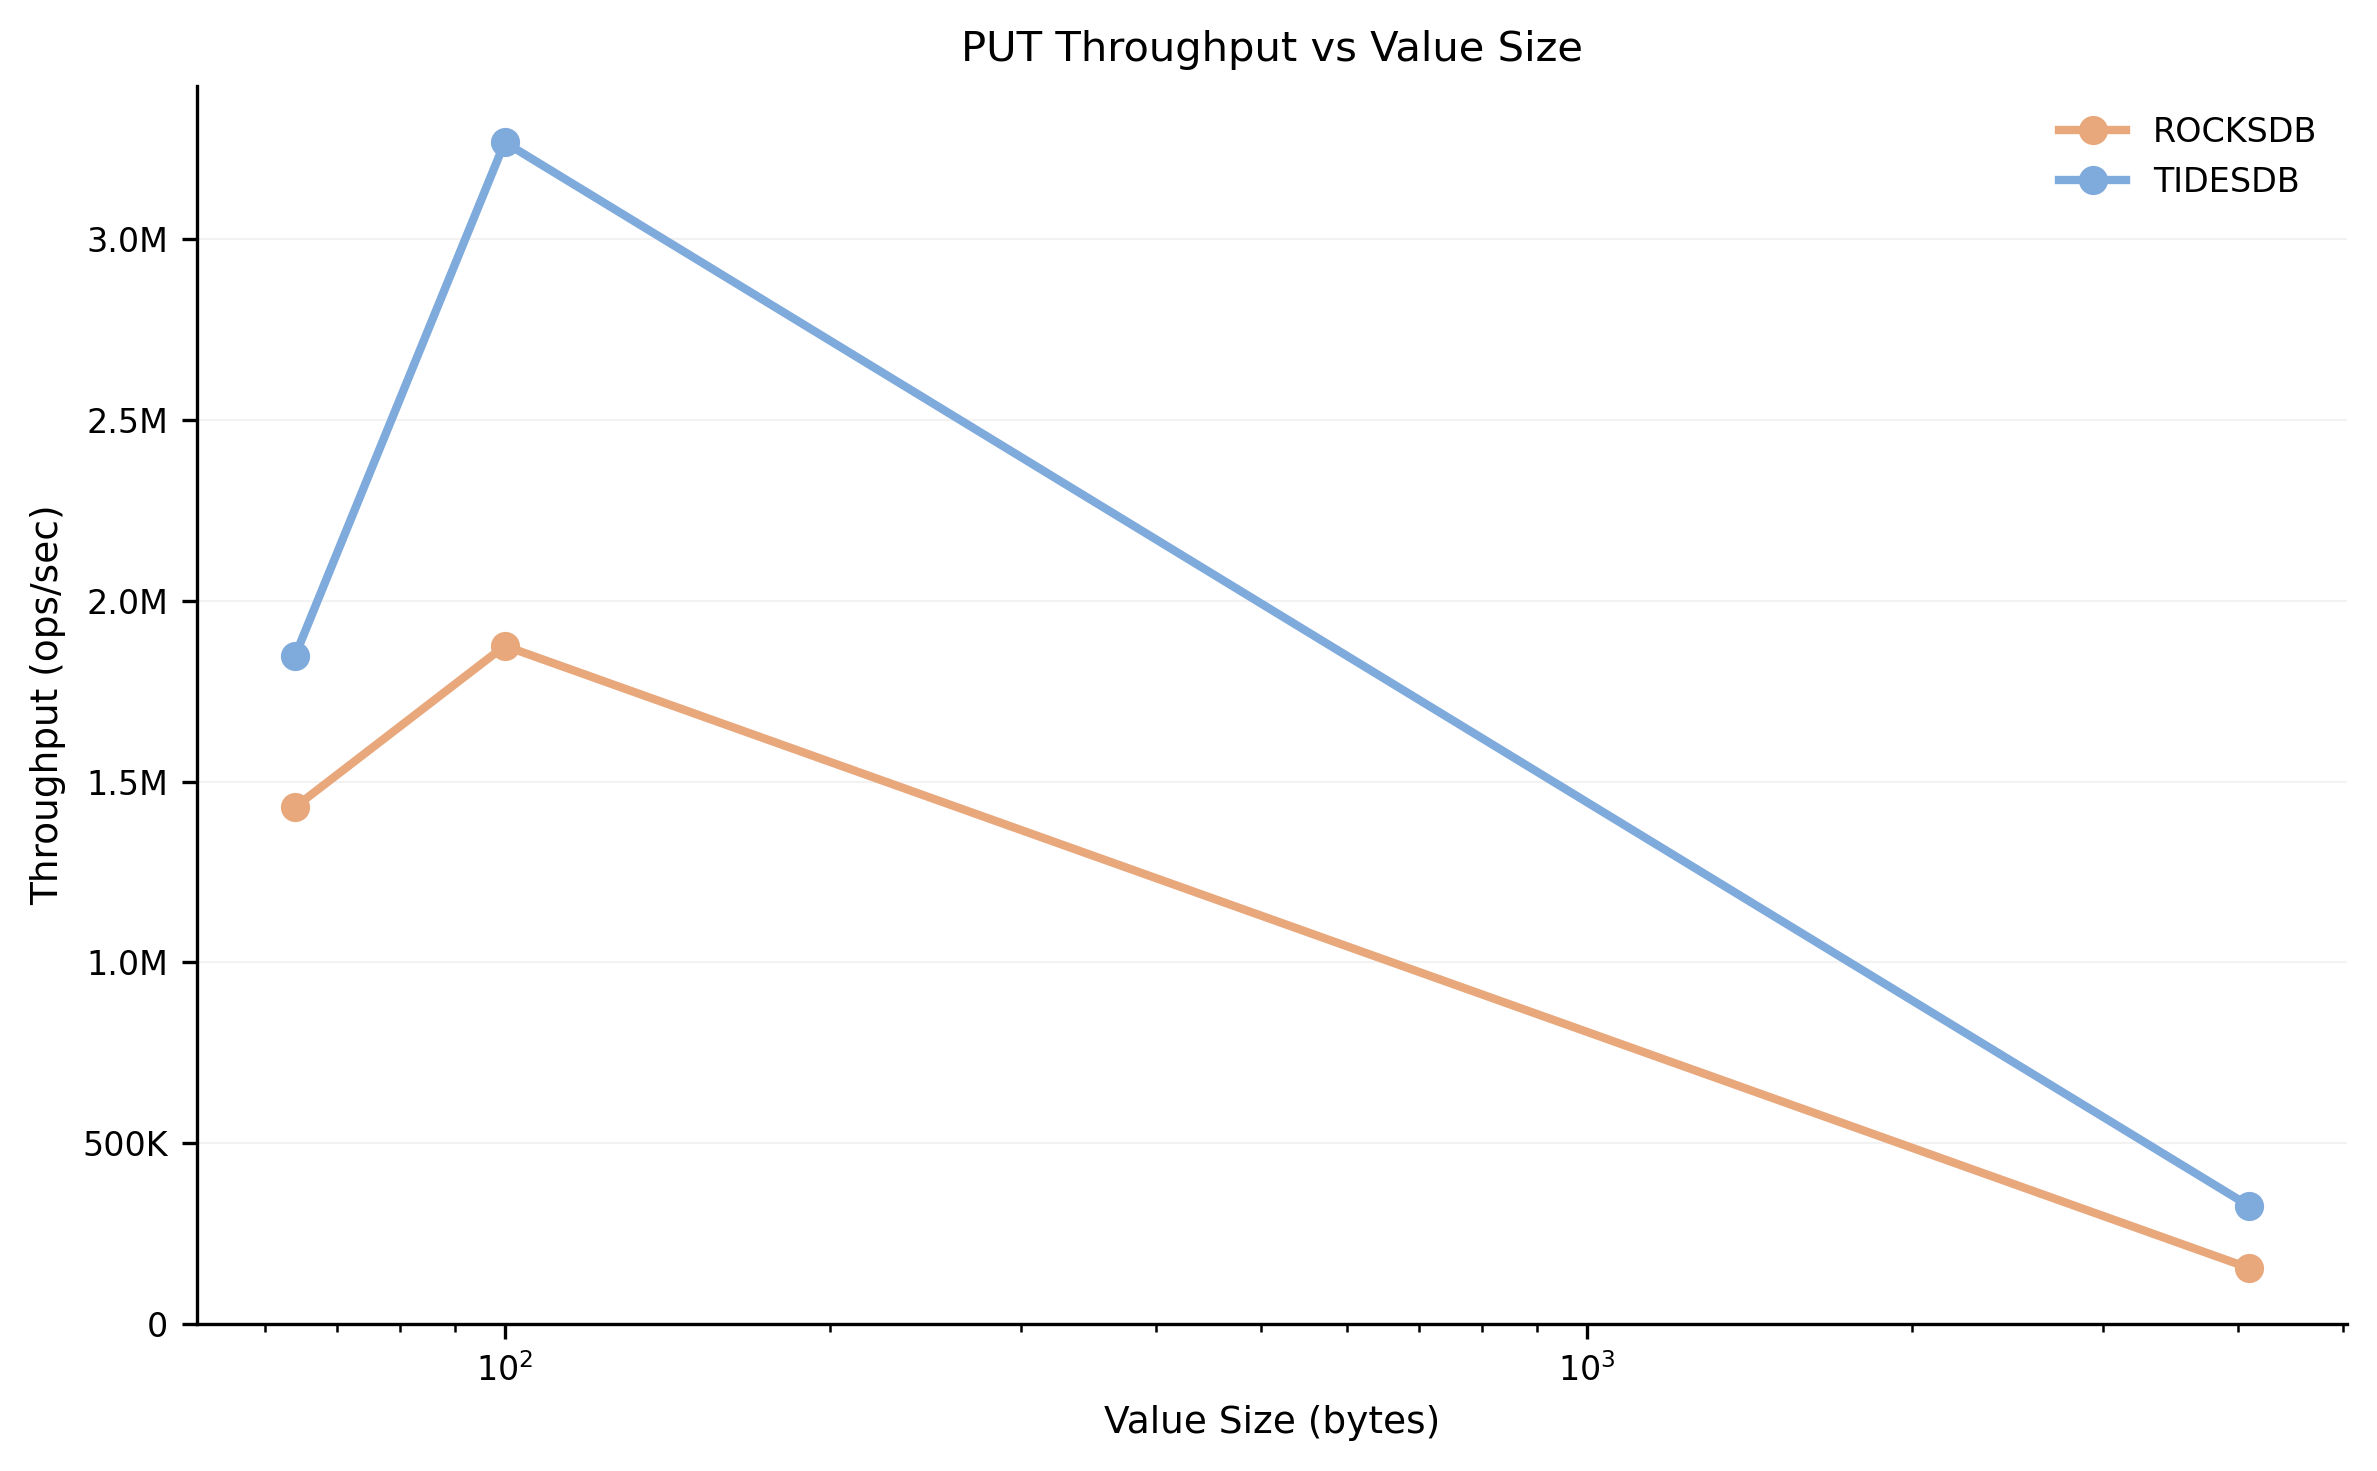
How value size affects PUT throughput. Larger values reduce throughput for both engines, but TidesDB maintains a performance advantage.
Range Query Performance
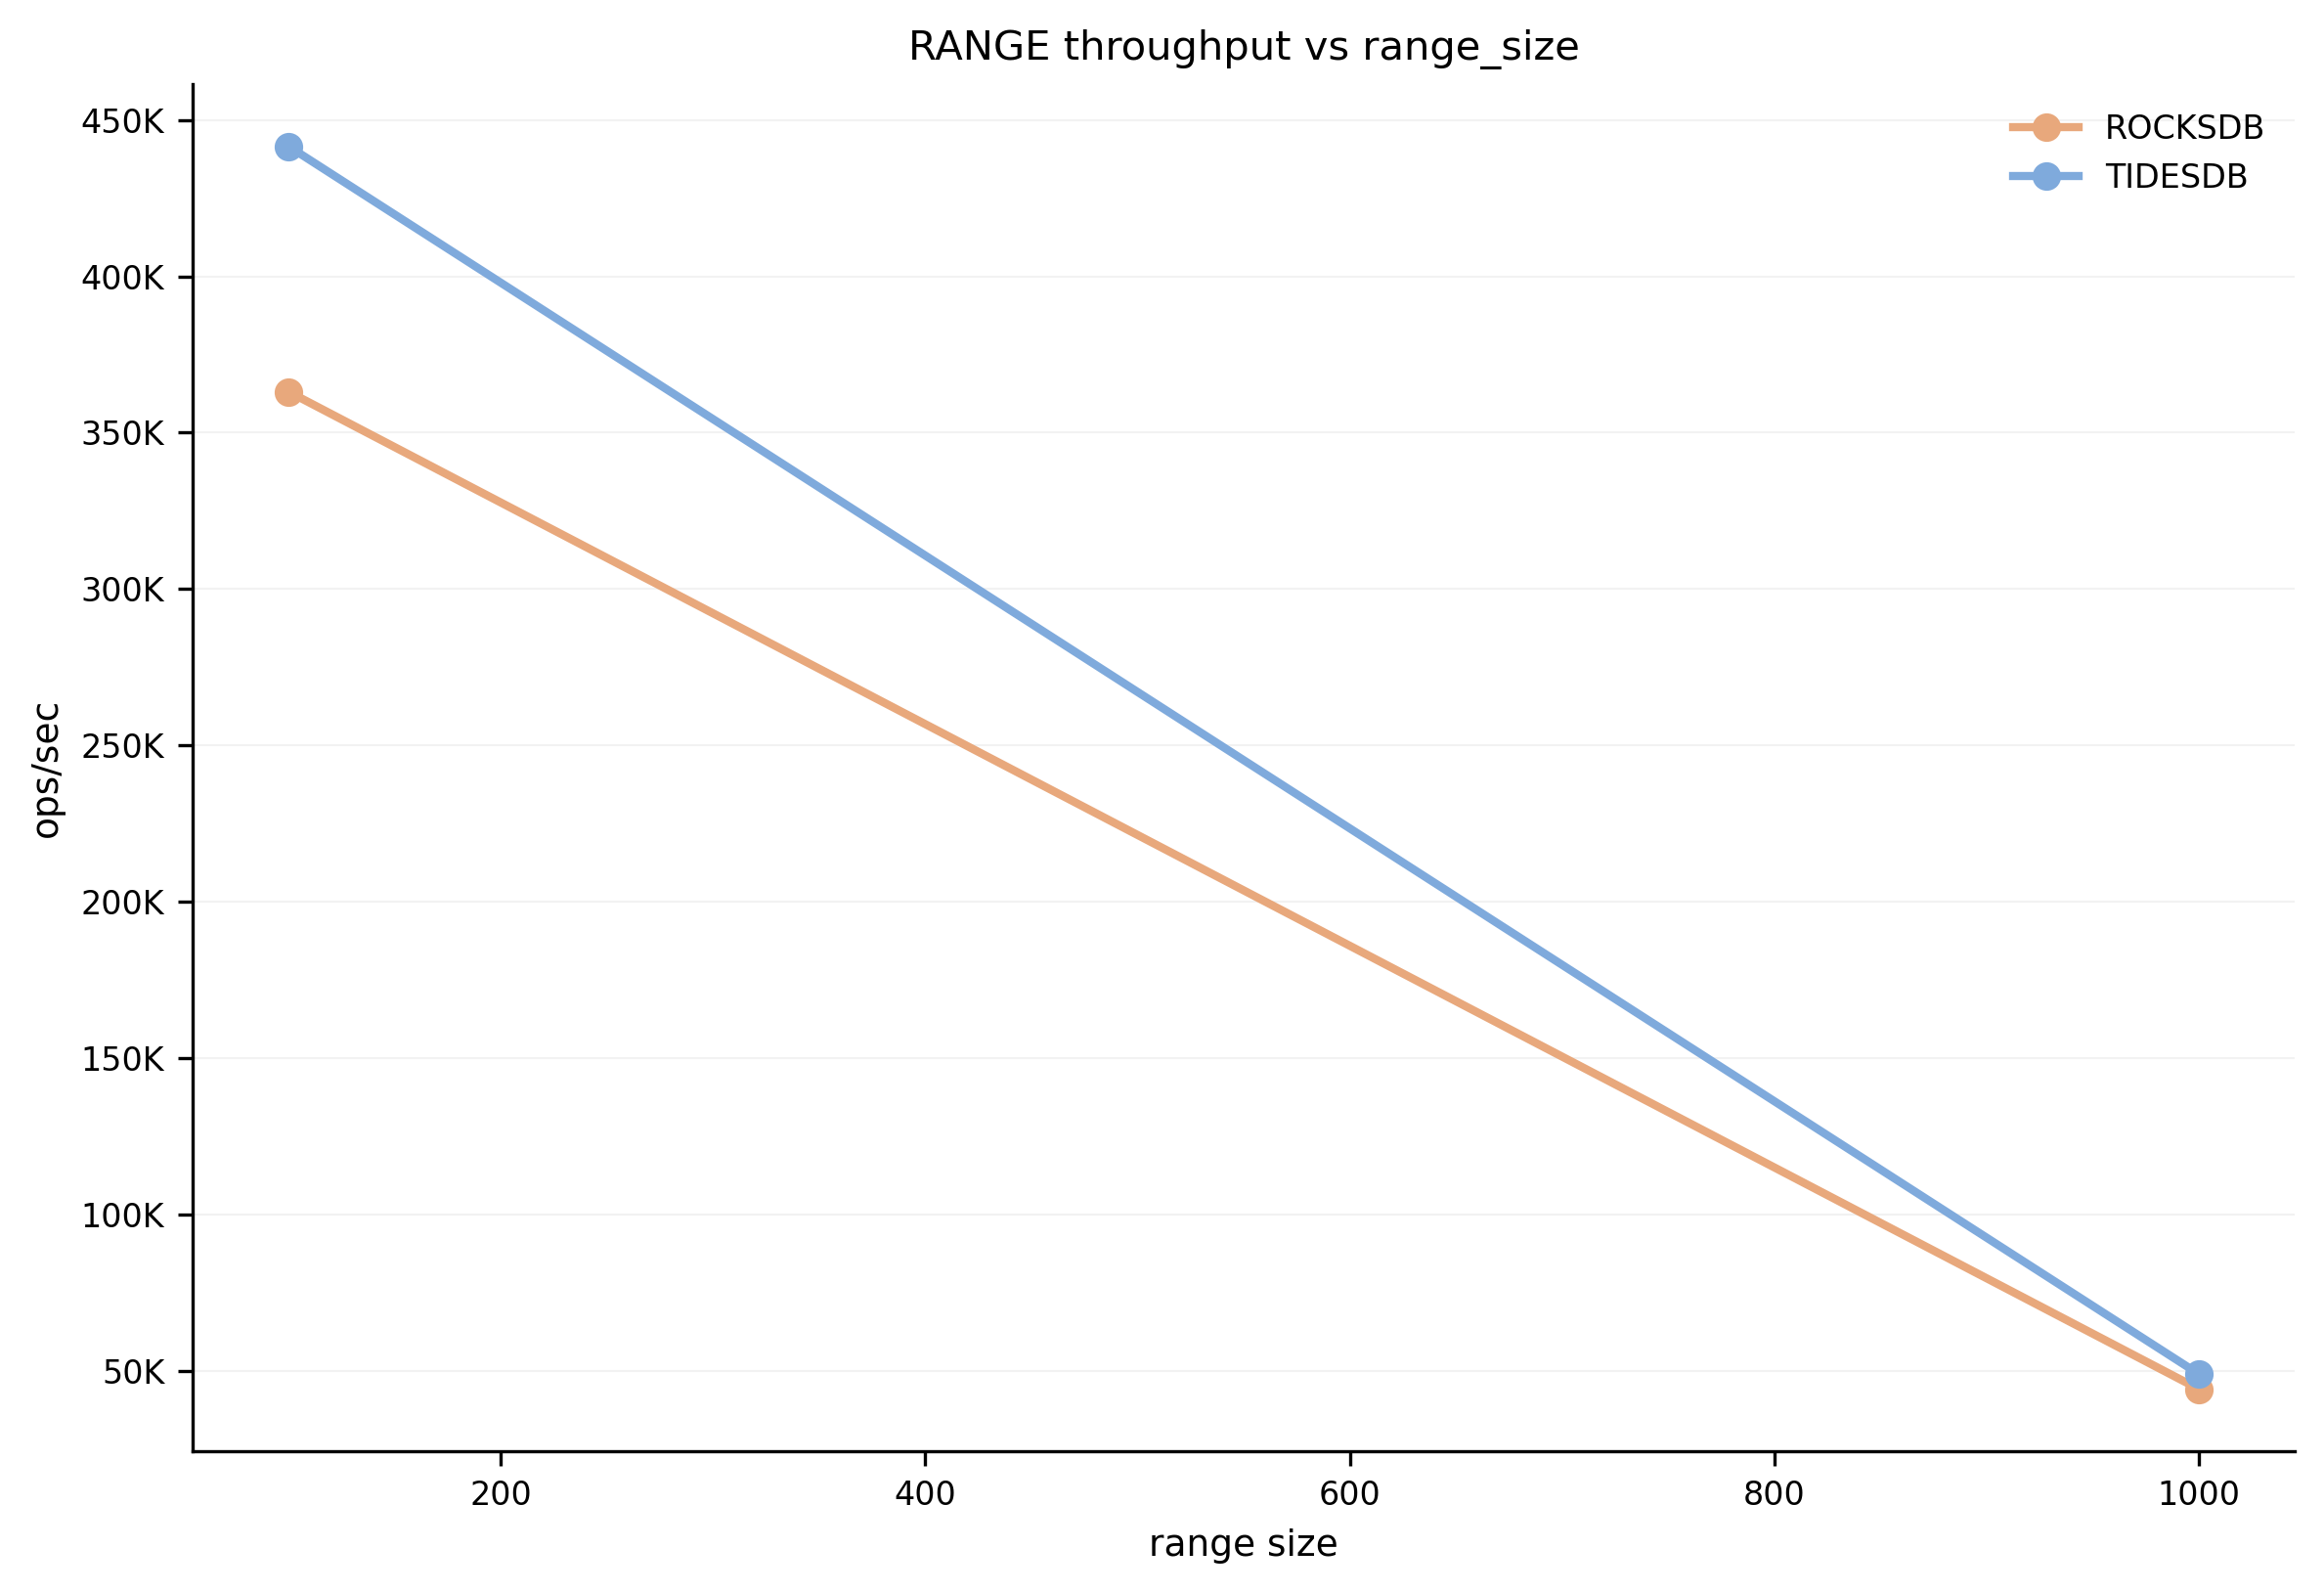
RANGE query throughput vs range size. Both engines show similar scaling behavior as range size increases.
Resource Usage
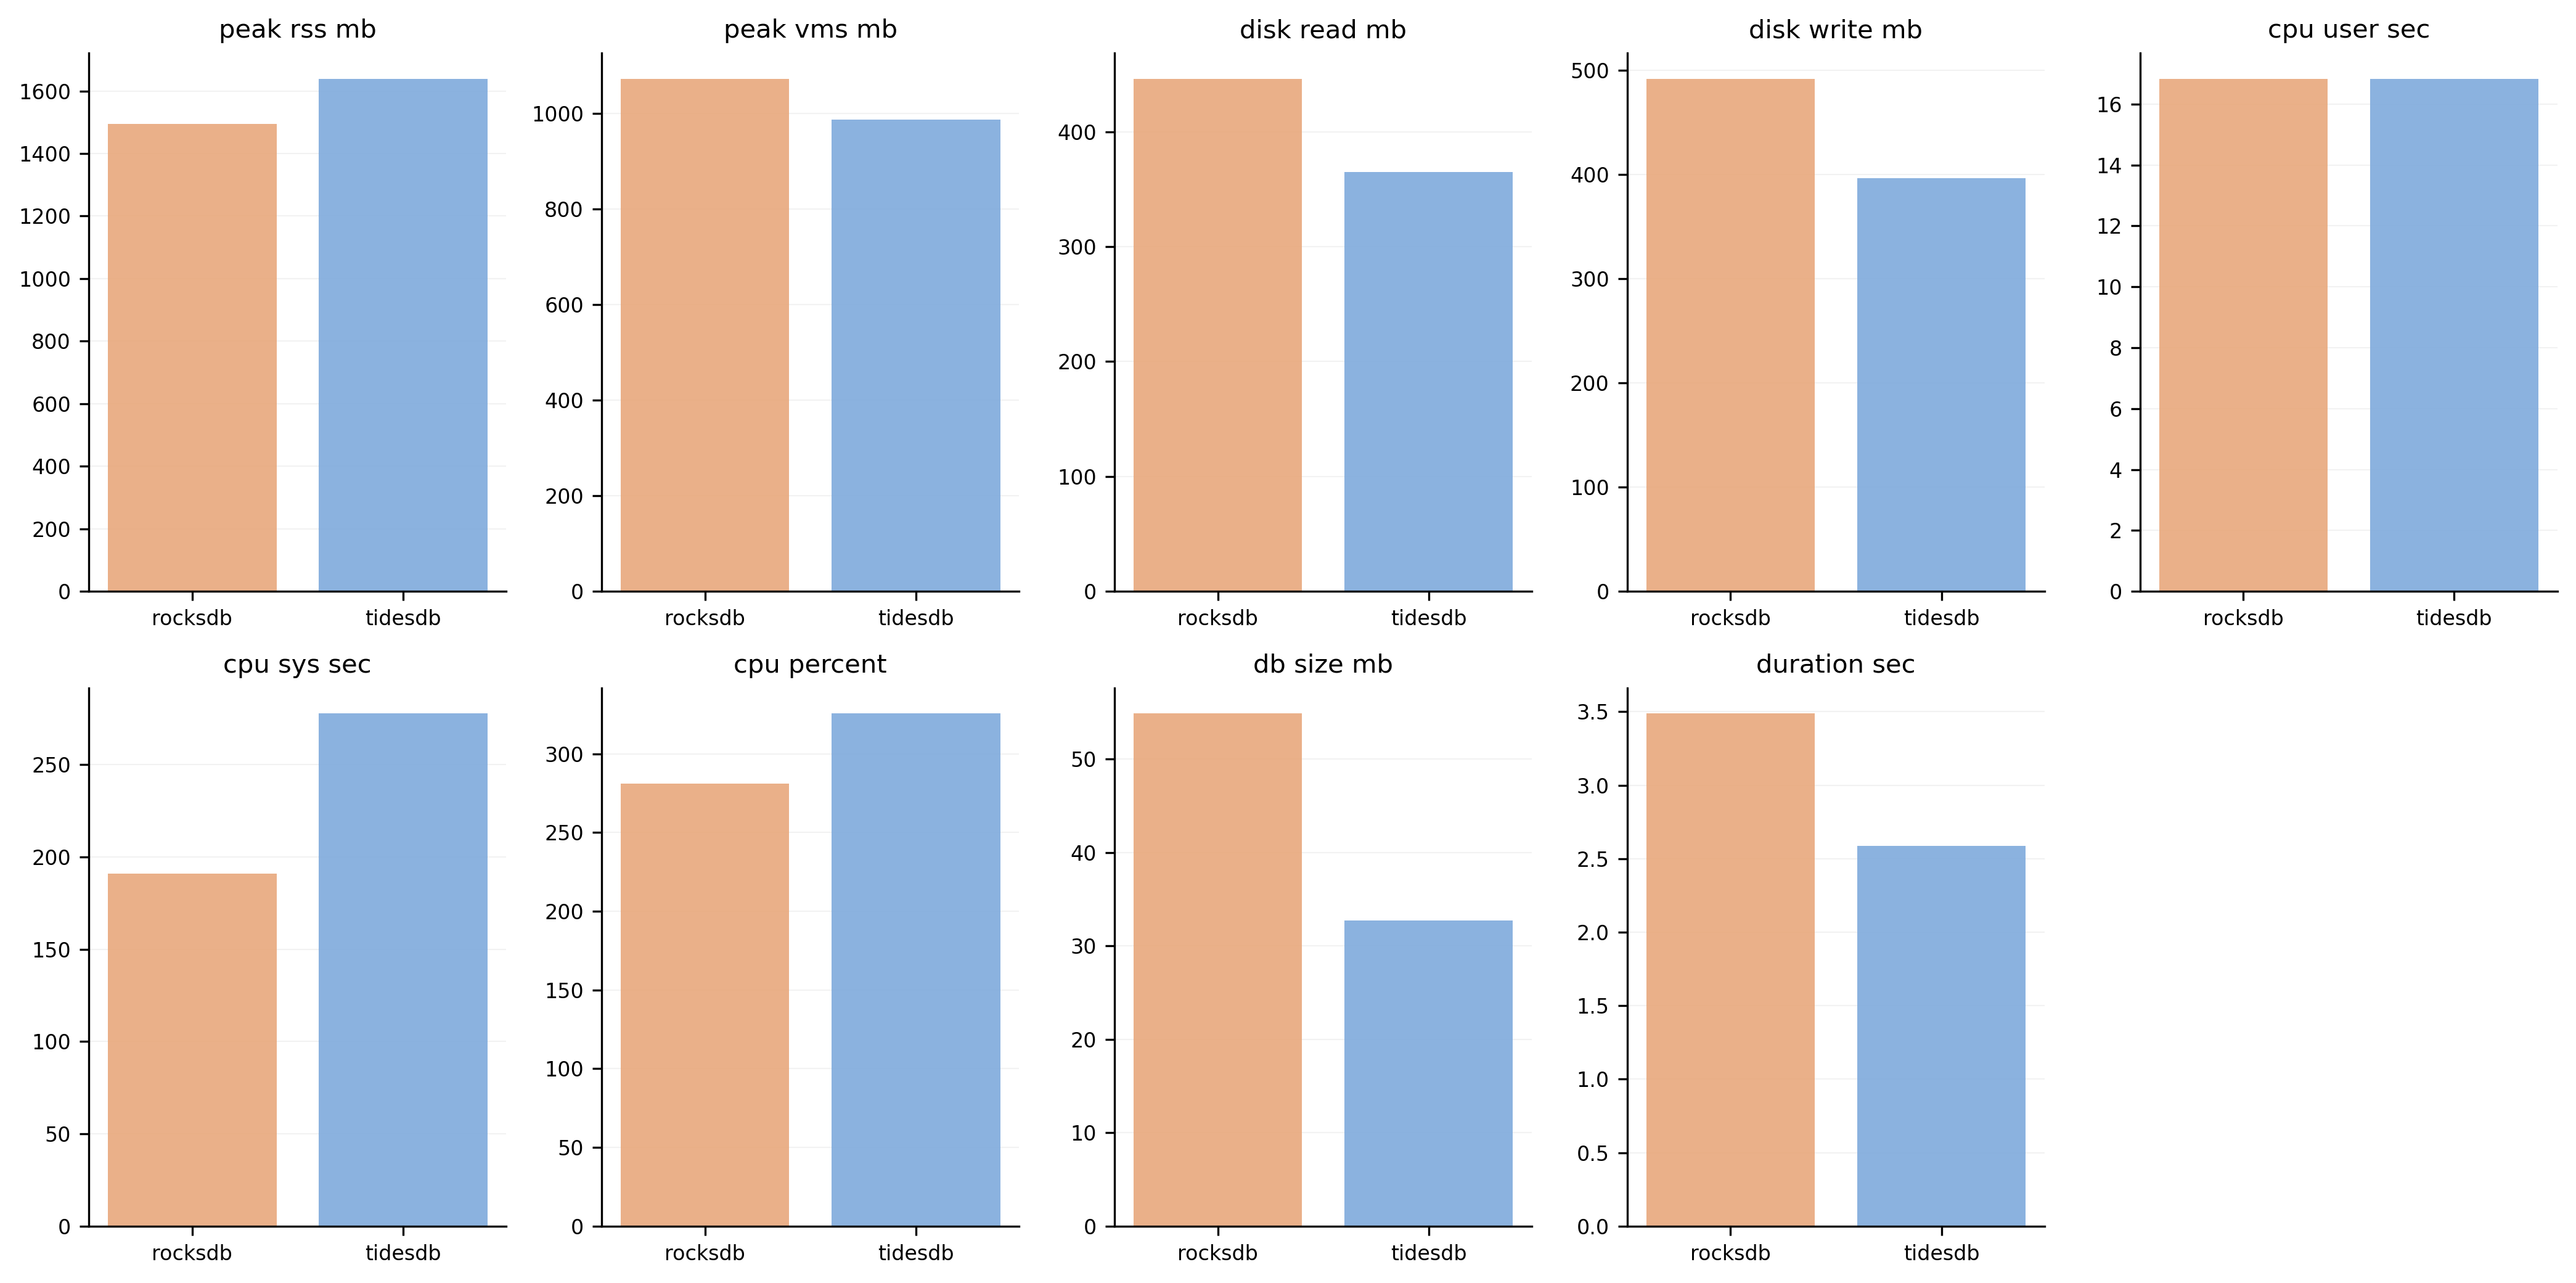
Resource consumption comparison including memory usage, disk I/O, and CPU utilization across different operations.
Write Amplification
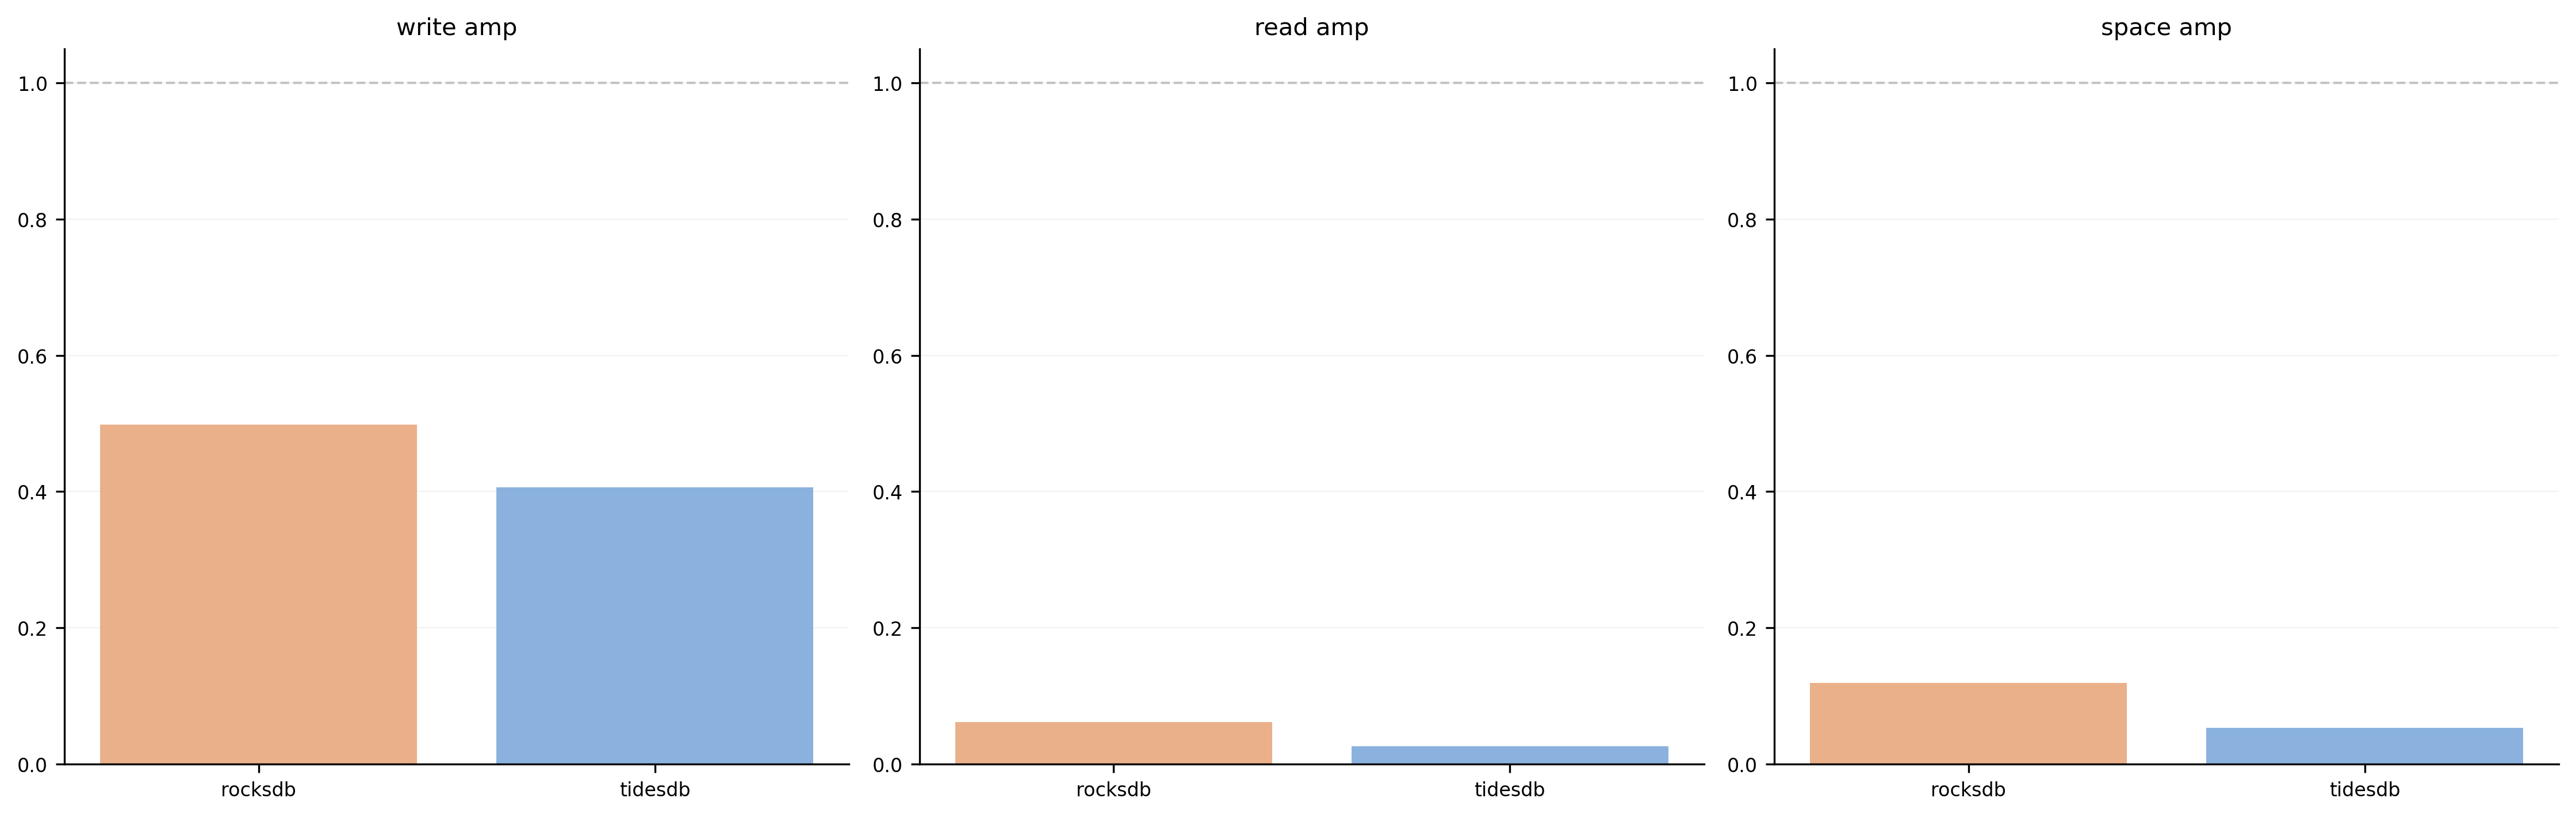
Write, read, and space amplification factors. Lower amplification means more efficient use of storage I/O. TidesDB shows competitive amplification characteristics.
Summary
TidesDB 7.3.1 outperforms RocksDB 10.9.1 across:
| Metric | TidesDB | RocksDB | Difference |
|---|---|---|---|
| Sequential PUT | 6.5M ops/s | 2.4M ops/s | 2.7x faster |
| Random PUT | 2.6M ops/s | 1.8M ops/s | 1.4x faster |
| Random GET | 2.6M ops/s | 1.4M ops/s | 1.9x faster |
| Random SEEK | 2.9M ops/s | 1.1M ops/s | 2.6x faster |
| PUT p99 latency | 2,149 μs | 5,946 μs | 2.8x lower |
| PUT max latency | 4,218 μs | 181,680 μs | 43x lower |
| PUT Latency CV | 109% | 265% | 2.4x more consistent |
| Write amplification | 1.08x | 1.44x | 25% less I/O |
| Database size | 111 MB | 207 MB | 47% smaller |
The key takeaways are:
-
TidesDB delivers 1.4x to 2.7x higher throughput depending on workload.
-
RocksDB shows occasional latency spikes up to 181ms (likely from compaction). TidesDB’s worst case is 4ms.
-
TidesDB shows lower CV on PUT operations (109% vs 265%), indicating more predictable write performance.
-
TidesDB show’s consistently lower write amplification and smaller on-disk footprint.
Thanks for reading!
Links
- GitHub · https://github.com/tidesdb/tidesdb
- Design deep-dive · https://tidesdb.com/getting-started/how-does-tidesdb-work
Join the TidesDB Discord for more updates and discussions at https://discord.gg/tWEmjR66cy