Benchmark Analysis on TidesDB v8.5.0 and RocksDB v10.10.1

published on February 16th, 2026
Continuing from the previous article, this release focused on further adapability and performance across the clock cache, B+tree (klog format), and write paths, with a strong focus on safety under contention and scalability on NUMA systems.
There are still differences obviously running on older and newer hardware but the gap is a lot smaller than before.
Environment 1
First off I ran the benchtool runner tidesdb_rocksdb_old.sh a few times on the below environment:
- Intel Core i7-11700K (8 cores, 16 threads) @ 4.9GHz
- 48GB DDR4
- Western Digital 500GB WD Blue 3D NAND Internal PC SSD (SATA)
- Ubuntu 23.04 x86_64 6.2.0-39-generic
- GCC (glibc)
| File Name | Format | SHA256 Checksum |
|---|---|---|
| tidesdb_rocksdb_benchmark_results_20260216_002045.csv | CSV | 10c90cbe11353c17ddc20bbfcaad3bc8651b33112f71f5967d59e8819fc4aae2 |
| tidesdb_rocksdb_benchmark_results_20260216_002045.txt | TXT | 0d47492d5601f89426d79b30cefdca361b40b51e3080386a1832e327828cf523 |
The results on this environment tell a wild story. TidesDB v8.5.0 outperforms RocksDB v10.10.1 on pretty much every measured workload at 8 threads with batch sizes ranging from 1 to 10000.
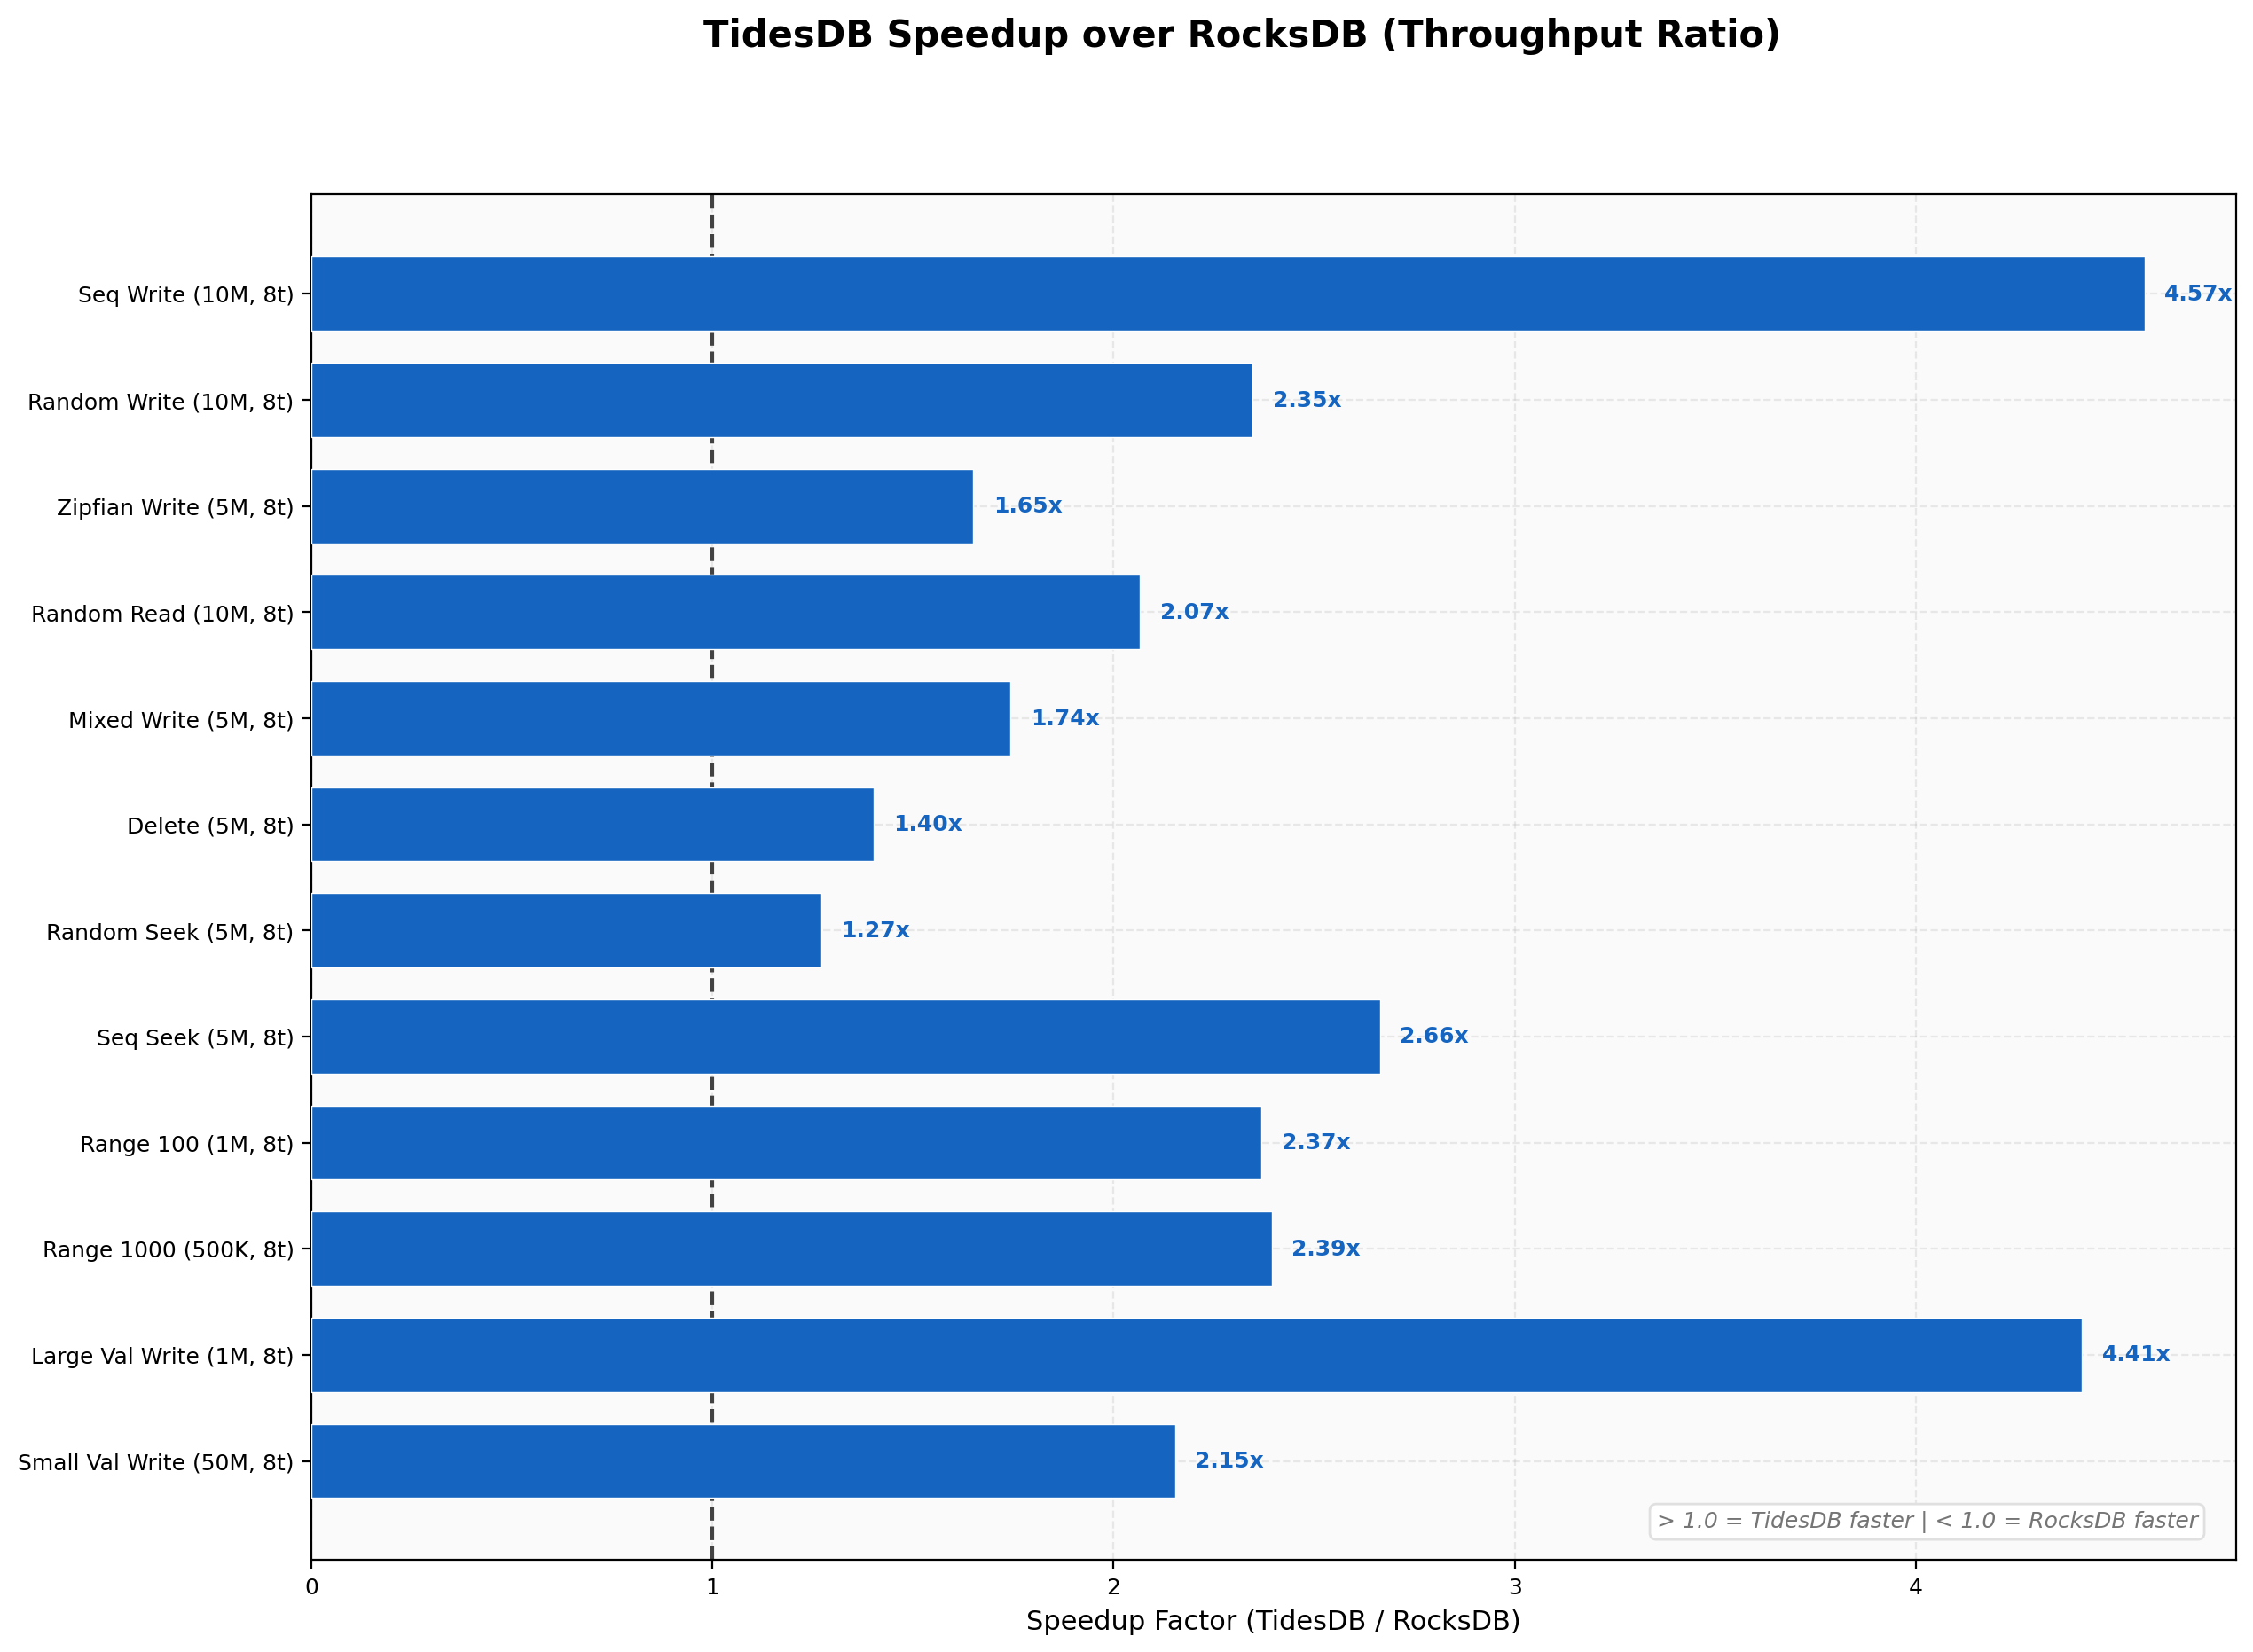
The largest gains appear on sequential writes at 4.57x and large value writes at 4.41x. Seek workloads range from 1.27x on random seeks up to 5.01x on zipfian seeks. Even the tightest result, random deletes at 1.40x, still falls in favor of TidesDB. Nothing here finishes slower.
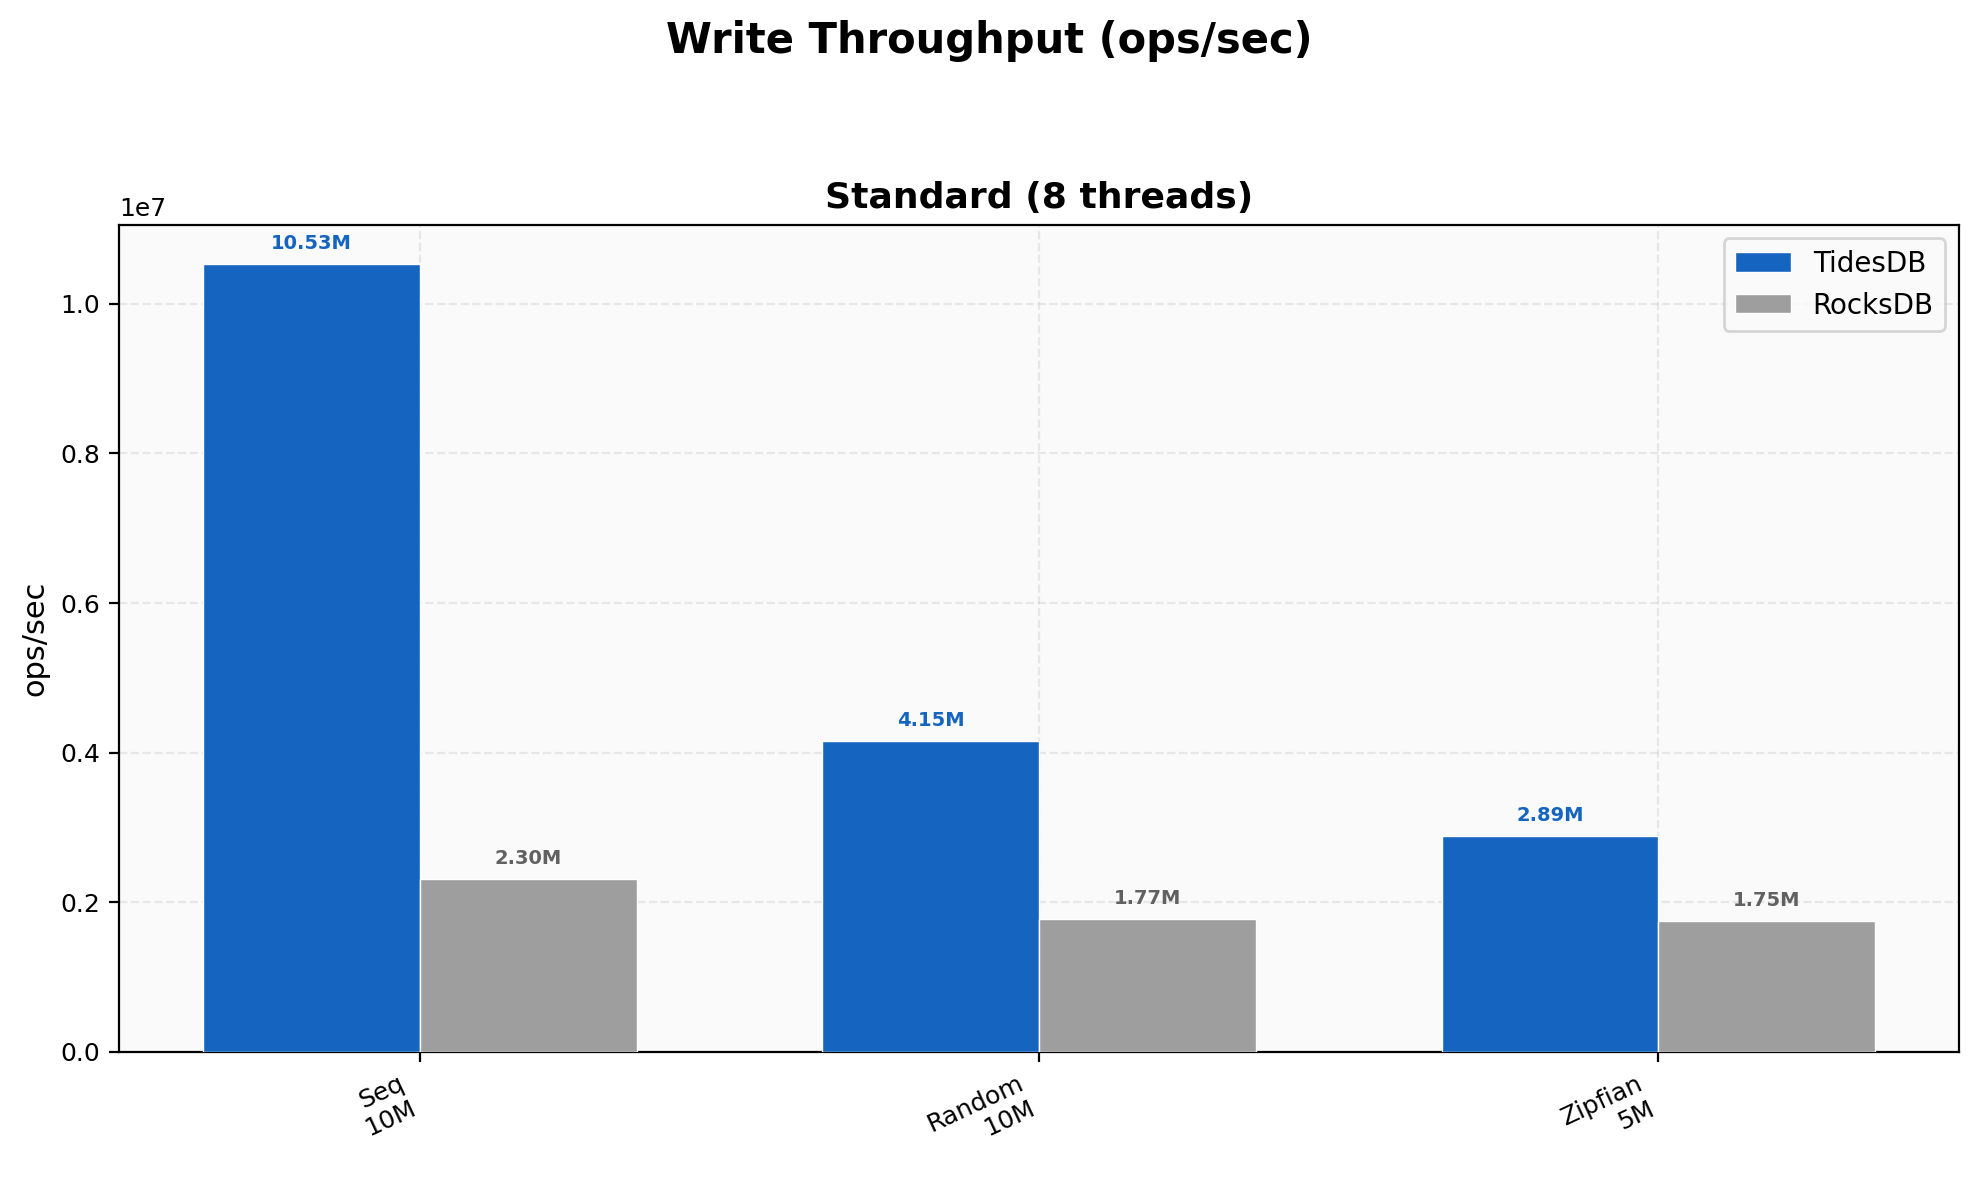
Sequential writes reach 10.5M ops/sec on TidesDB against 2.3M on RocksDB. Random writes land at 4.15M versus 1.77M and zipfian at 2.89M versus 1.75M. The pattern holds across all three access distributions.
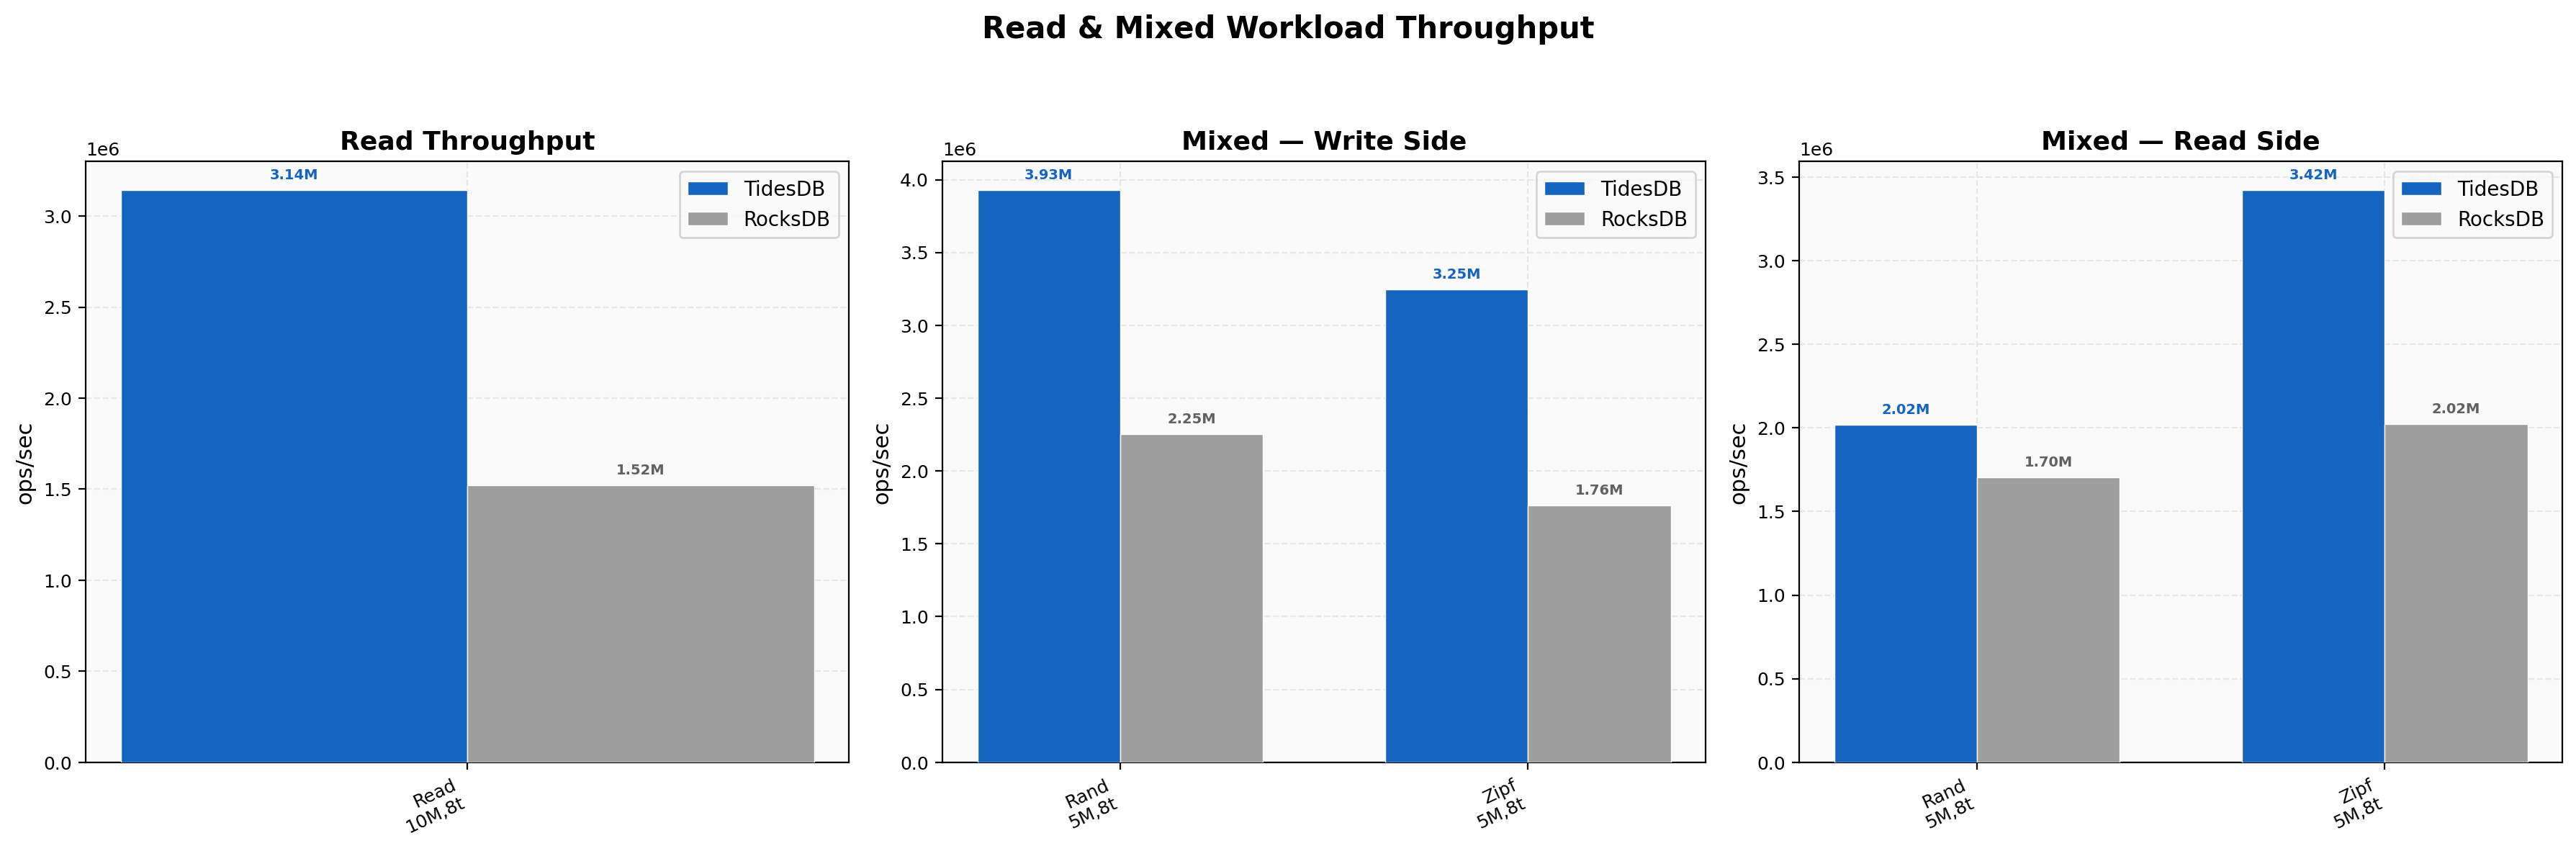
Point reads on 10M randomly distributed keys show TidesDB at 3.14M ops/sec against RocksDB at 1.52M. On the mixed workloads the write side of the random mix runs at 3.93M versus 2.25M while the read side of the same workload lands at 2.02M versus 1.70M. Zipfian mixed reads hit 3.42M on TidesDB against 2.02M on RocksDB. Reads under concurrent write pressure hold up well thanks to the clock cache and MVCC isolation.
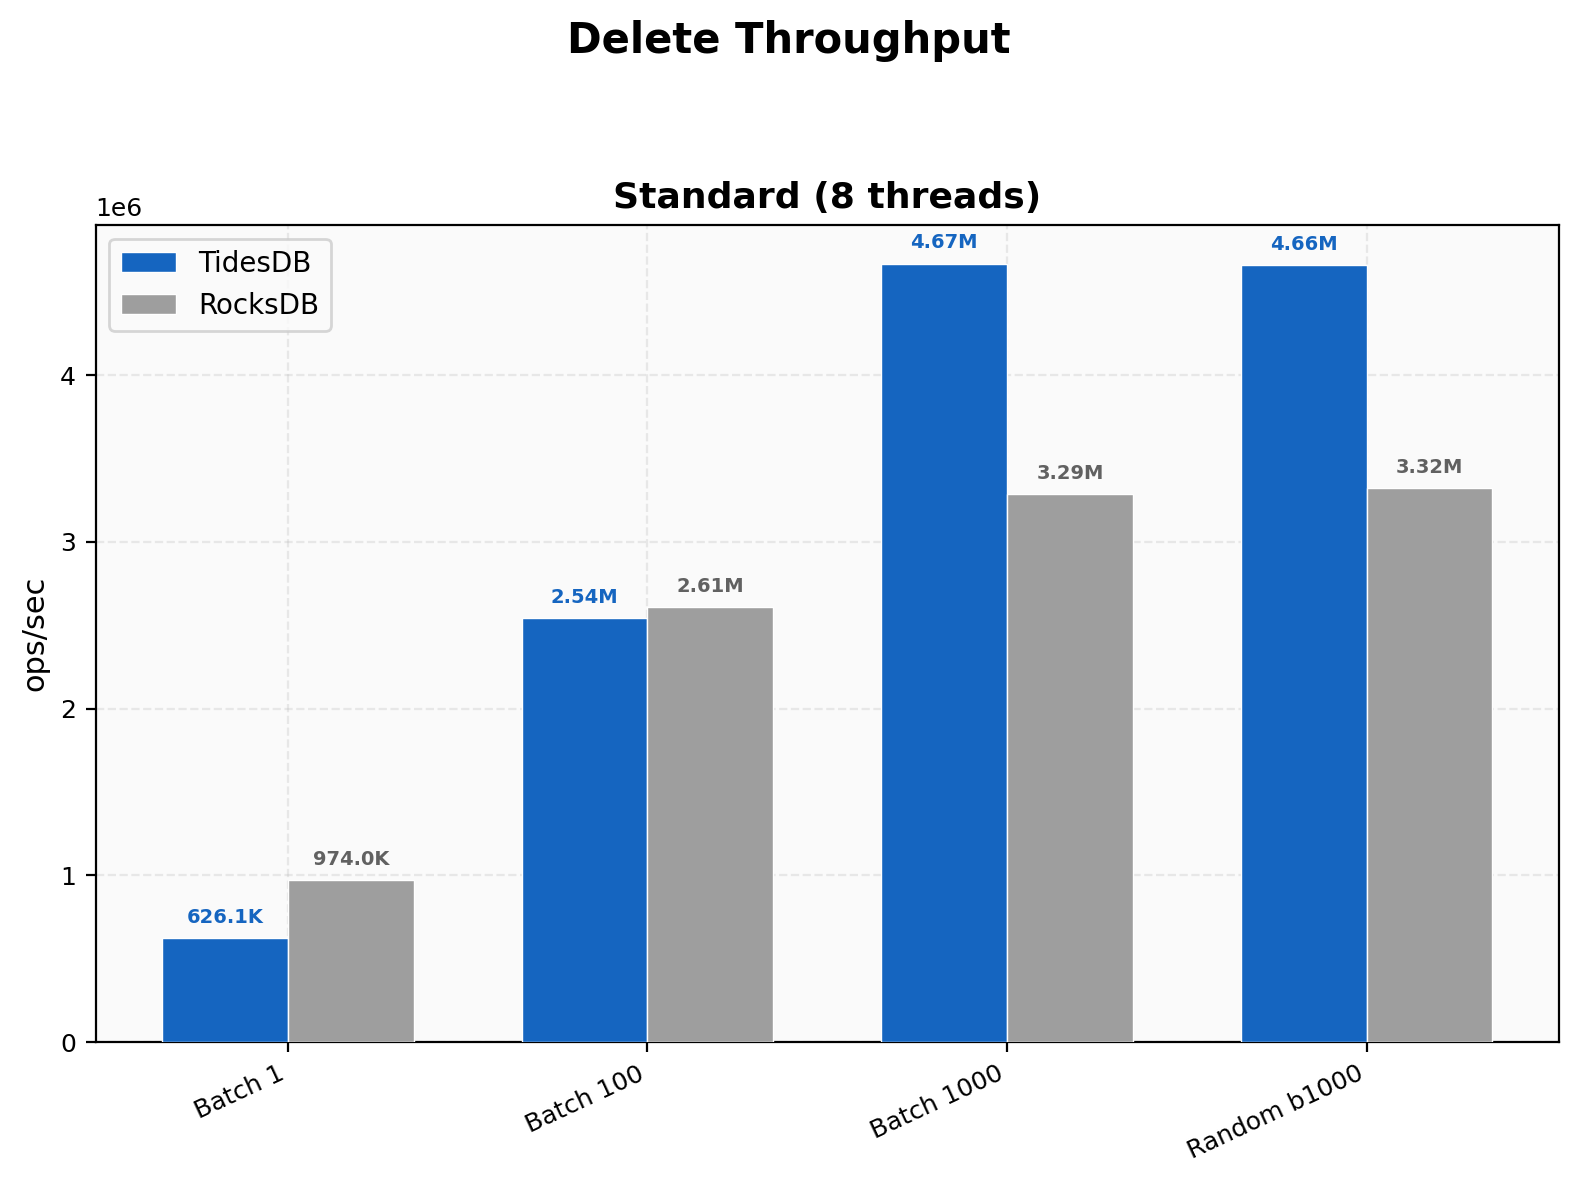
At batch size 1, RocksDB leads with 974K ops/sec versus TidesDB at 626K. The overhead of single-key tombstone inserts is visible here. At batch 100 the two engines are nearly tied at roughly 2.5M ops/sec. Once batch size reaches 1000 TidesDB pulls ahead to 4.67M against 3.29M. The random delete test at batch 1000 shows a similar 1.40x advantage. TidesDB’s batch-oriented delete path clearly benefits from amortization.
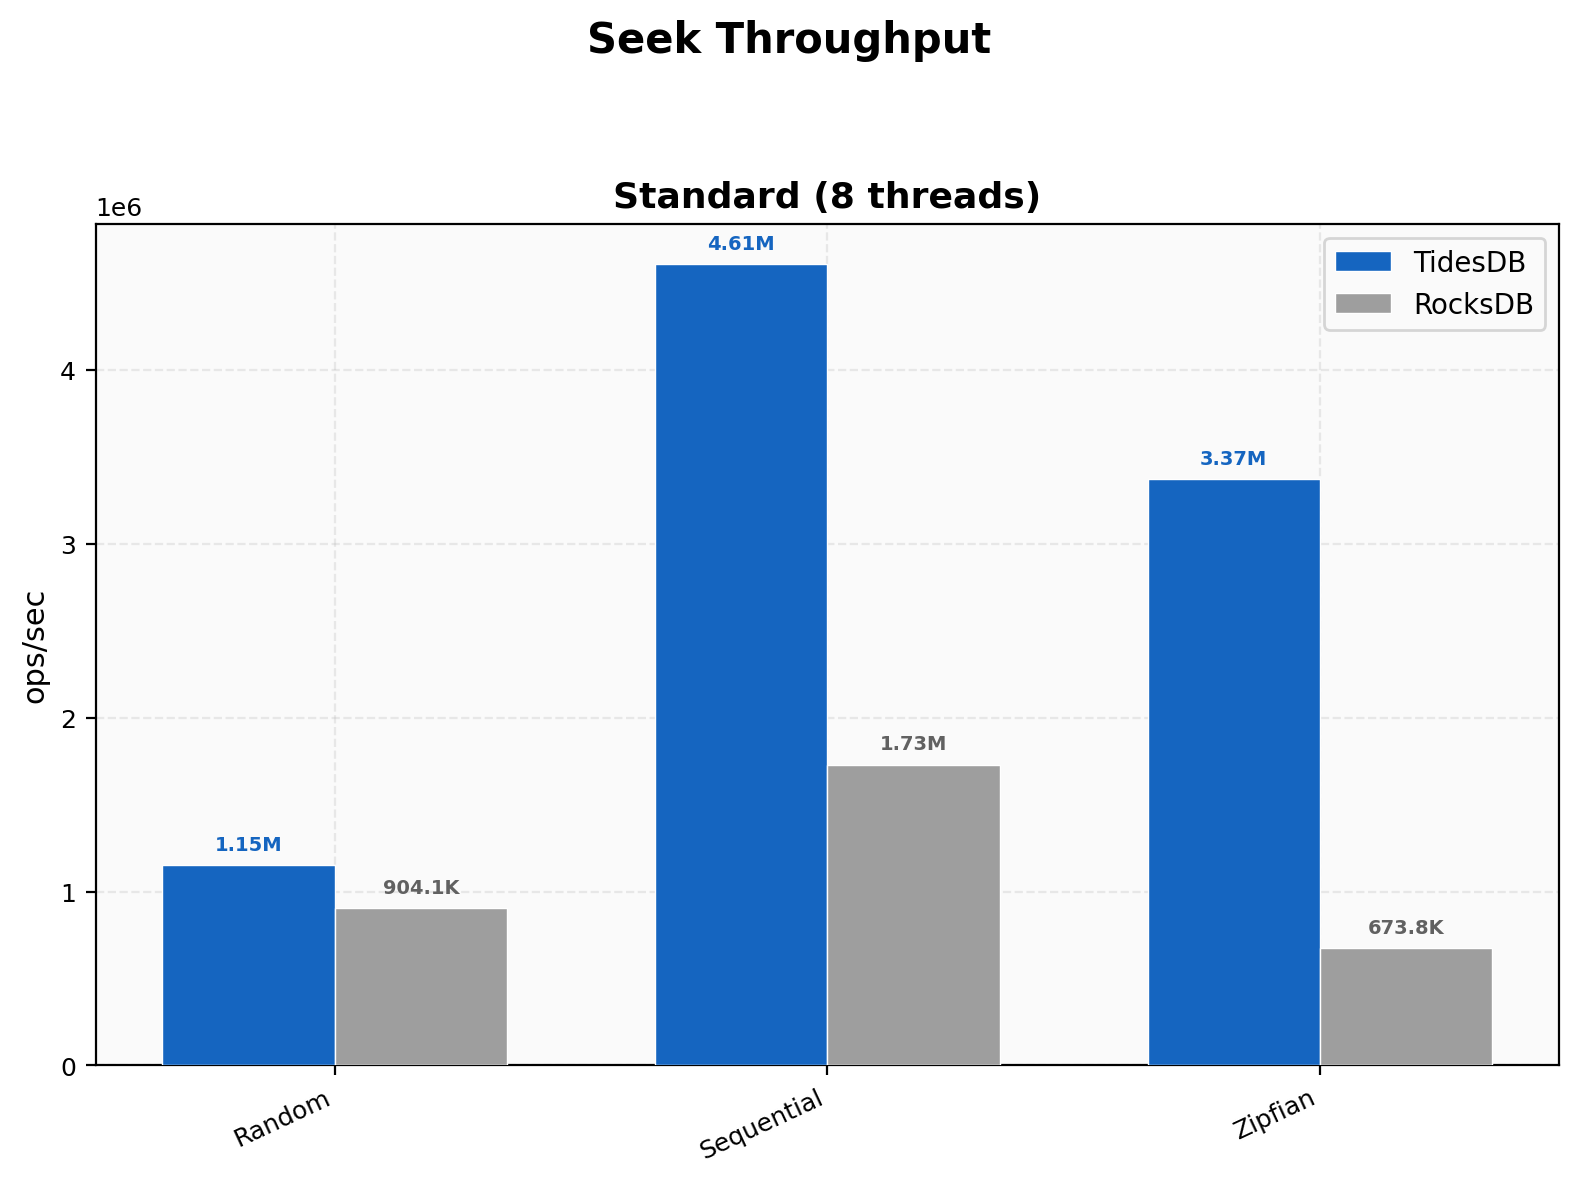
Sequential seeks show a wide gap at 4.61M ops/sec on TidesDB versus 1.73M on RocksDB, a 2.67x difference. Zipfian seeks are even more dramatic at 3.37M versus 674K, roughly 5x. Random seeks are the closest at 1.15M versus 904K.
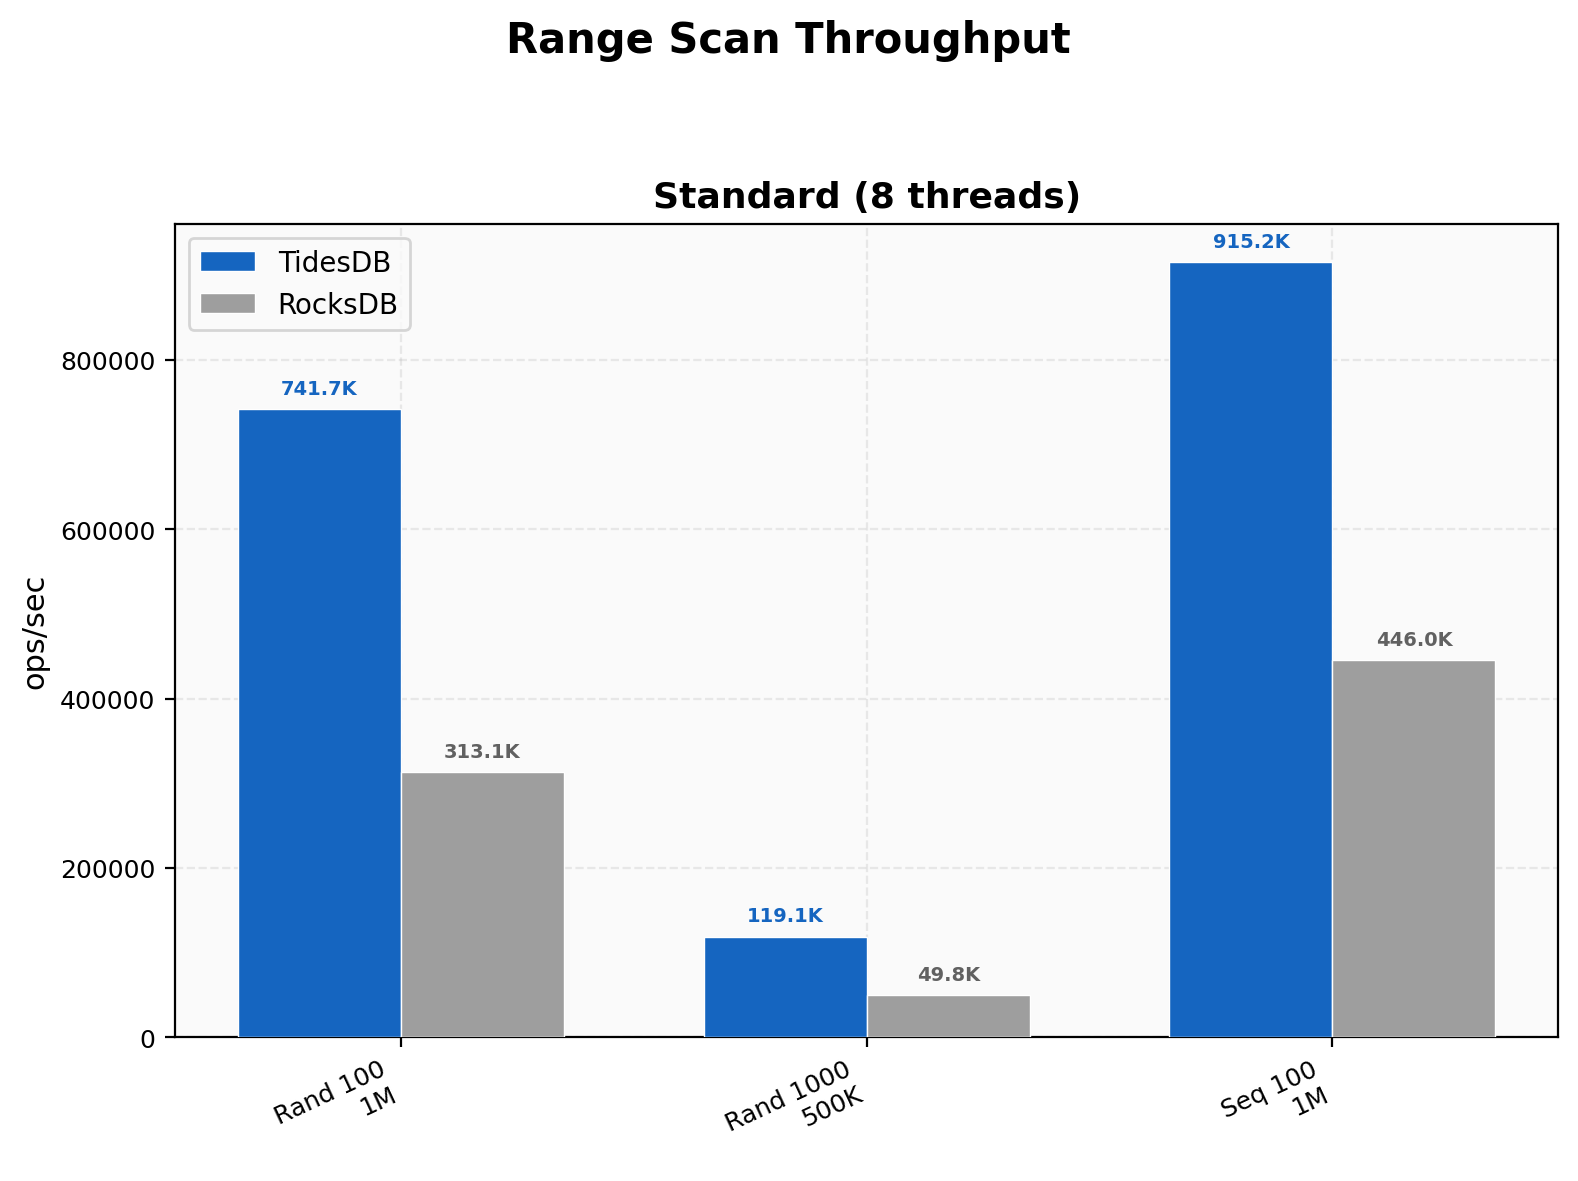
TidesDB leads on all three range scan configurations. Random range scans of 100 keys reach 742K ops/sec against 313K. Widening the range to 1000 keys per scan shows 119K versus 50K. Sequential range scans hit 915K on TidesDB versus 446K on RocksDB. The roughly 2-2.4x advantage is consistent regardless of range width or access pattern.
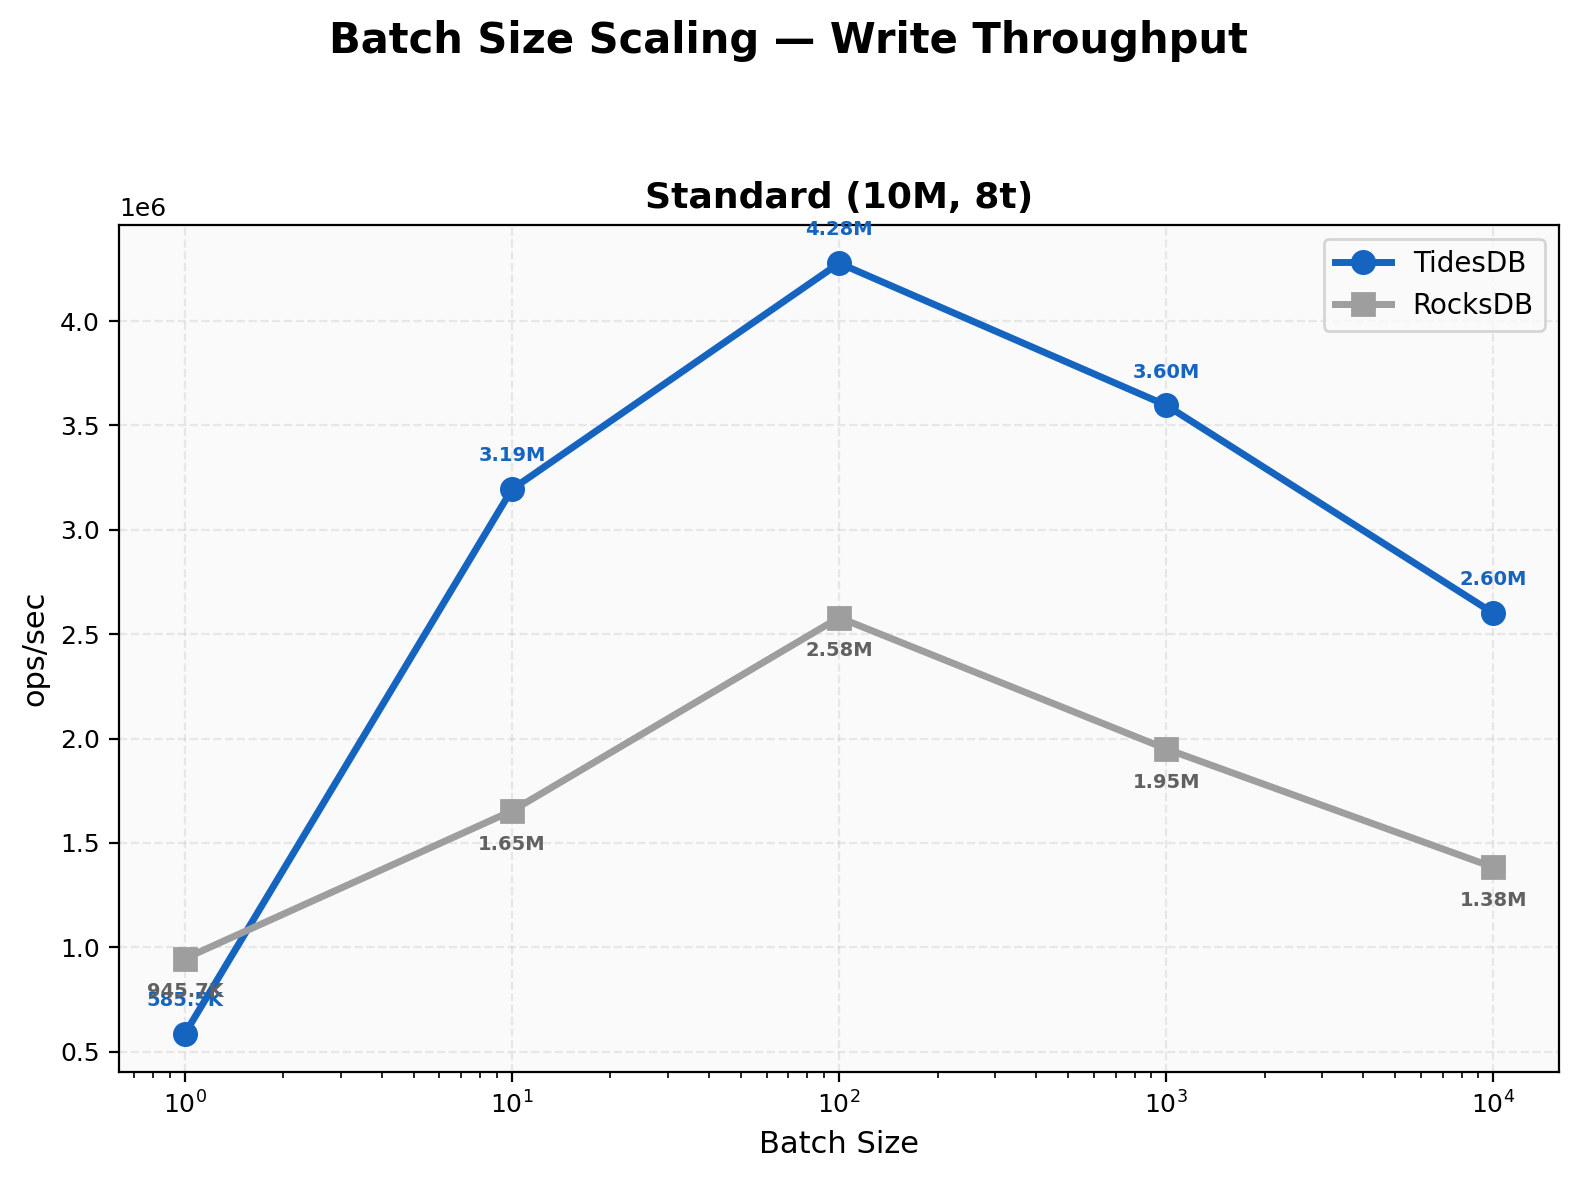
At batch size 1, RocksDB is faster at 946K ops/sec versus TidesDB at 586K. The per-operation overhead is higher for TidesDB when writing individual keys. At batch 10 TidesDB jumps to 3.19M and takes the lead. Peak throughput for TidesDB arrives at batch 100 with 4.28M ops/sec while RocksDB peaks at 2.58M. Beyond batch 100 both engines taper slightly but TidesDB maintains a consistent 1.8-1.9x advantage through batch 10000.
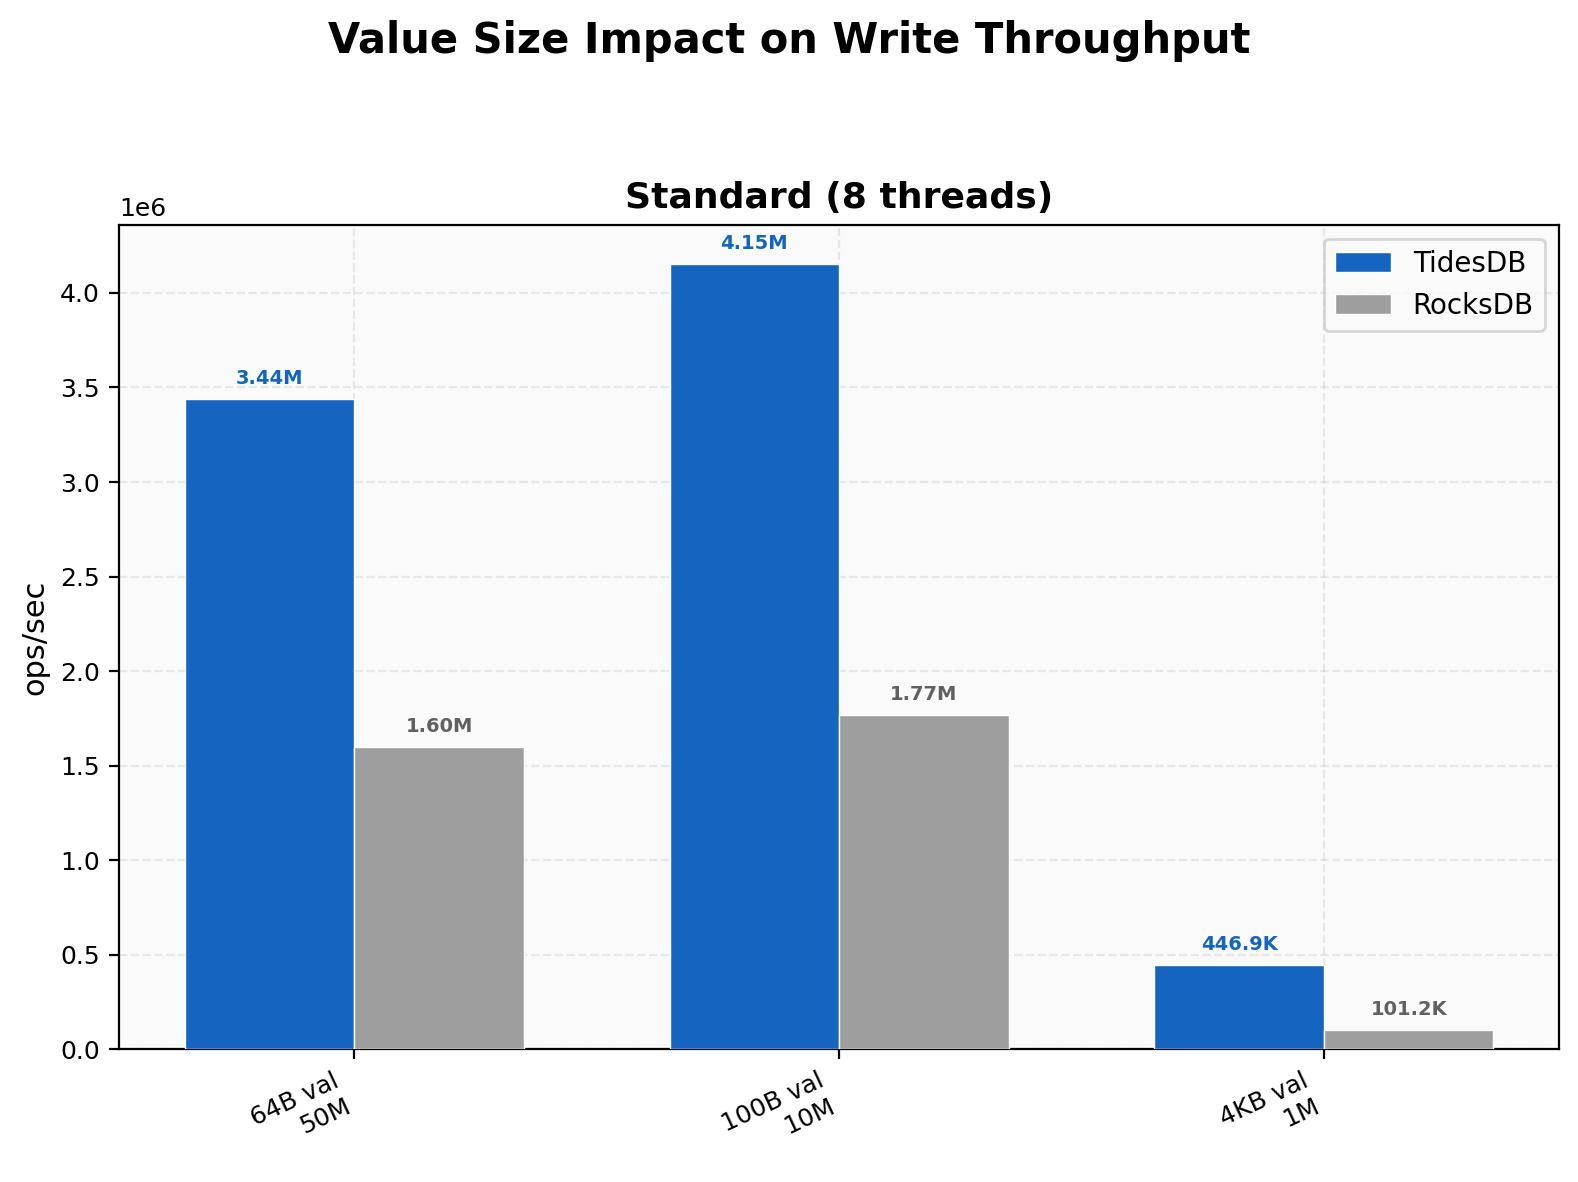
Small 64-byte values run at 3.44M ops/sec on TidesDB versus 1.60M on RocksDB. Default 100-byte values show 4.15M versus 1.77M. The most striking gap appears at 4KB values where TidesDB reaches 447K ops/sec and RocksDB drops to 101K, a 4.41x advantage. Larger values amplify the cost of RocksDB’s compaction overhead while TidesDB’s write path handles bulk data efficiently.
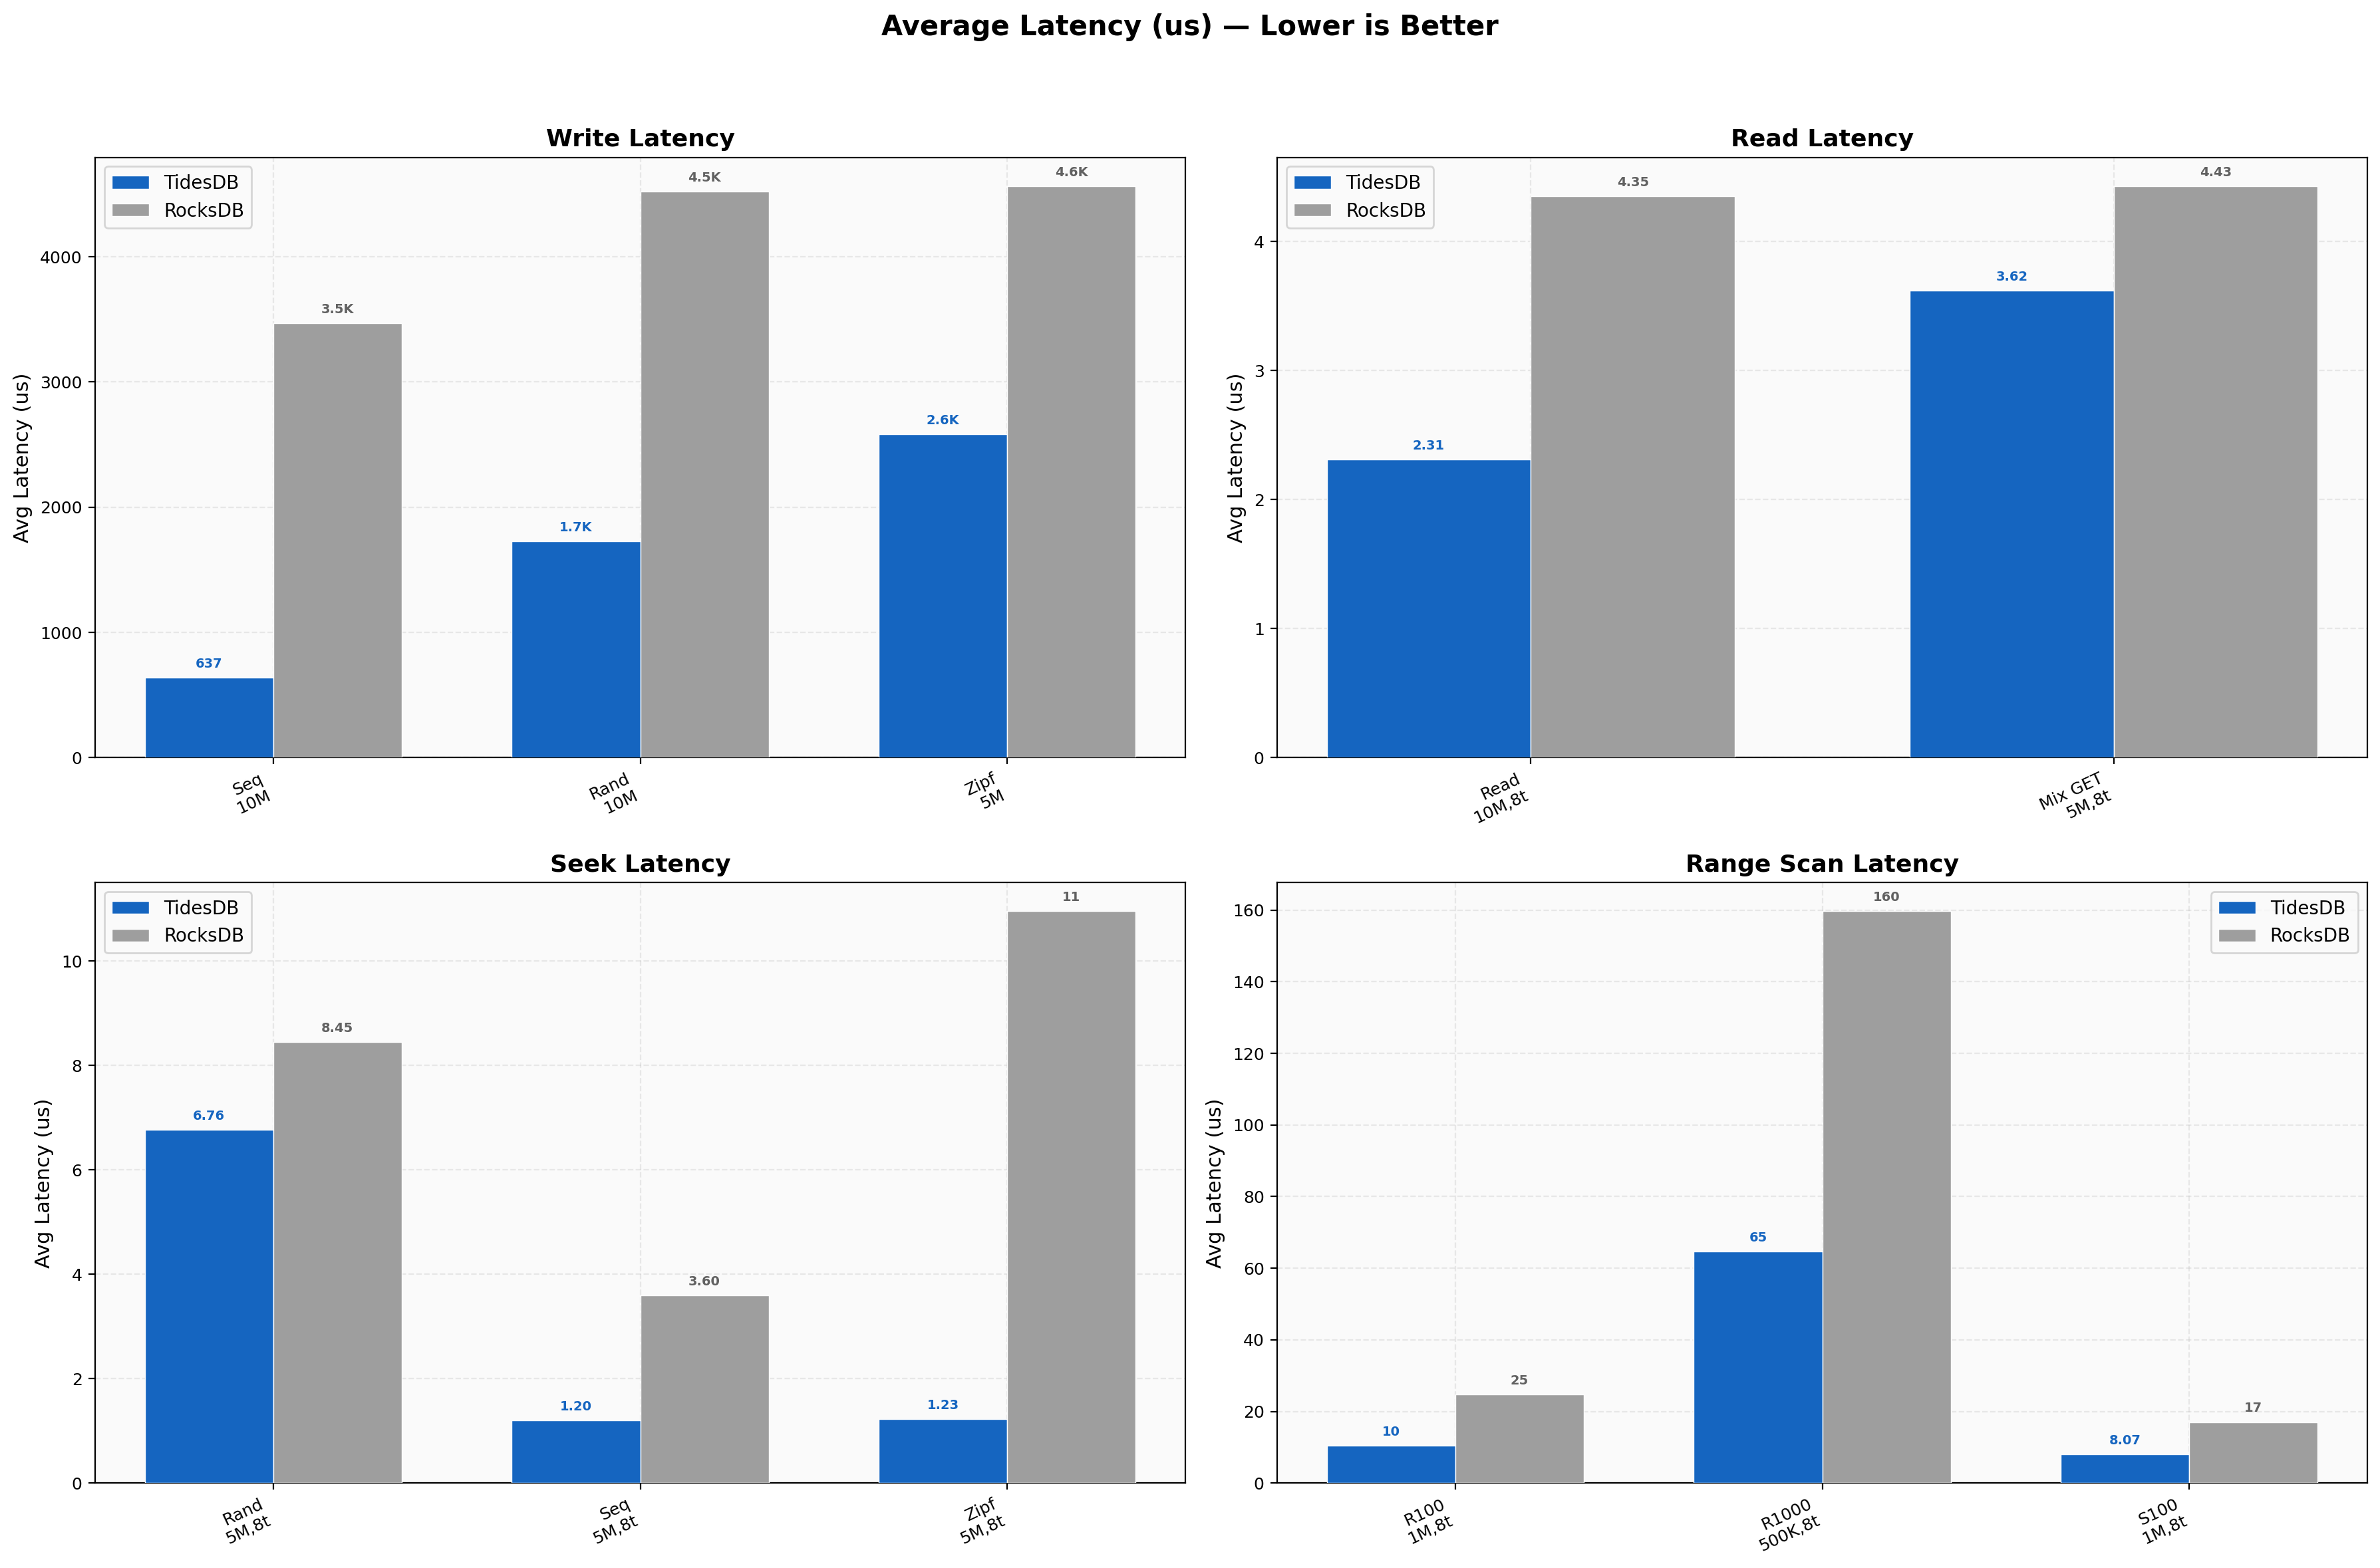
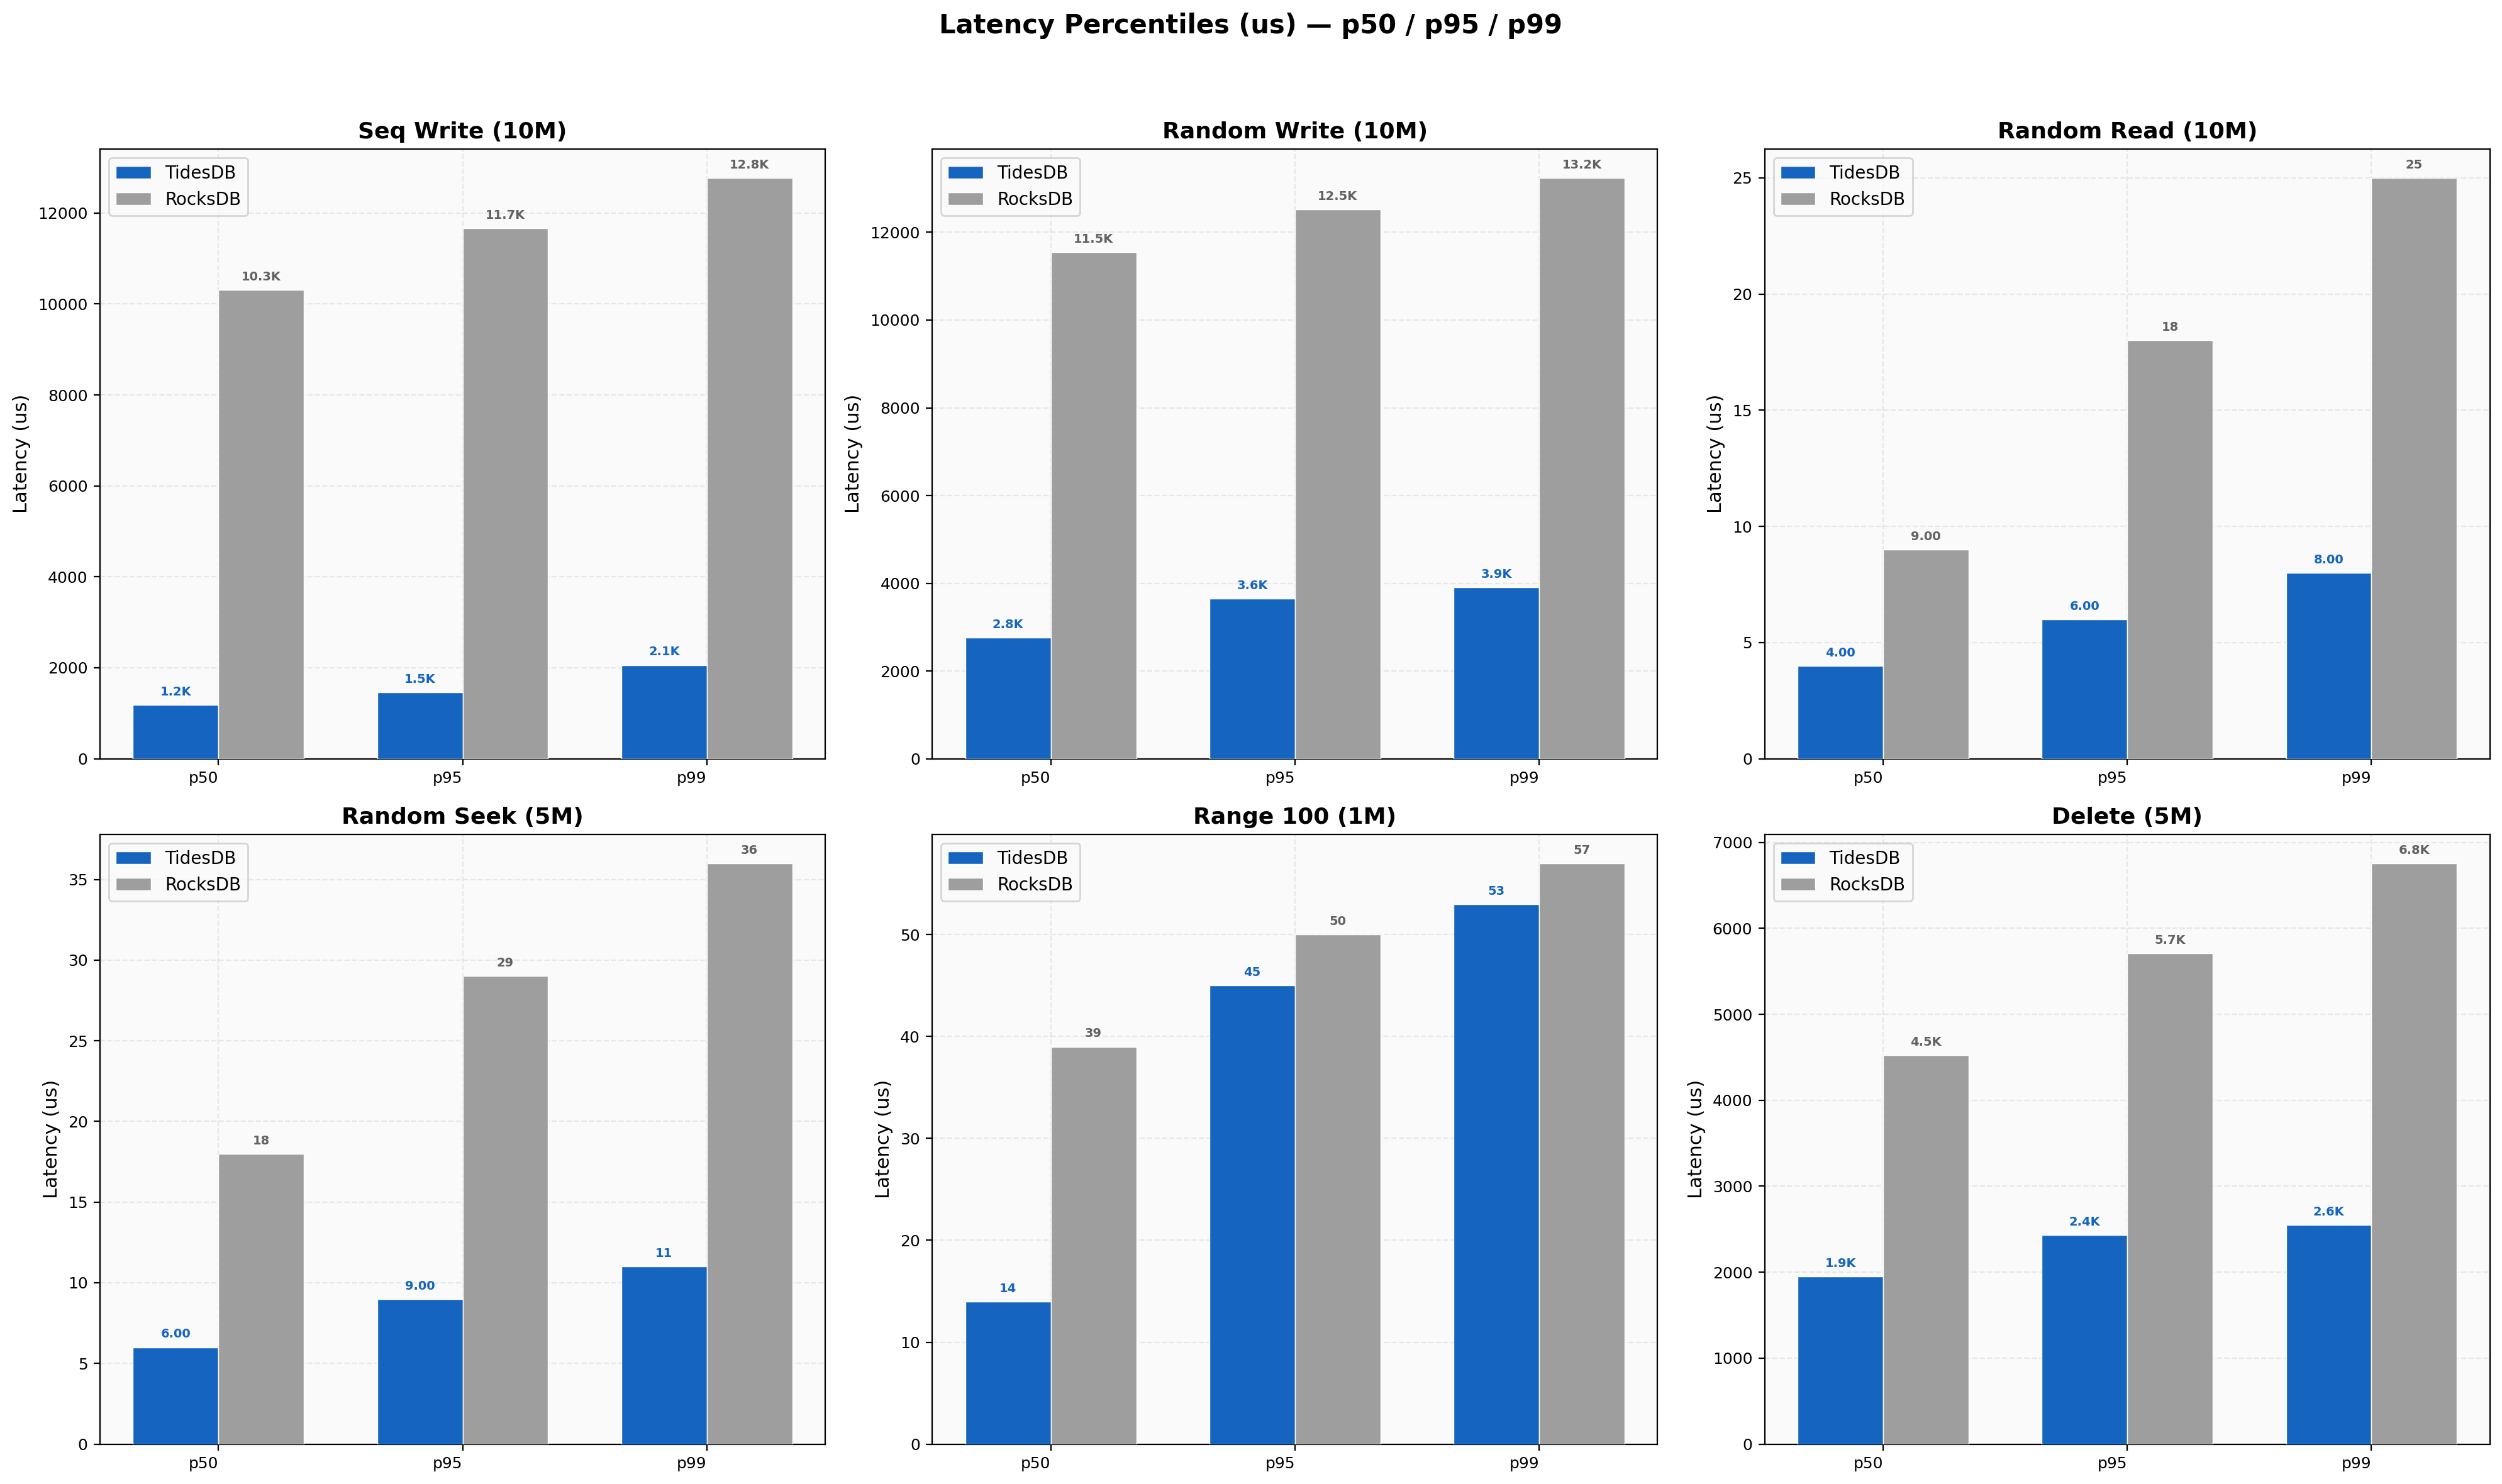
Write latencies on TidesDB run 3-5x lower than RocksDB across all access patterns. Sequential writes average 637us on TidesDB against 3471us on RocksDB. Read latencies are tight at 2.31us versus 4.35us for point reads. Seek latencies favor TidesDB by the widest margin on zipfian access at 1.23us versus 10.95us. Range scan latencies follow the same trend with 1000-key random scans at 65us on TidesDB versus 160us on RocksDB.
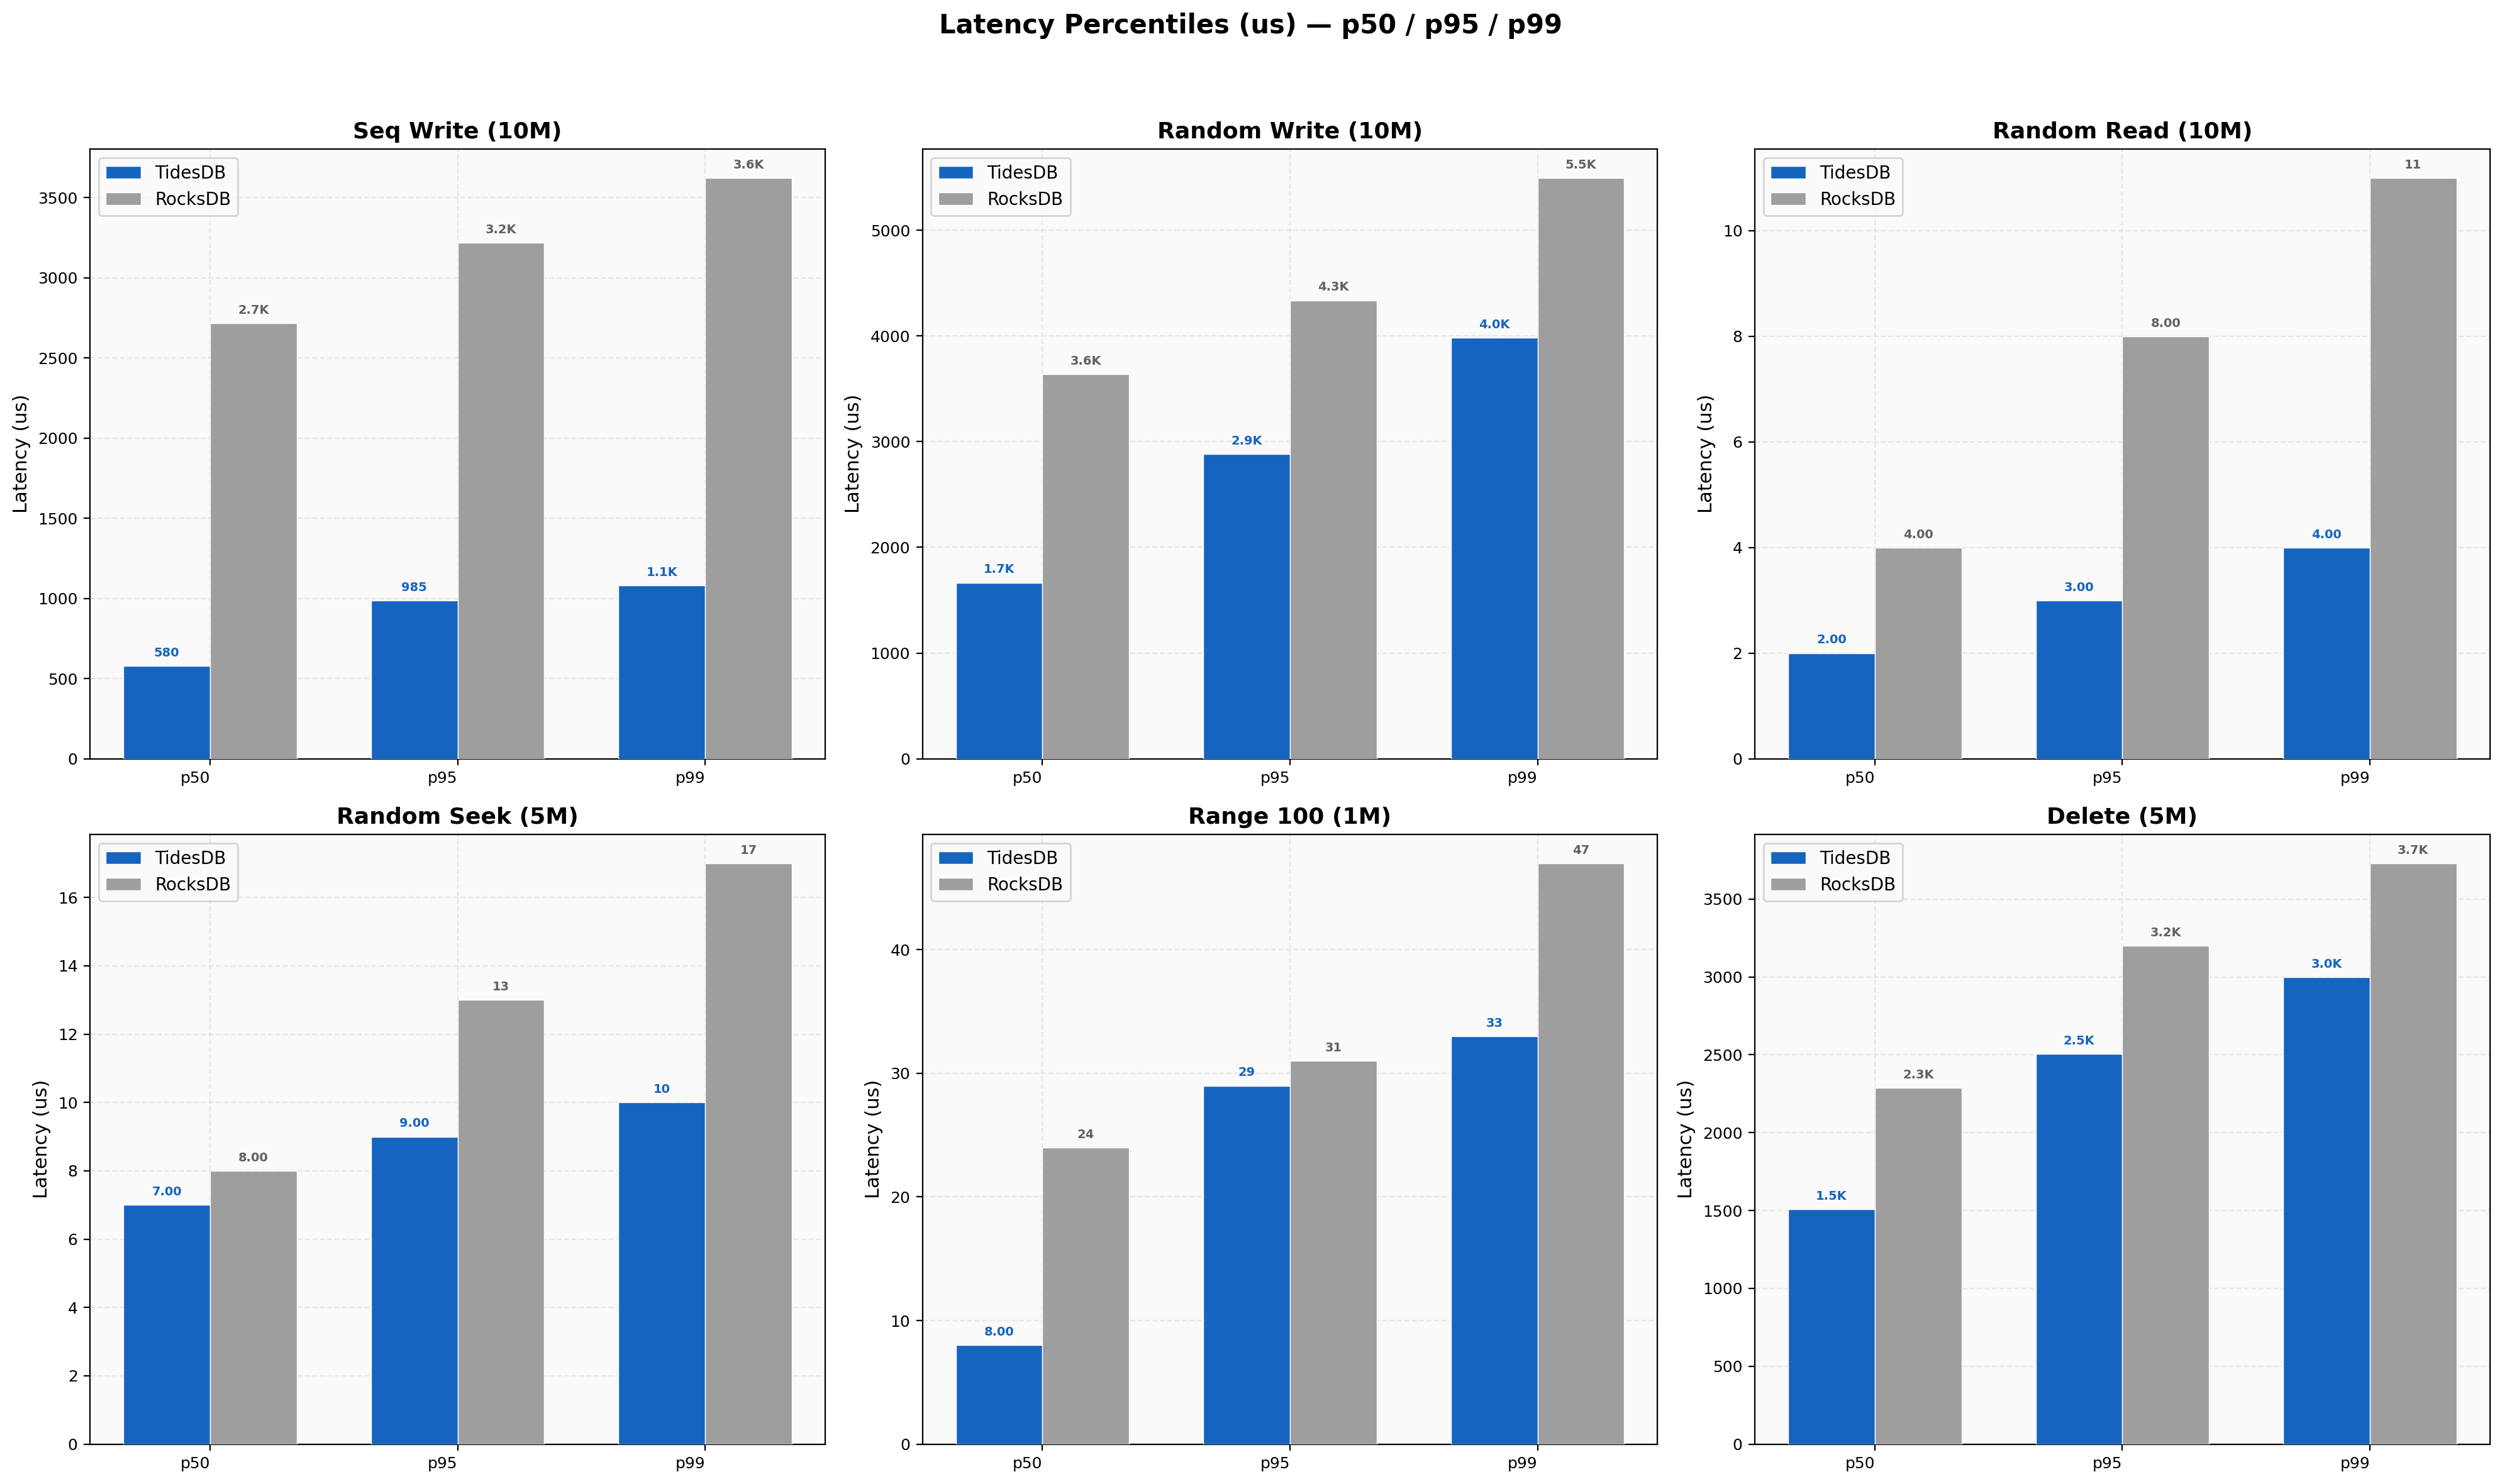
On sequential writes TidesDB’s p99 sits at 1082us against RocksDB at 3623us. Random read p99 is 4us on TidesDB versus 11us on RocksDB. The spread between p50 and p99 on TidesDB remains tight across all six workloads. RocksDB shows wider p50-to-p99 gaps especially on write-heavy tests where background compaction can introduce jitter. Delete p99 on TidesDB lands at 3000us versus 3730us on RocksDB.
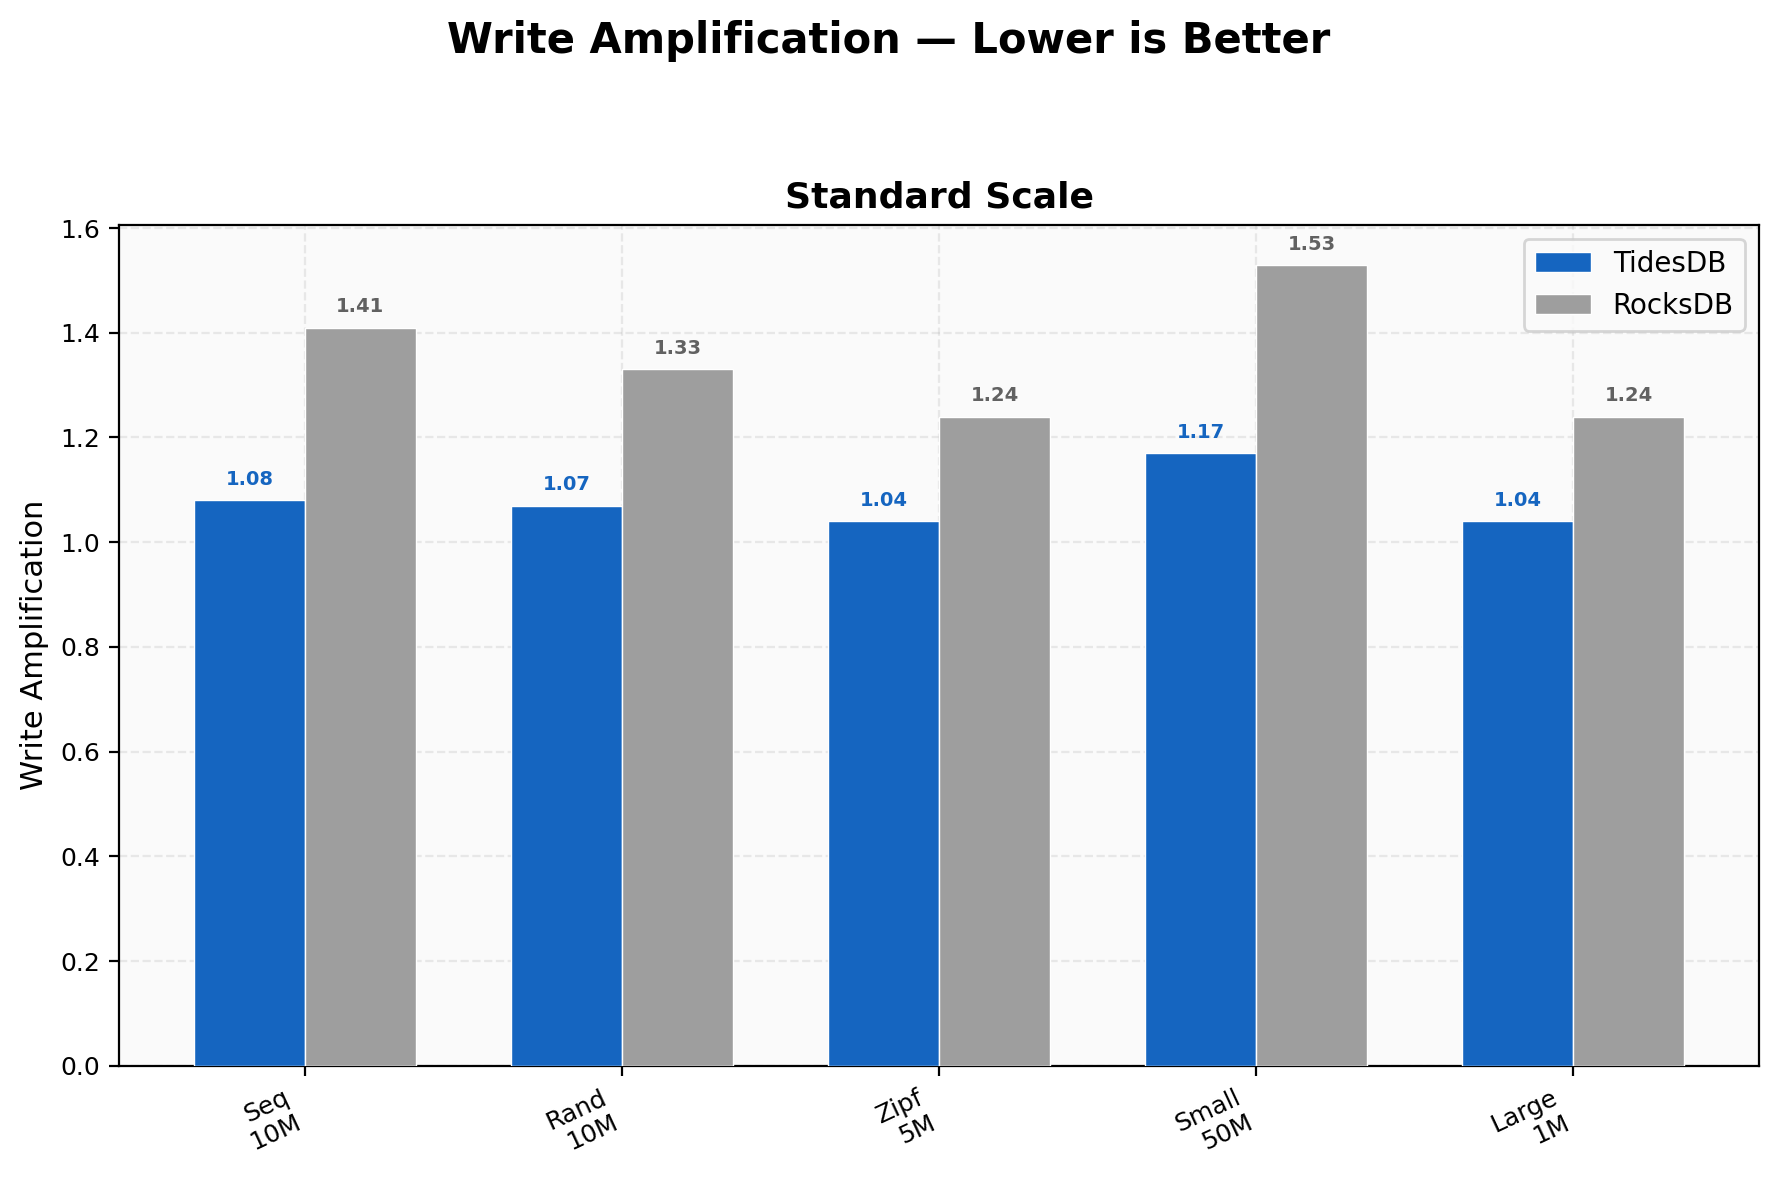
TidesDB holds write amplification between 1.04 and 1.17 across all workloads. RocksDB ranges from 1.24 to 1.53. The gap is widest on small value writes at 50M keys where TidesDB sits at 1.17 and RocksDB at 1.53. Lower write amplification means less total I/O per logical write which directly translates to better SSD endurance and more consistent throughput over time.
On this i7-11700K with 48GB RAM and a SATA SSD, TidesDB v8.5.0 leads RocksDB v10.10.1 on every throughput and latency metric at 8 threads. The largest advantages appear on sequential and large-value writes where TidesDB reaches 4-4.5x the throughput. Read and seek workloads show 1.3-5x improvements. Write amplification stays below 1.2 for TidesDB in all cases. The single exception is batch-1 operations where RocksDB’s simpler per-key path is faster by up to 1.6x. Once batch sizes grow past 10, TidesDB takes over.
Environment 2
In environment 2 I run the benchtool as well but tidesdb_rocksdb.sh the standard base runner.
- AMD Ryzen Threadripper 2950X (16 cores 32 threads) @ 3.5GHz
- 128GB DDR4
- Ubuntu 22.04 x86_64
- GCC (glibc)
- XFS raw NVMe(SAMSUNG MZVLB512HAJQ-00000) w/discard, inode64, nodiratime, noatime, logbsize=256k, logbufs=8
| File Name | Format | SHA256 Checksum |
|---|---|---|
| tidesdb_rocksdb_benchmark_results_20260216_061038.csv | CSV | a21851cab4531fc3200aac7ed9c28688002c356bfb1460371d0763a0e827bb93 |
| tidesdb_rocksdb_benchmark_results_20260216_061038.txt | TXT | 65d671b8d933fc28a501dac1b032247e15ba63276dc504ebefe0d14effab3a01 |
This environment exercises both 8-thread and 16-thread configurations the full benchtool suite, with and 6GB caches across on the second half of the runs. The Threadripper 2950X is an older platform with more cores at a lower clock speed than the i7-11700K and the NVMe storage gives both engines faster I/O than the SATA drive in Environment 1. The additional 16-thread tests reveal how each engine handles NUMA topology and higher parallelism.
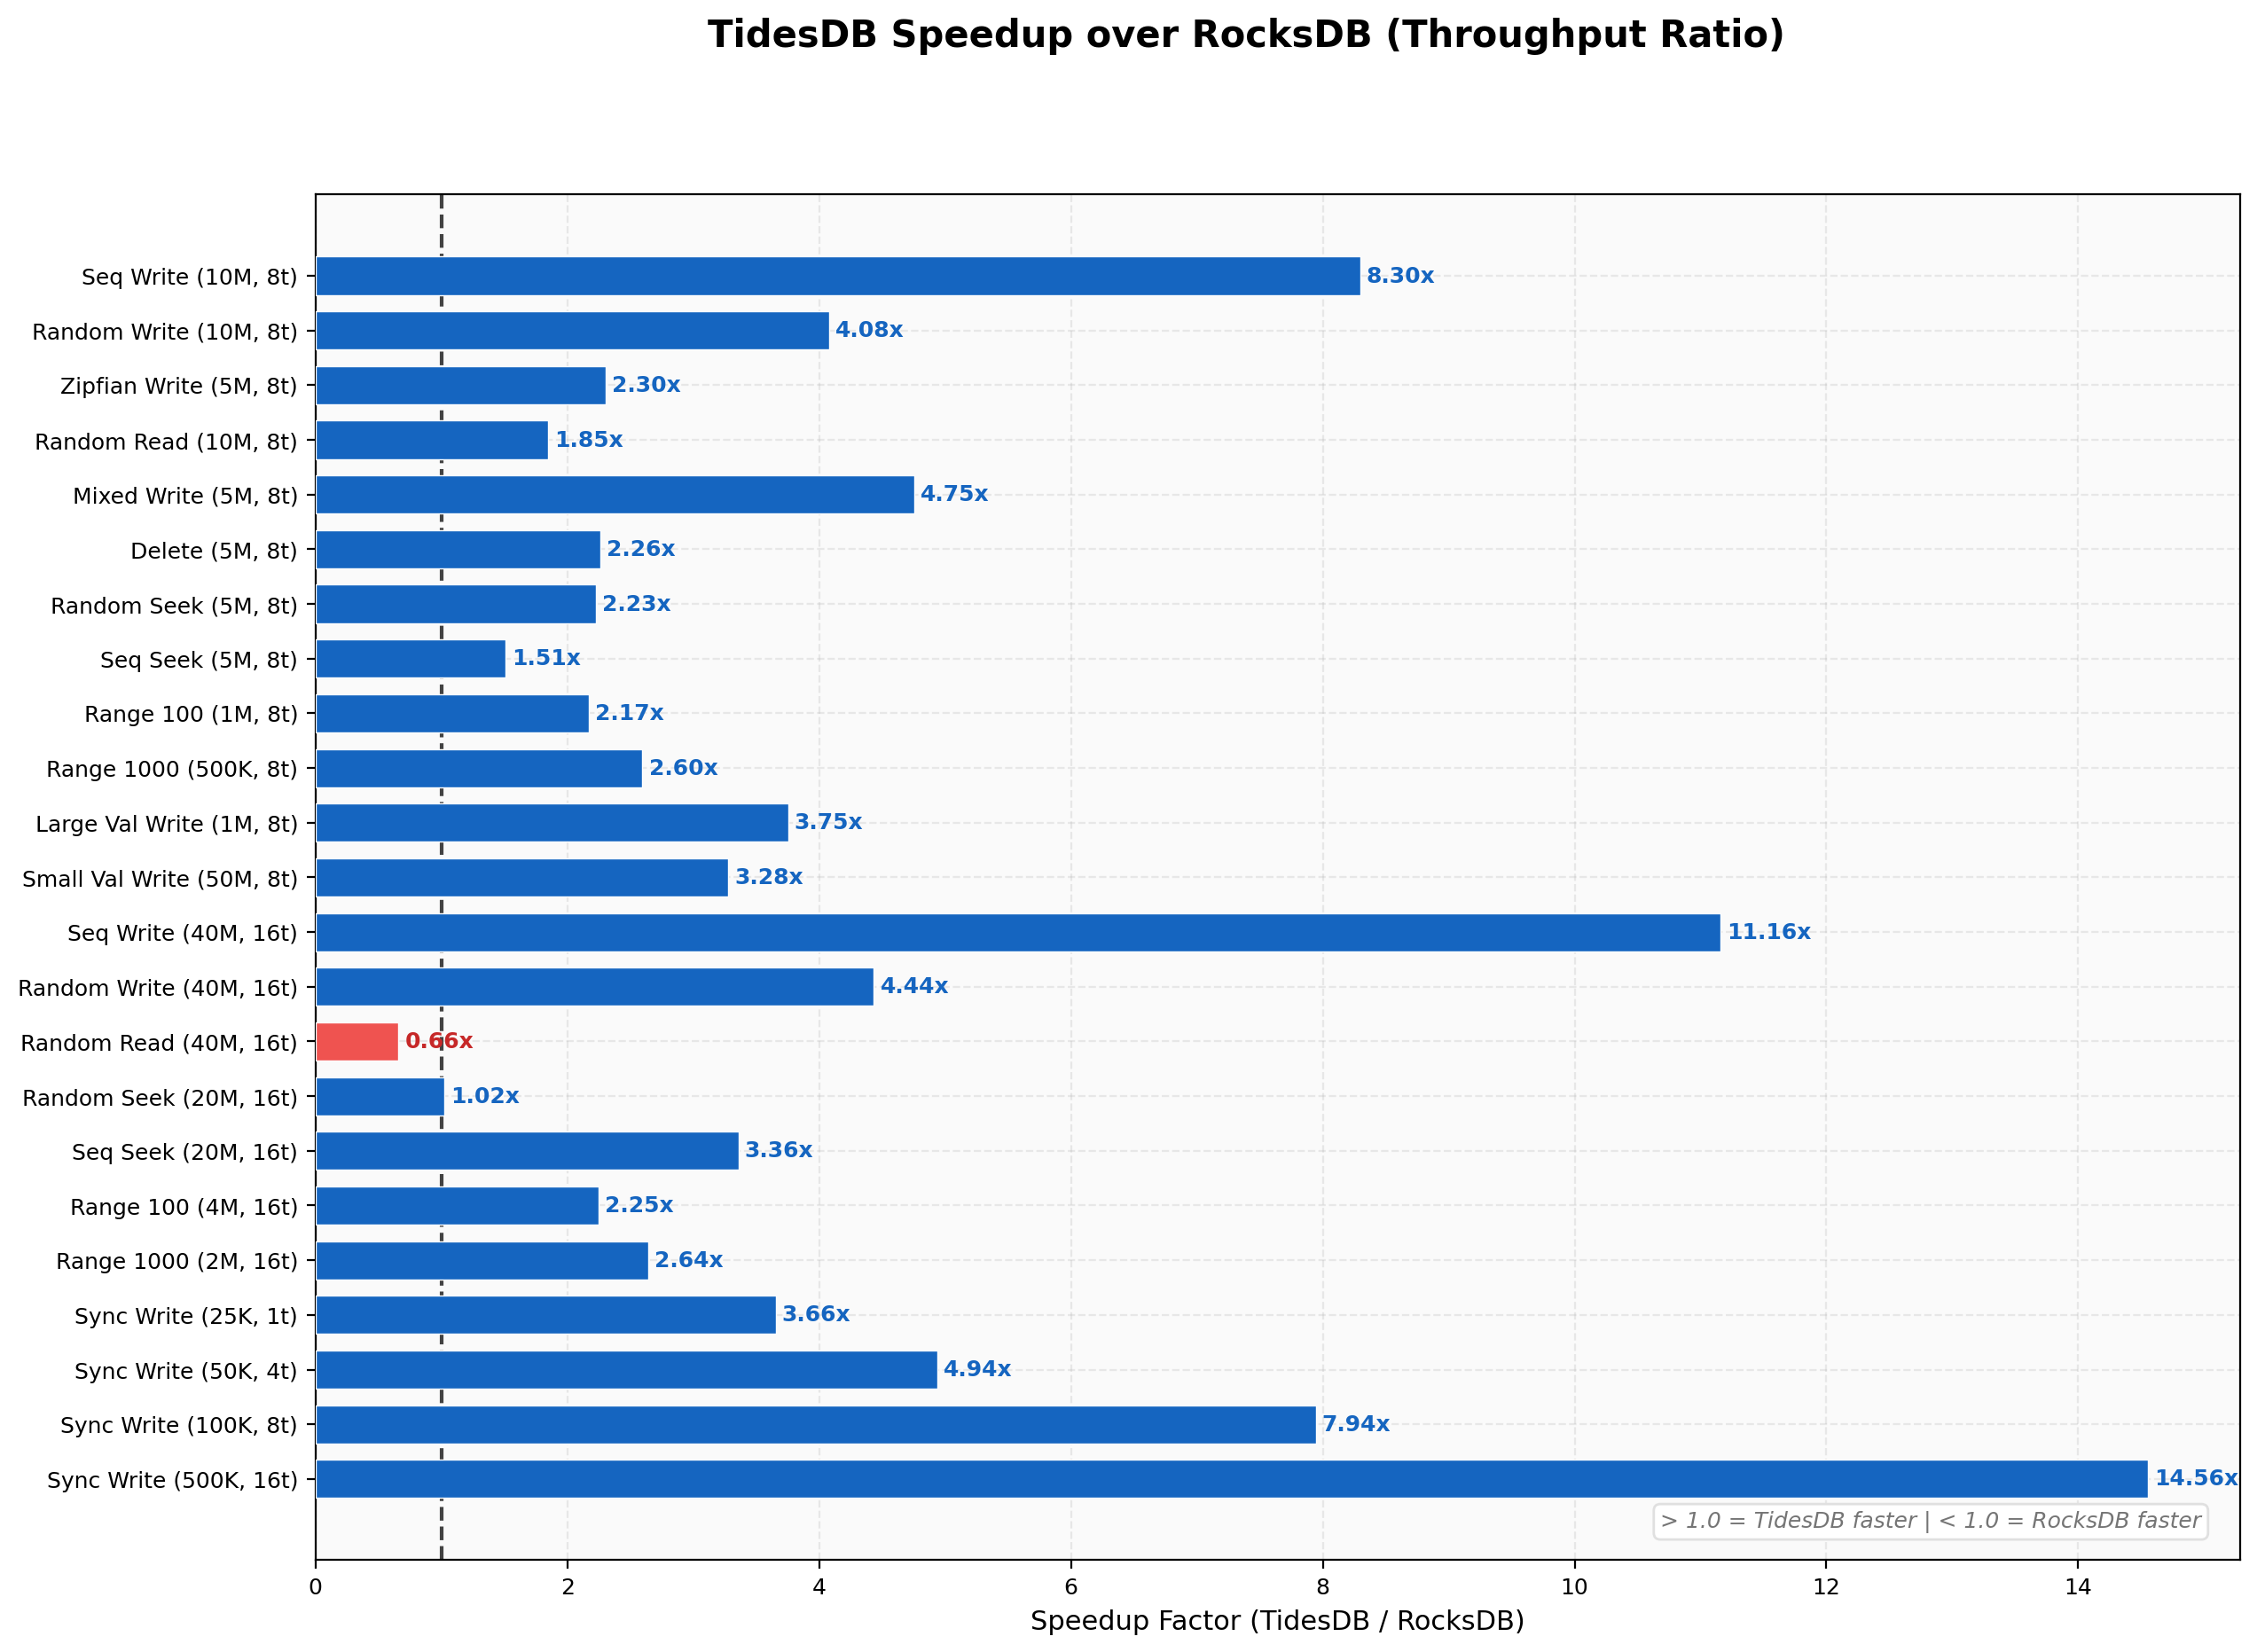
The speedup chart covers over 20 workloads spanning 8 and 16 threads. TidesDB leads on nearly all of them. Sequential writes at 16 threads show the largest gap at 11.16x. Sync writes scale from 3.66x at 1 thread up to 14.56x at 16 threads. The one notable exception is random reads on 40M keys at 16 threads where RocksDB reaches 2.28M ops/sec against TidesDB at 1.50M, a 0.66x ratio. Batch-1 deletes and single-key writes also favor RocksDB as seen in Environment 1.
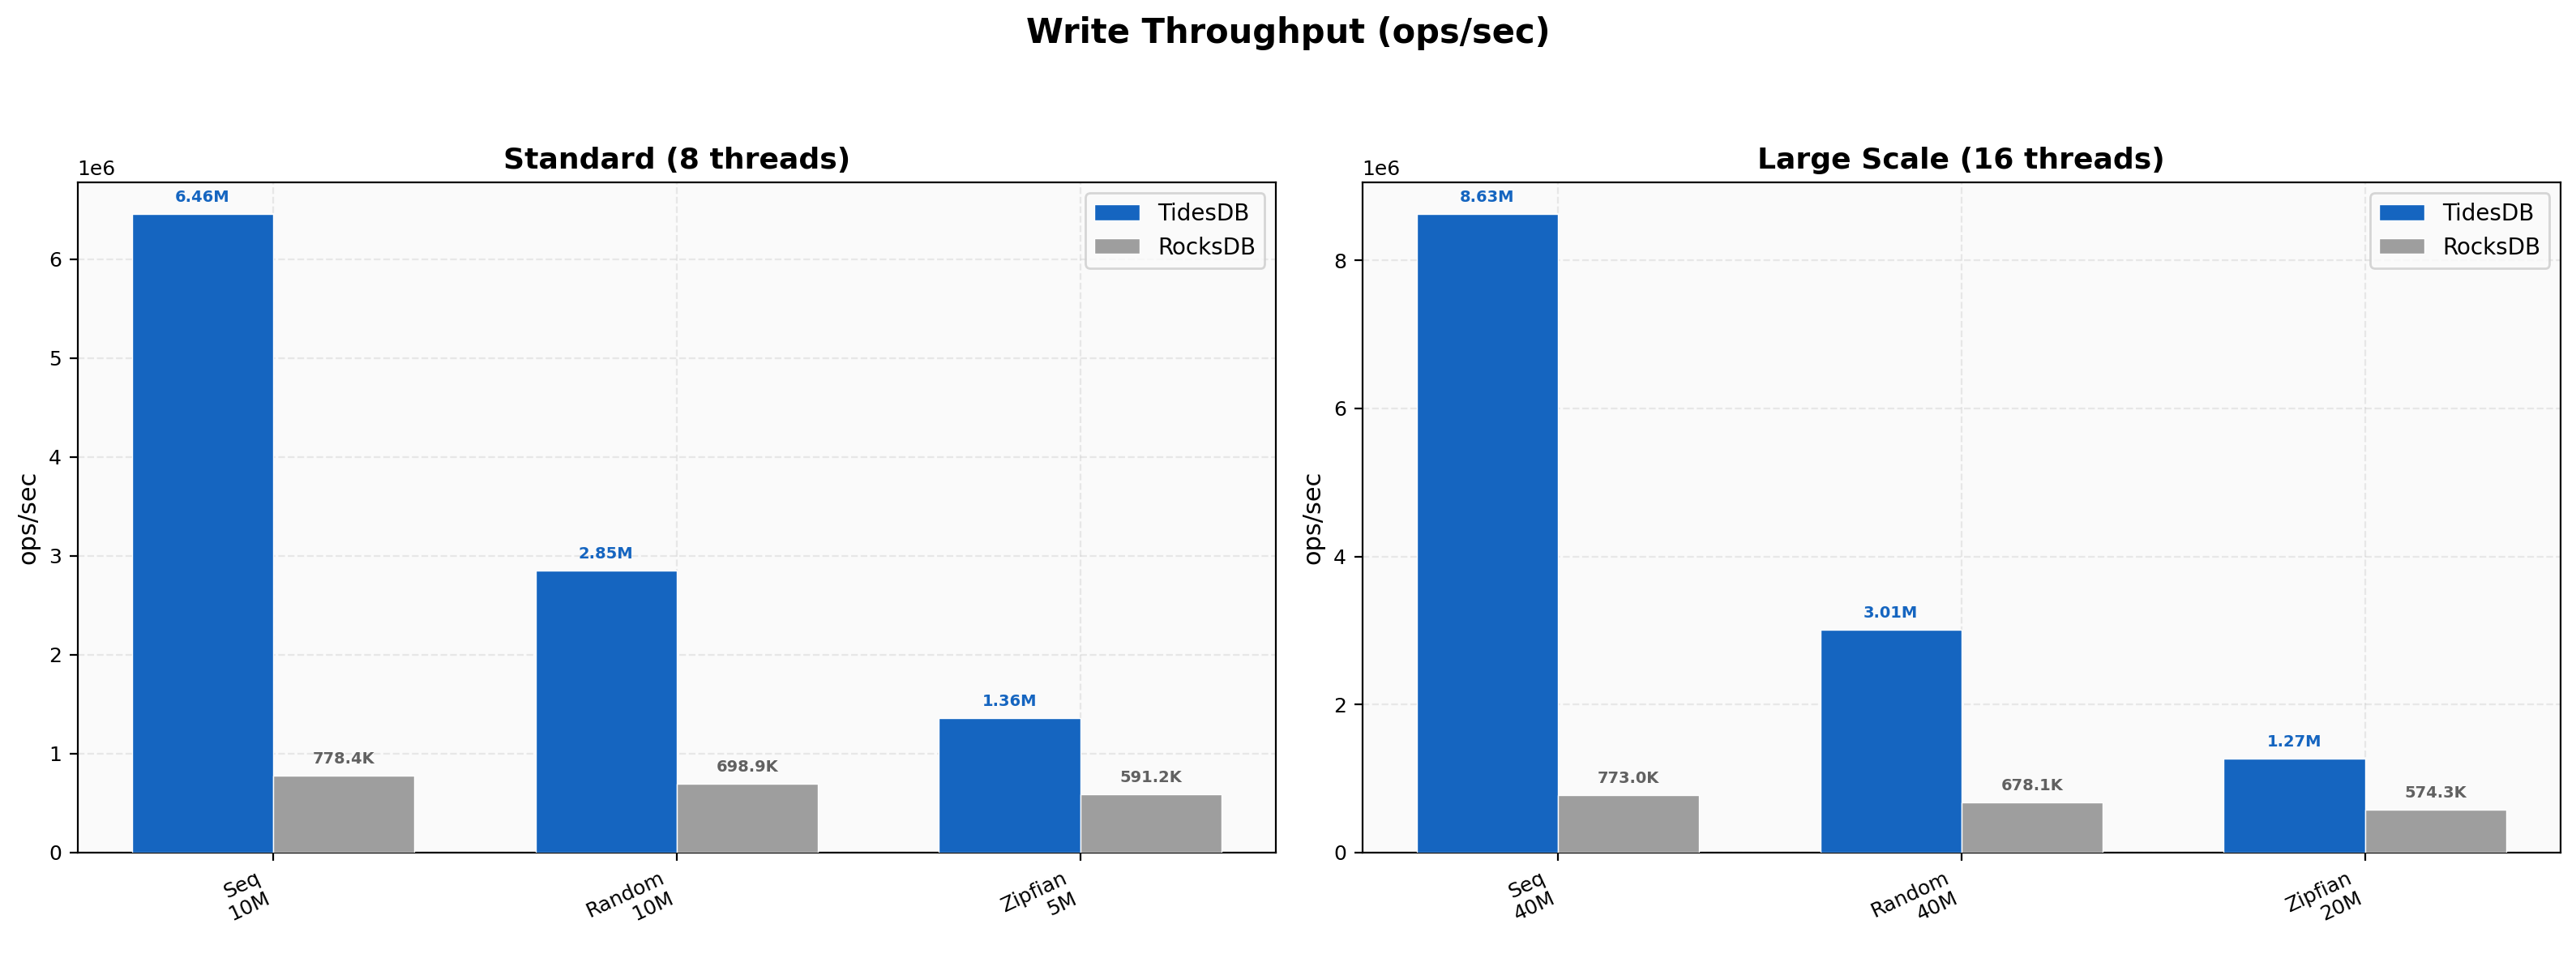
At 8 threads sequential writes hit 6.46M ops/sec on TidesDB versus 778K on RocksDB, an 8.30x gap. Random writes run at 2.85M versus 699K and zipfian at 1.36M versus 591K. Scaling to 16 threads pushes sequential writes to 8.63M against 773K, an 11.16x advantage. Random writes at 16 threads reach 3.01M versus 678K. RocksDB shows almost no throughput gain from the additional threads while TidesDB continues to scale.
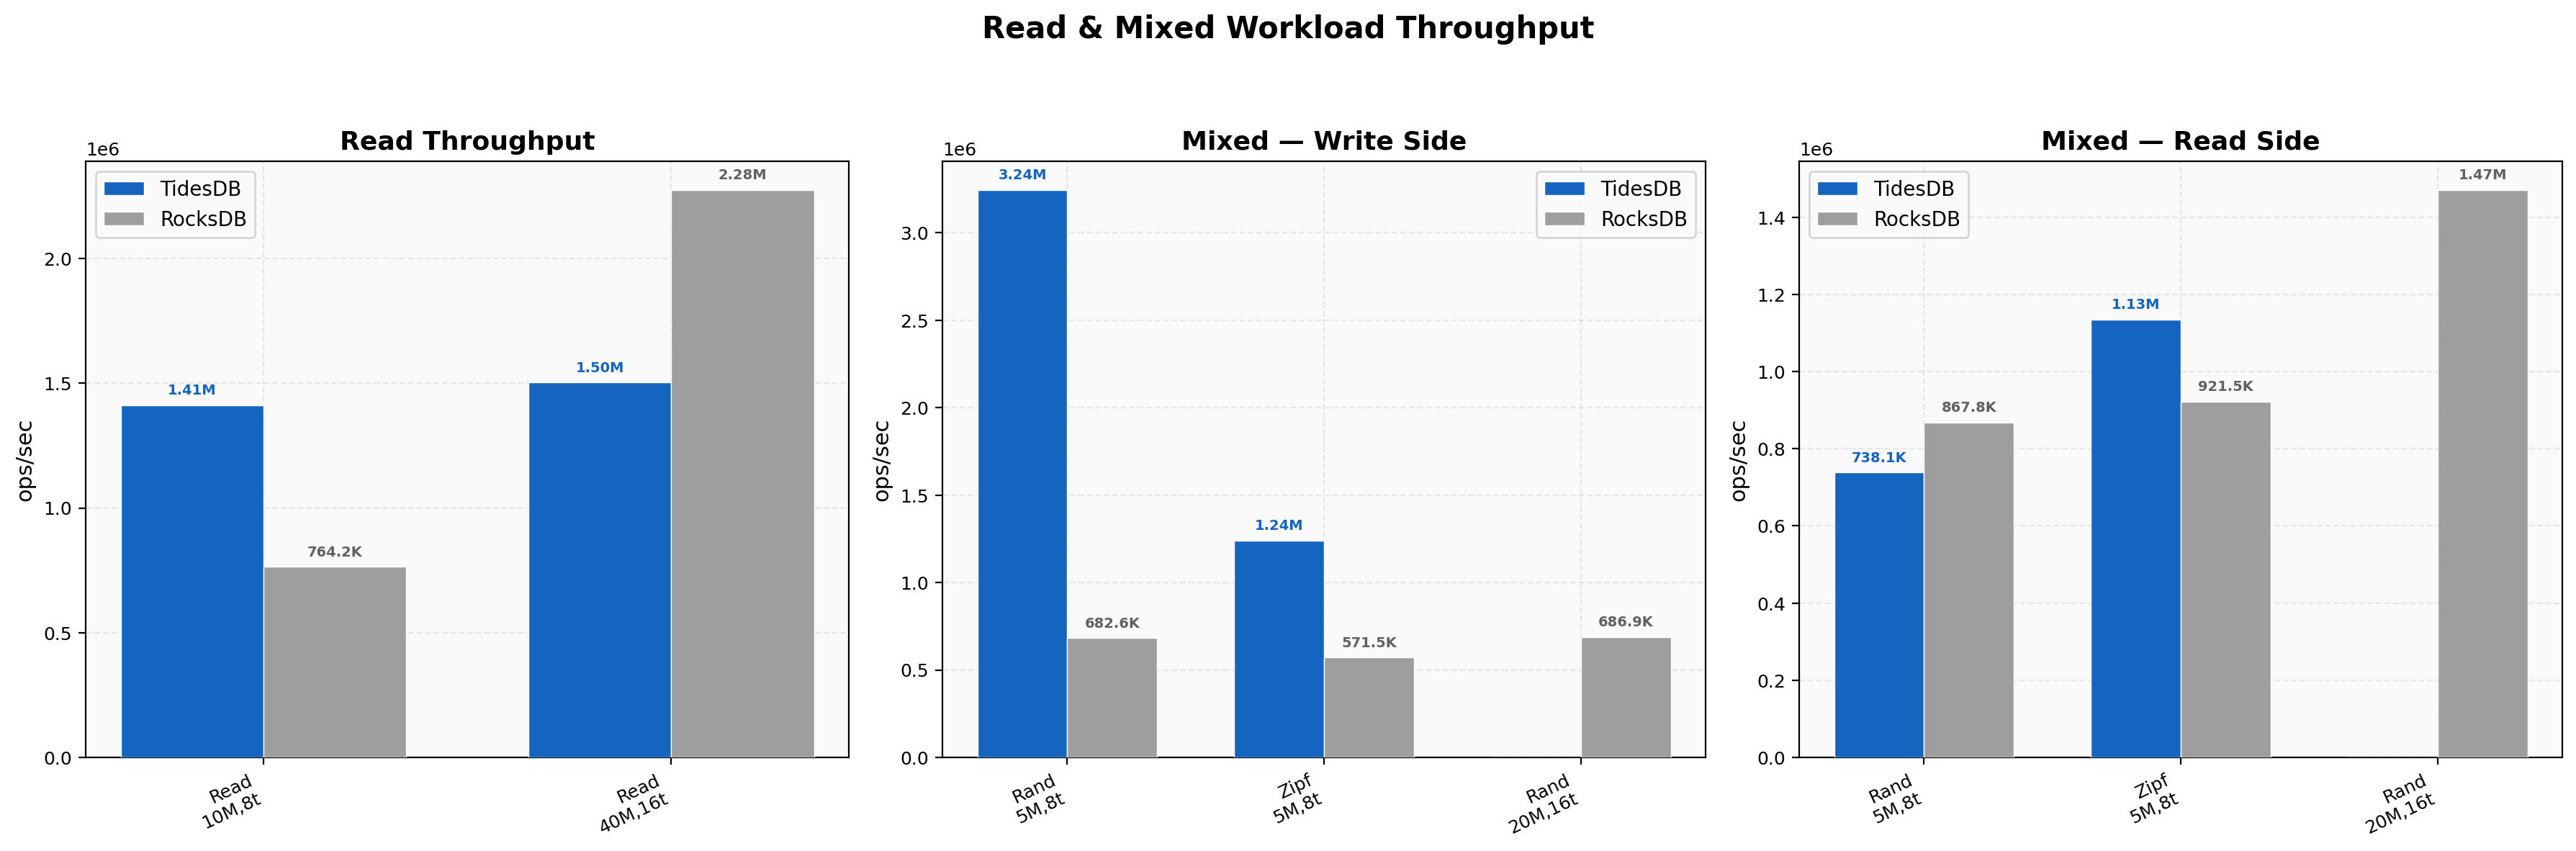
Point reads at 8 threads on 10M keys show TidesDB at 1.41M ops/sec versus 764K on RocksDB. At 16 threads on 40M keys the picture reverses and RocksDB pulls ahead at 2.28M versus 1.50M. This is the clearest RocksDB win in the entire benchmark. On the mixed write side TidesDB dominates at 3.24M versus 683K for random and 1.24M versus 571K for zipfian at 8 threads. The mixed read side at 8 threads shows RocksDB slightly ahead on random at 868K versus 738K while TidesDB wins zipfian reads at 1.13M versus 921K.
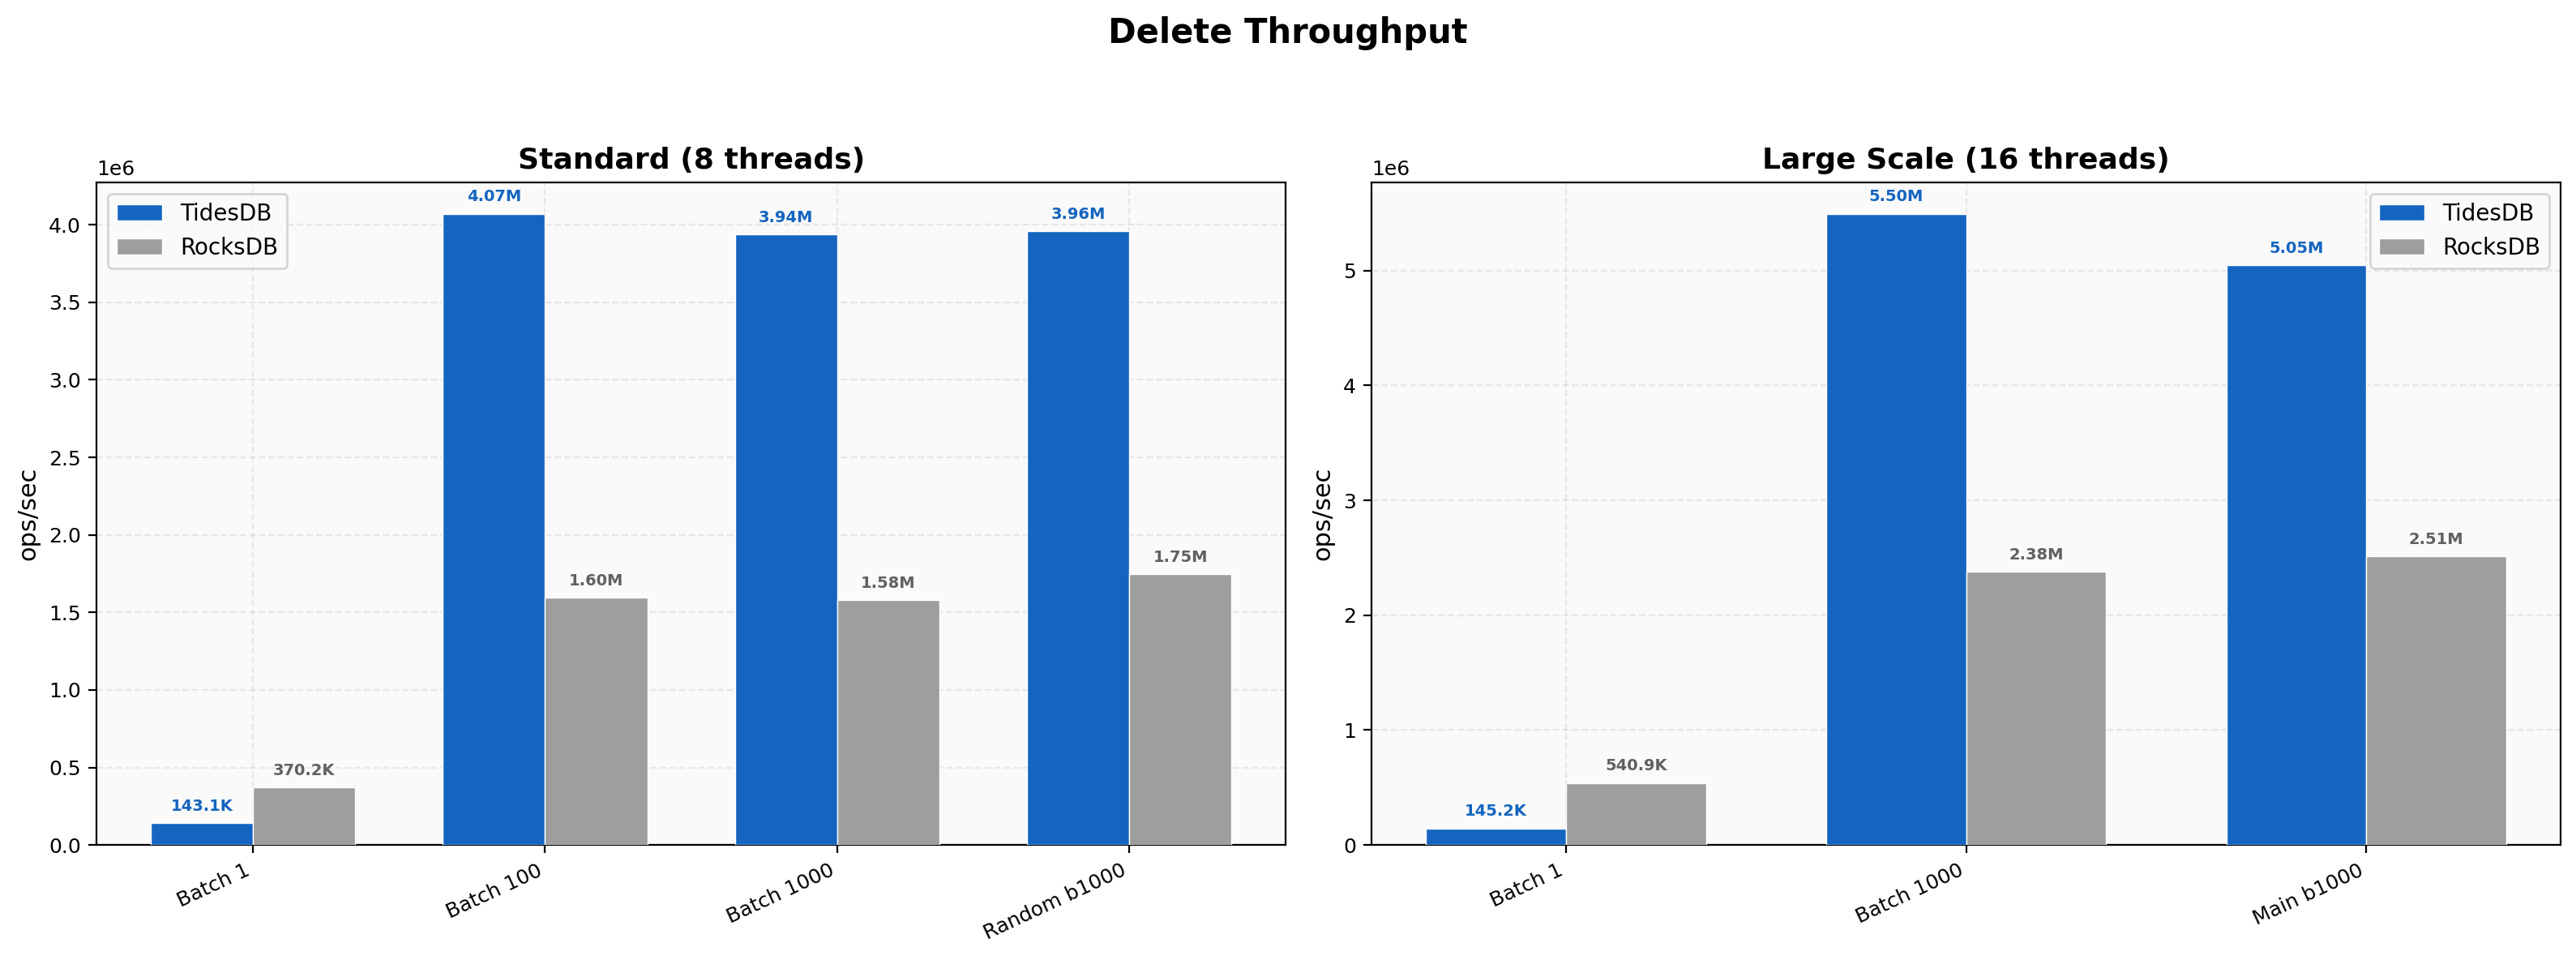
The pattern from Environment 1 repeats here. At batch size 1, RocksDB leads with 370K ops/sec versus TidesDB at 143K at 8 threads and 541K versus 145K at 16 threads. Once batch size reaches 100, TidesDB jumps to 4.07M at 8 threads and takes a 2.55x lead. At batch 1000 with 16 threads TidesDB reaches 5.50M versus 2.38M on RocksDB. The random delete test at 16 threads finishes at 5.05M for TidesDB against 2.51M.
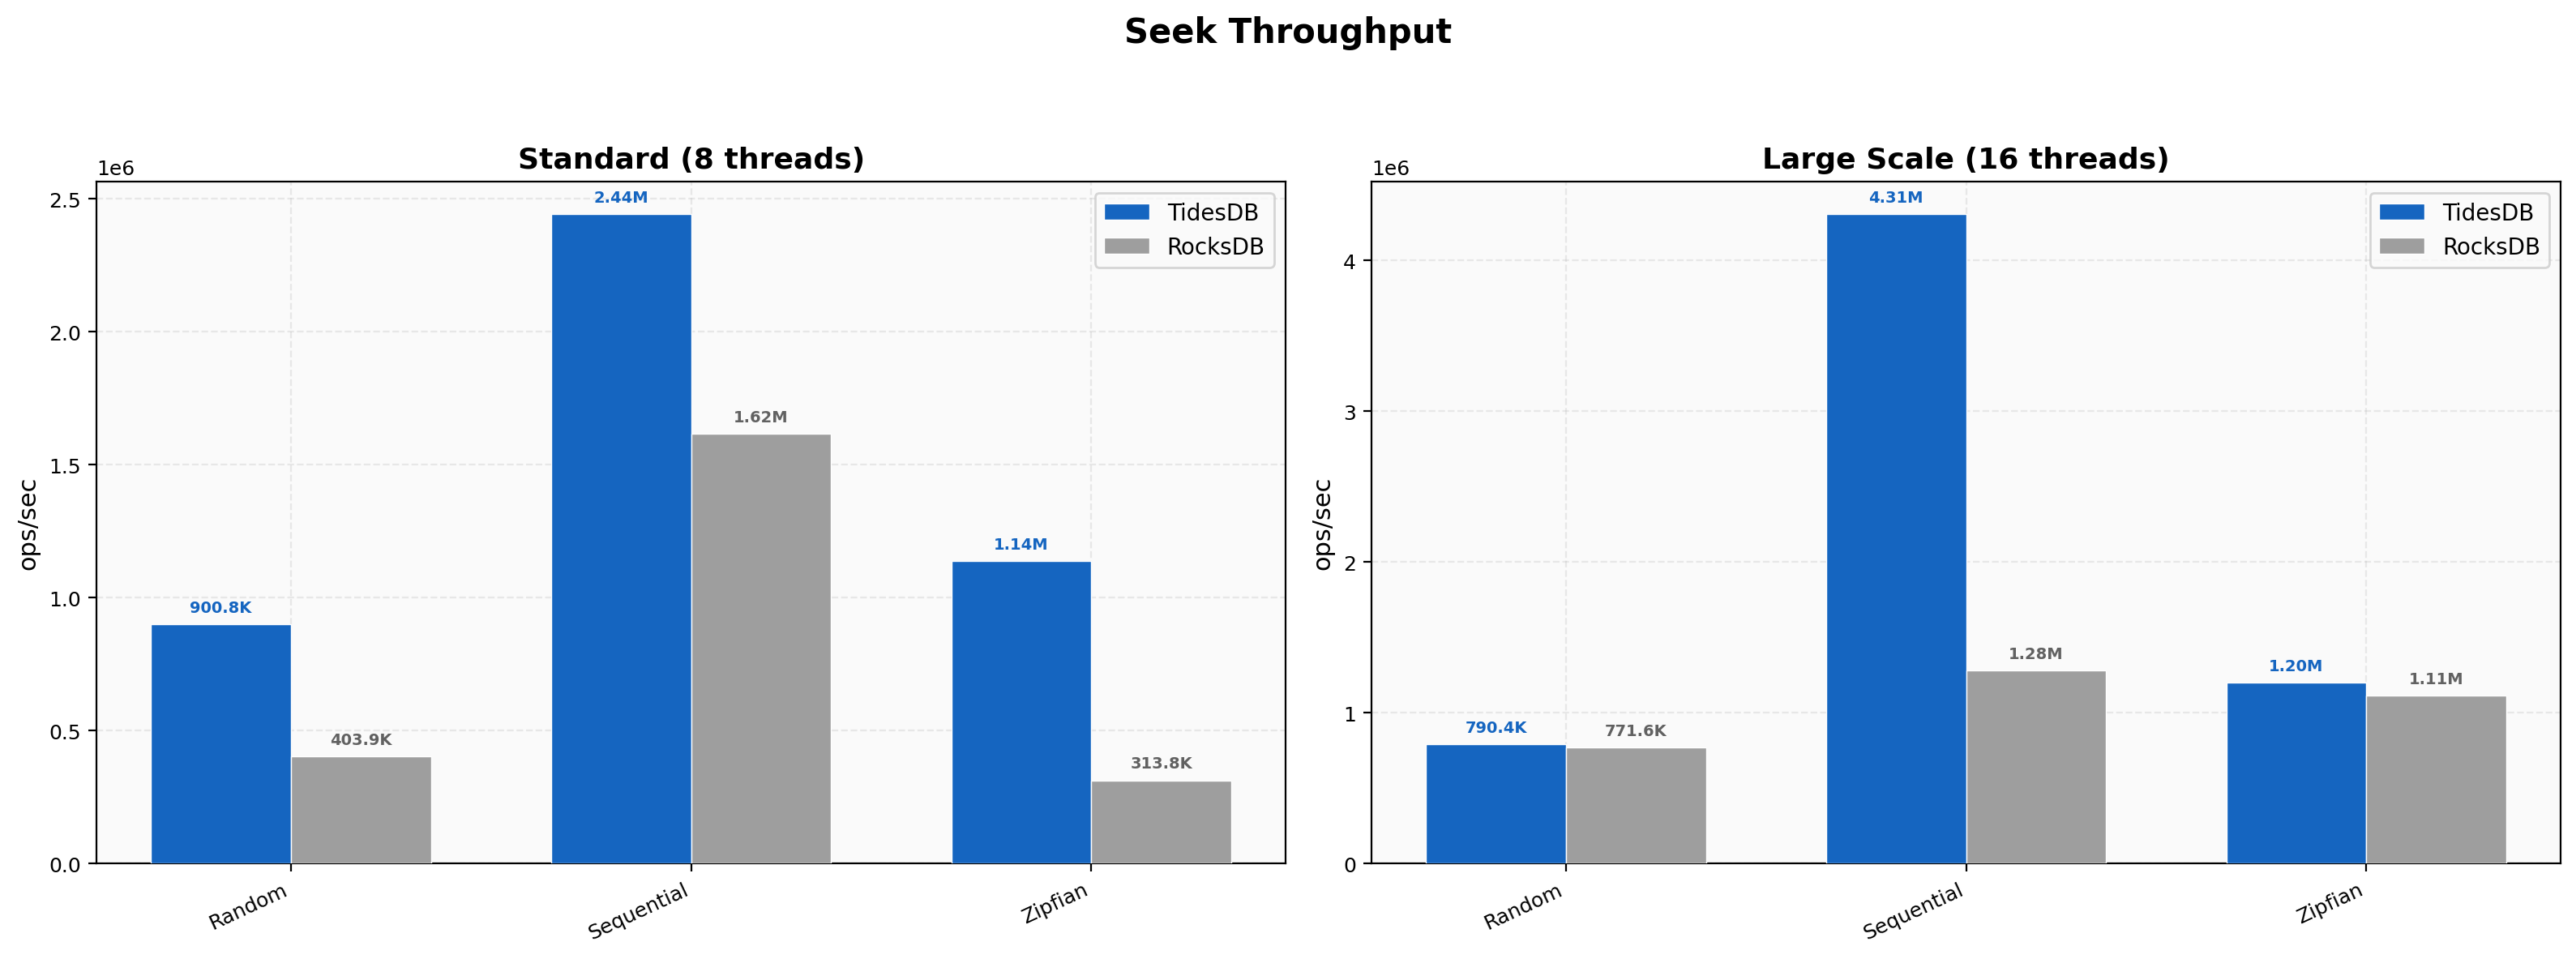
At 8 threads zipfian seeks show the widest gap with TidesDB at 1.14M versus 314K on RocksDB, a 3.62x lead. Sequential seeks run at 2.44M versus 1.62M. At 16 threads sequential seeks widen to 4.31M versus 1.28M, a 3.36x difference. Random seeks at 16 threads converge to near parity at 790K versus 772K. Zipfian seeks at 16 threads are also close at 1.20M versus 1.11M.
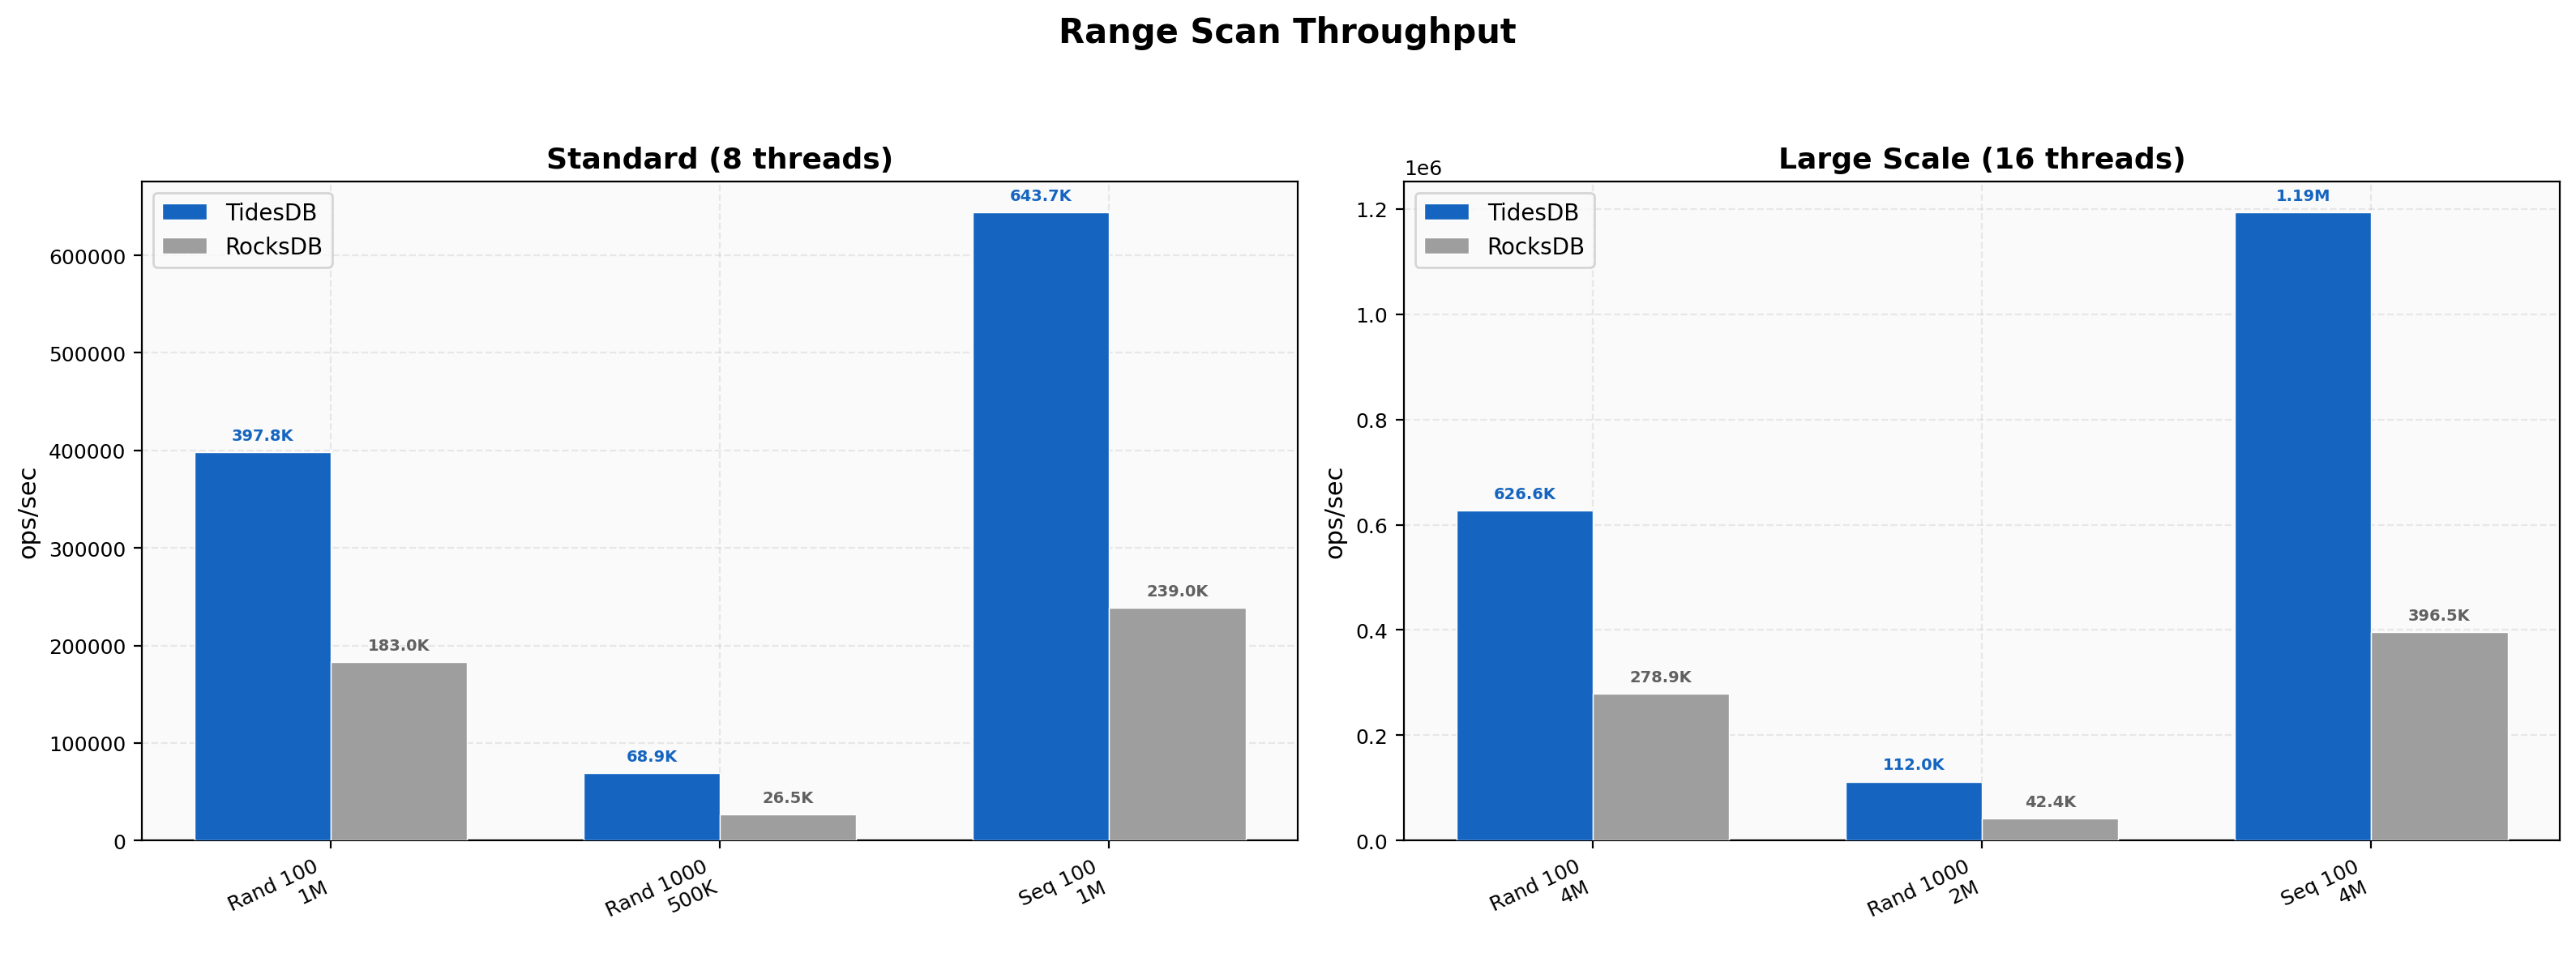
Range scans show consistent TidesDB leads across both thread counts. At 8 threads random 100-key ranges run at 398K versus 183K and sequential 100-key ranges at 644K versus 239K. At 16 threads sequential 100-key ranges reach 1.19M on TidesDB against 396K on RocksDB, a 3.01x lead. The 1000-key random scans hold steady at roughly 2.6x regardless of thread count with 112K versus 42K at 16 threads.
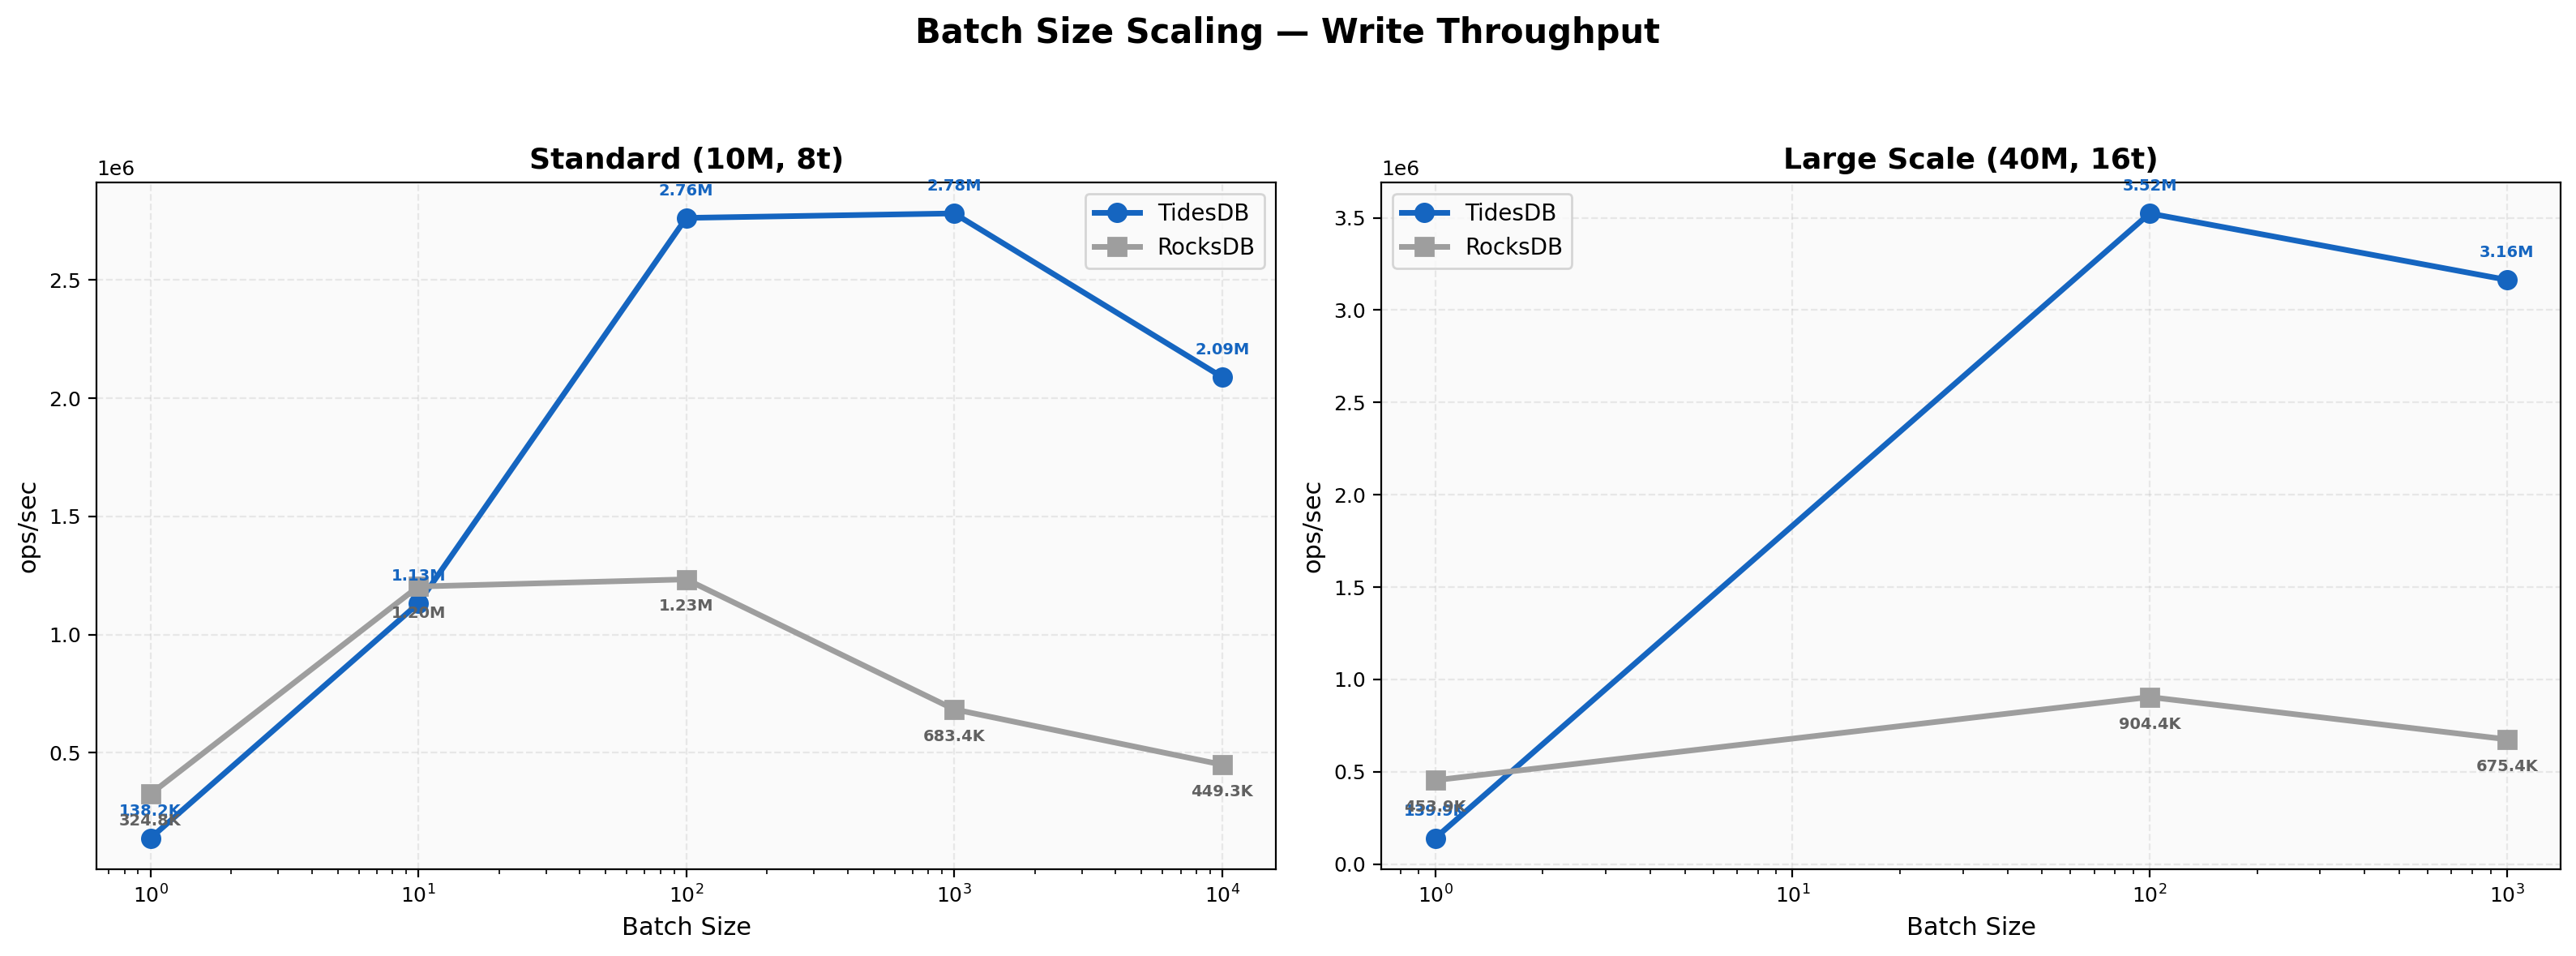
The 8-thread scaling curve shows RocksDB faster at batch 1 with 325K versus 138K and roughly even at batch 10 where both engines land near 1.1-1.2M. TidesDB takes over at batch 100 with 2.76M against 1.23M and the gap widens through batch 10000 where TidesDB hits 2.09M versus 449K, a 4.65x lead. The 16-thread panel reinforces this trend. At batch 1 RocksDB leads 454K to 140K but by batch 1000 TidesDB reaches 3.16M versus 675K, a 4.68x advantage. TidesDB’s batch amortization scales better with both batch size and thread count.
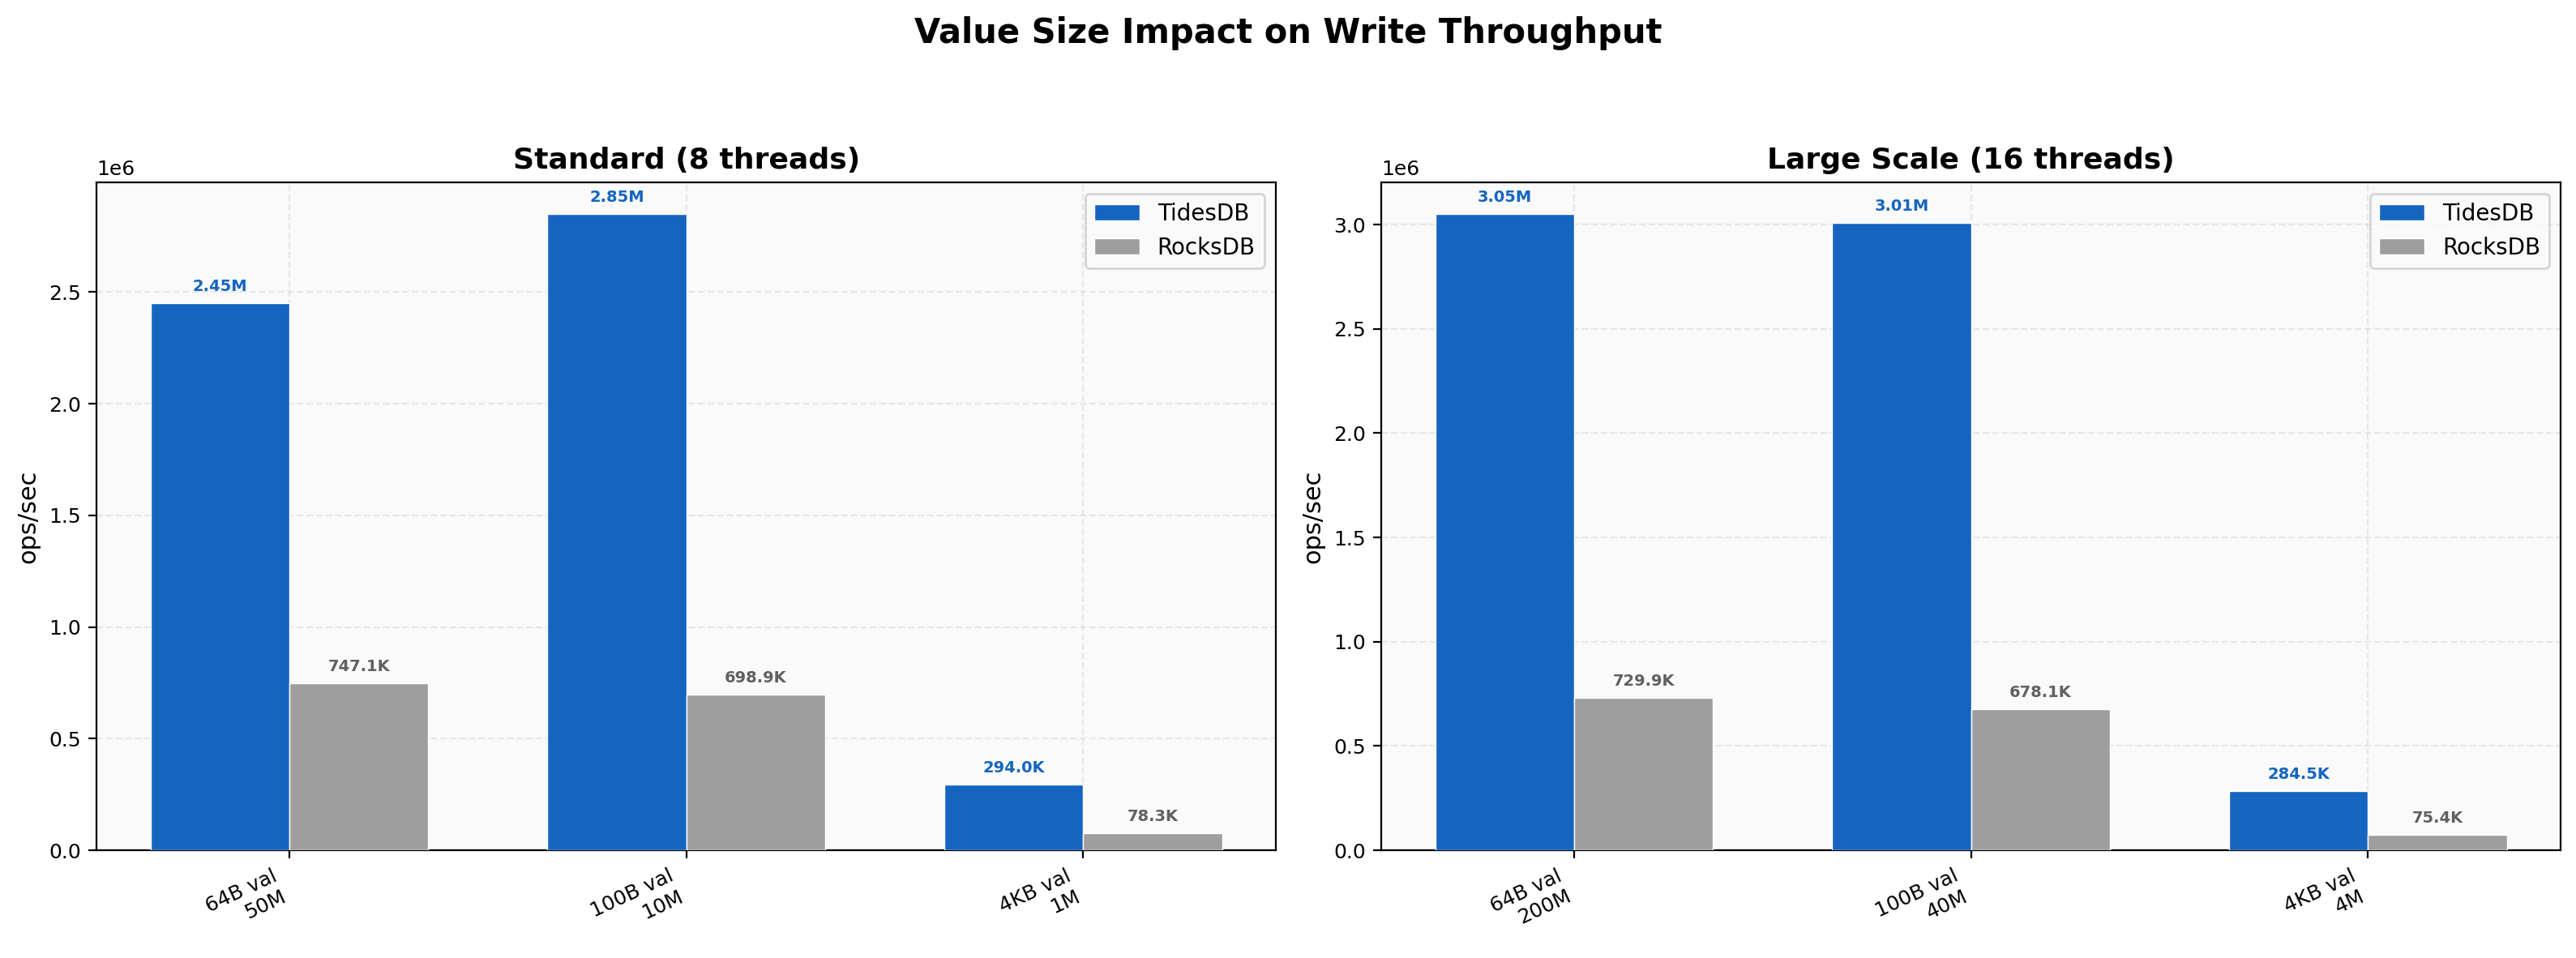
At 8 threads 64-byte values run at 2.45M on TidesDB versus 747K on RocksDB. Default 100-byte values show 2.85M versus 699K and 4KB values 294K versus 78K, a 3.75x gap. At 16 threads the ratios hold with 64-byte values at 3.05M versus 730K and 4KB at 285K versus 75K. TidesDB maintains its advantage across all value sizes and benefits from additional threads while RocksDB’s throughput barely changes between 8 and 16 threads.
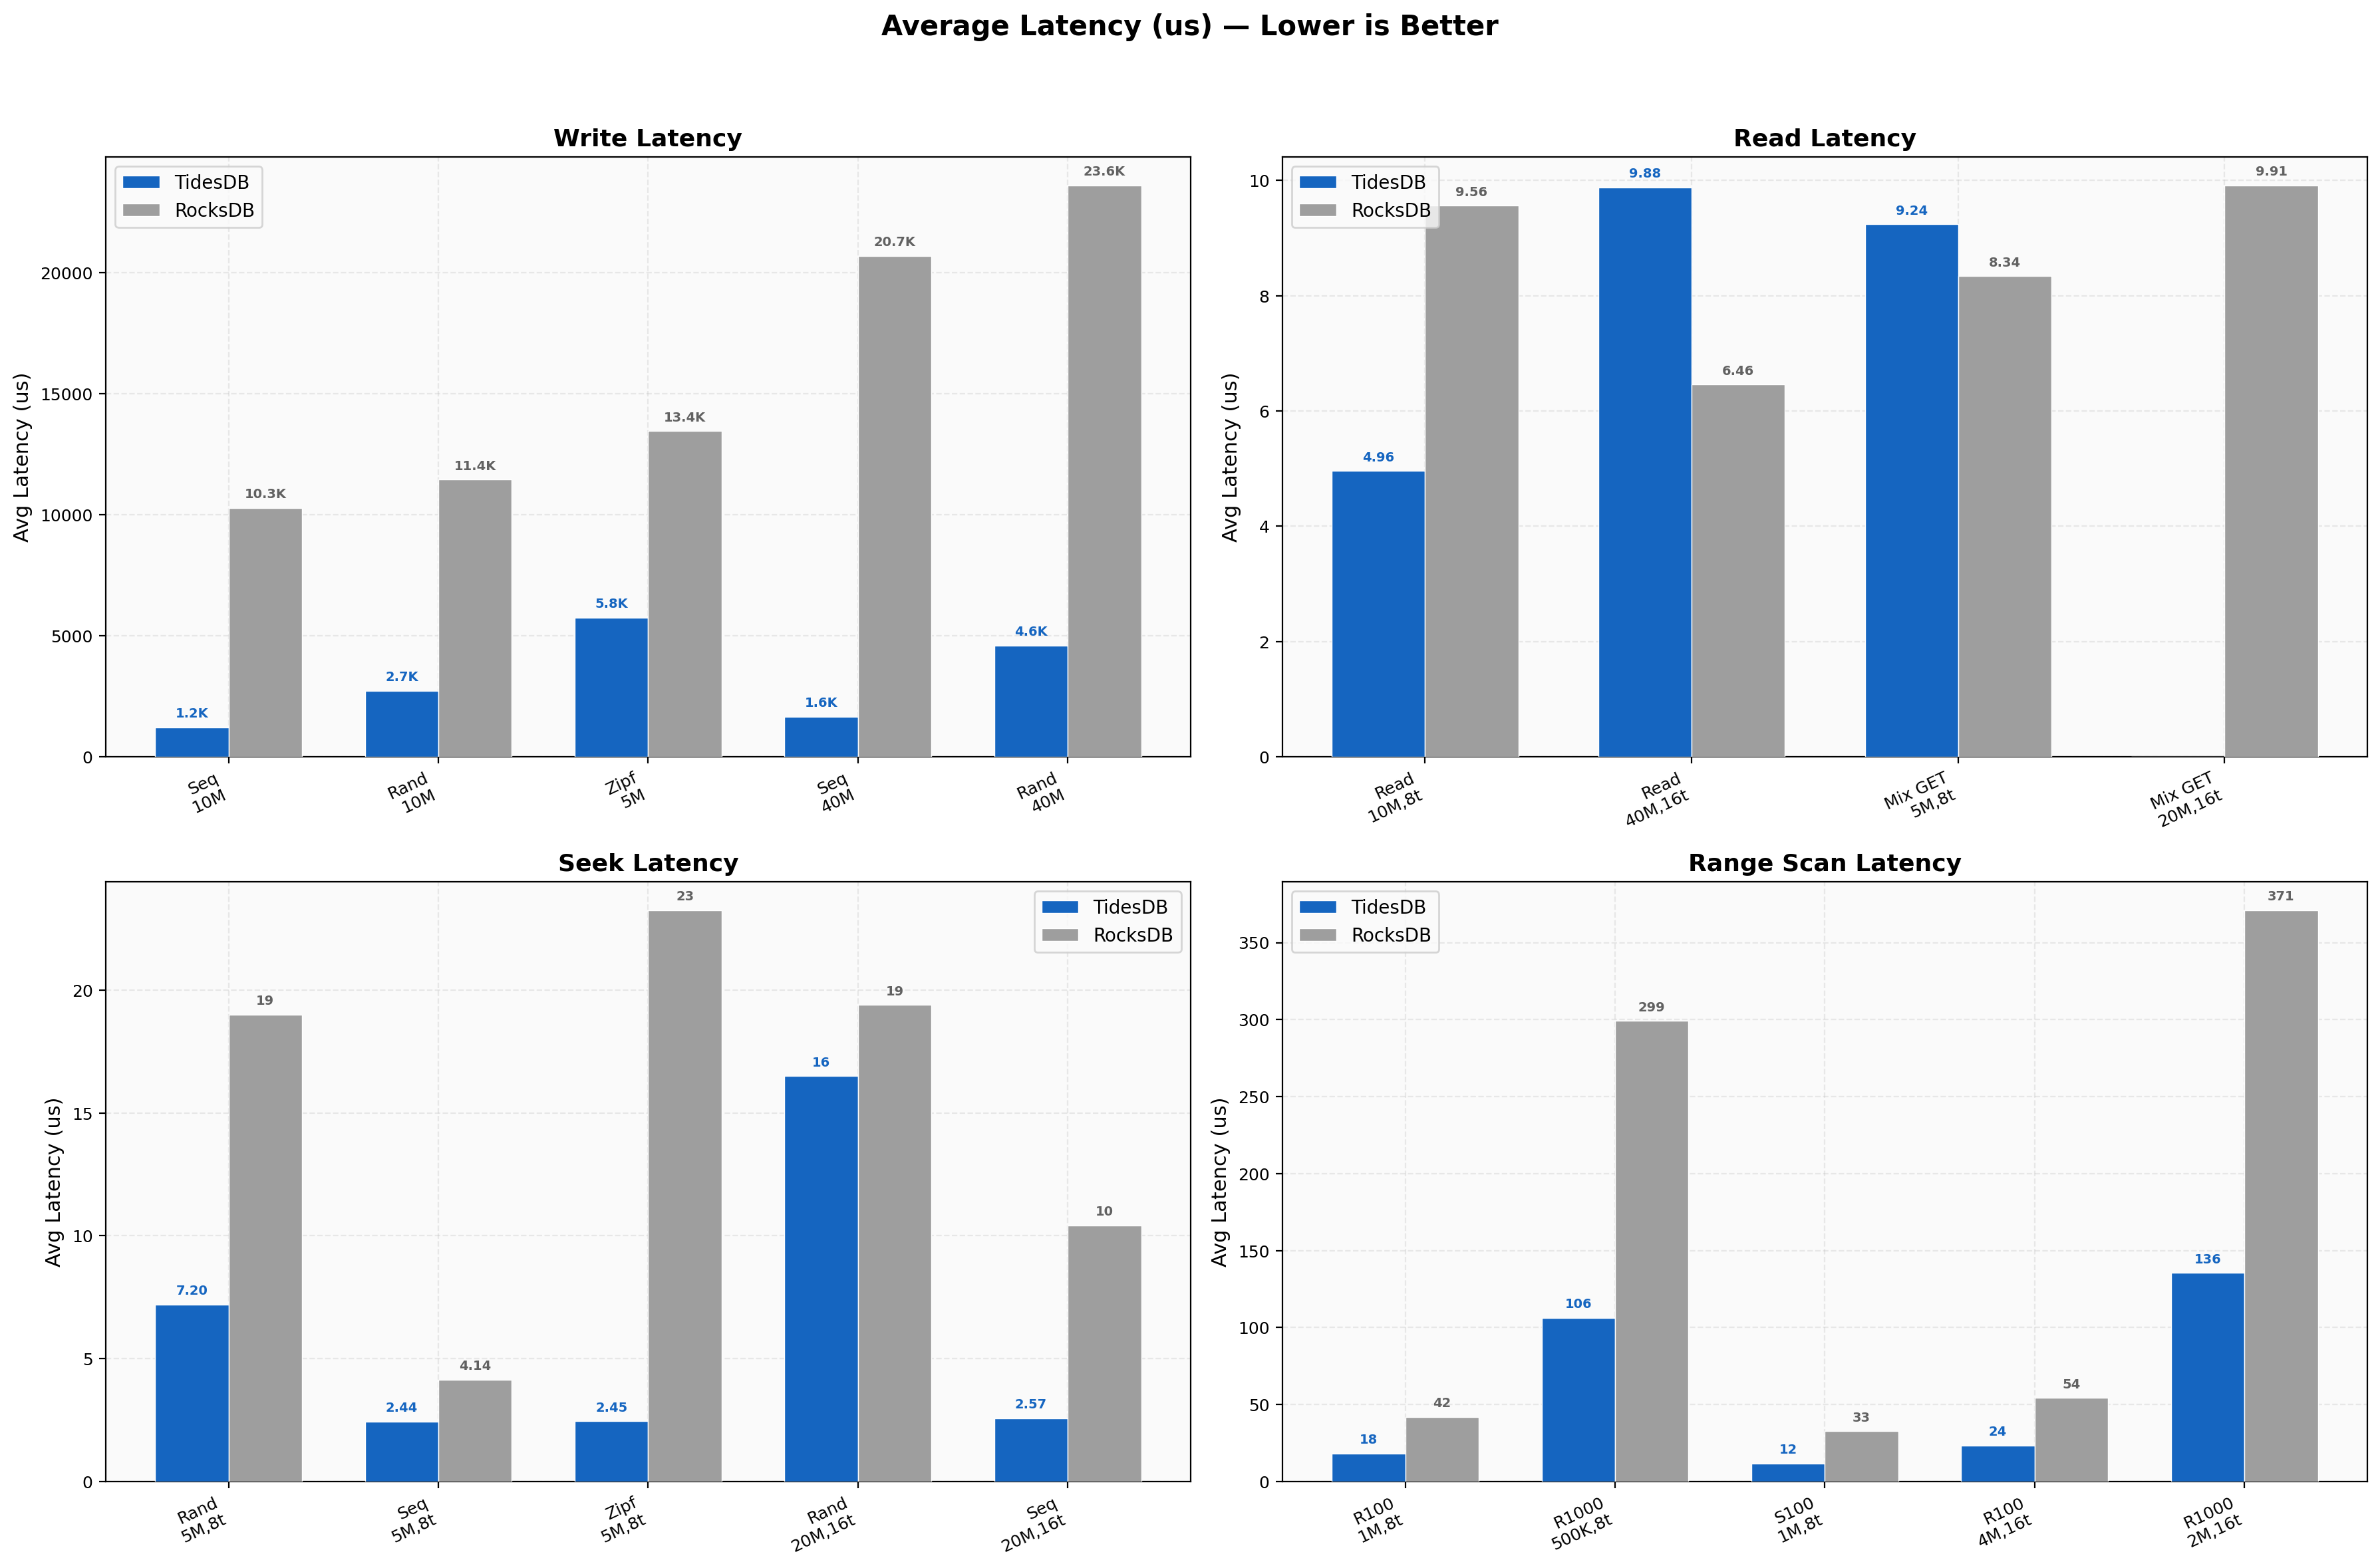
Write latencies at 8 threads average 1213us on TidesDB versus 10274us on RocksDB for sequential access. At 16 threads sequential write latency grows to 1645us on TidesDB but jumps to 20695us on RocksDB. Read latency at 8 threads favors TidesDB at 4.96us versus 9.56us. At 16 threads on 40M keys RocksDB shows lower read latency at 6.46us versus 9.88us, matching the throughput reversal seen in the read plot. Seek and range latencies consistently favor TidesDB with zipfian seeks at 2.45us versus 23.24us at 8 threads.
Sequential write p99 on TidesDB lands at 2061us versus 12774us on RocksDB. Random write p99 shows 3903us against 13242us. Random read p99 is 8us on TidesDB versus 25us on RocksDB. The p50-to-p99 spread stays narrow on TidesDB across all workloads. RocksDB’s write percentiles cluster tightly but at a much higher absolute level. Delete p99 at 8 threads sits at 2551us on TidesDB versus 6757us on RocksDB. Range scan p99 is 53us on TidesDB against 57us on RocksDB, nearly identical at the tail.
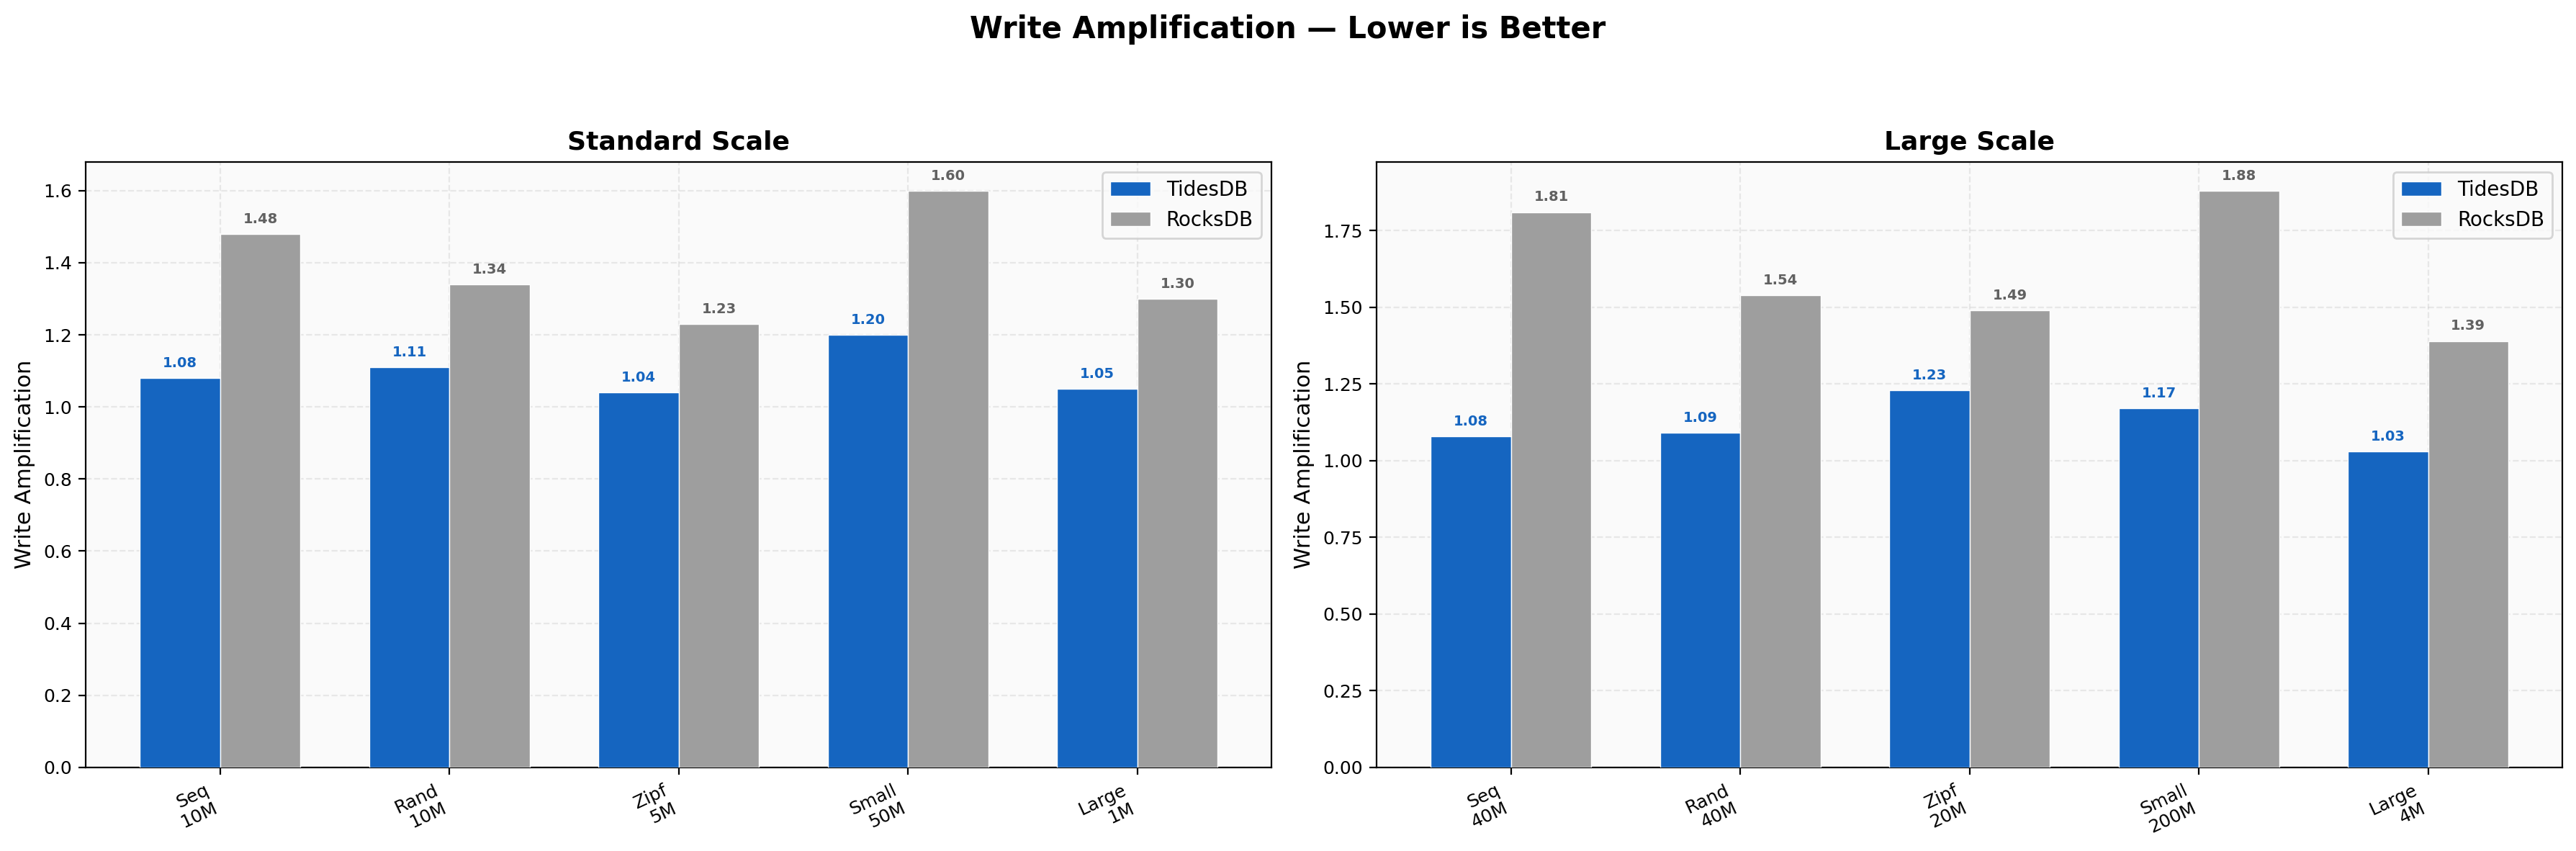
At 8 threads TidesDB’s write amplification ranges from 1.04 to 1.20 while RocksDB ranges from 1.23 to 1.60. At 16 threads the gap widens. RocksDB’s sequential write amplification rises to 1.81 and small value writes reach 1.88. TidesDB stays between 1.03 and 1.23. The 16-thread increase in write amplification for RocksDB suggests heavier compaction pressure under higher parallelism while TidesDB’s write path keeps amplification nearly flat regardless of thread count.
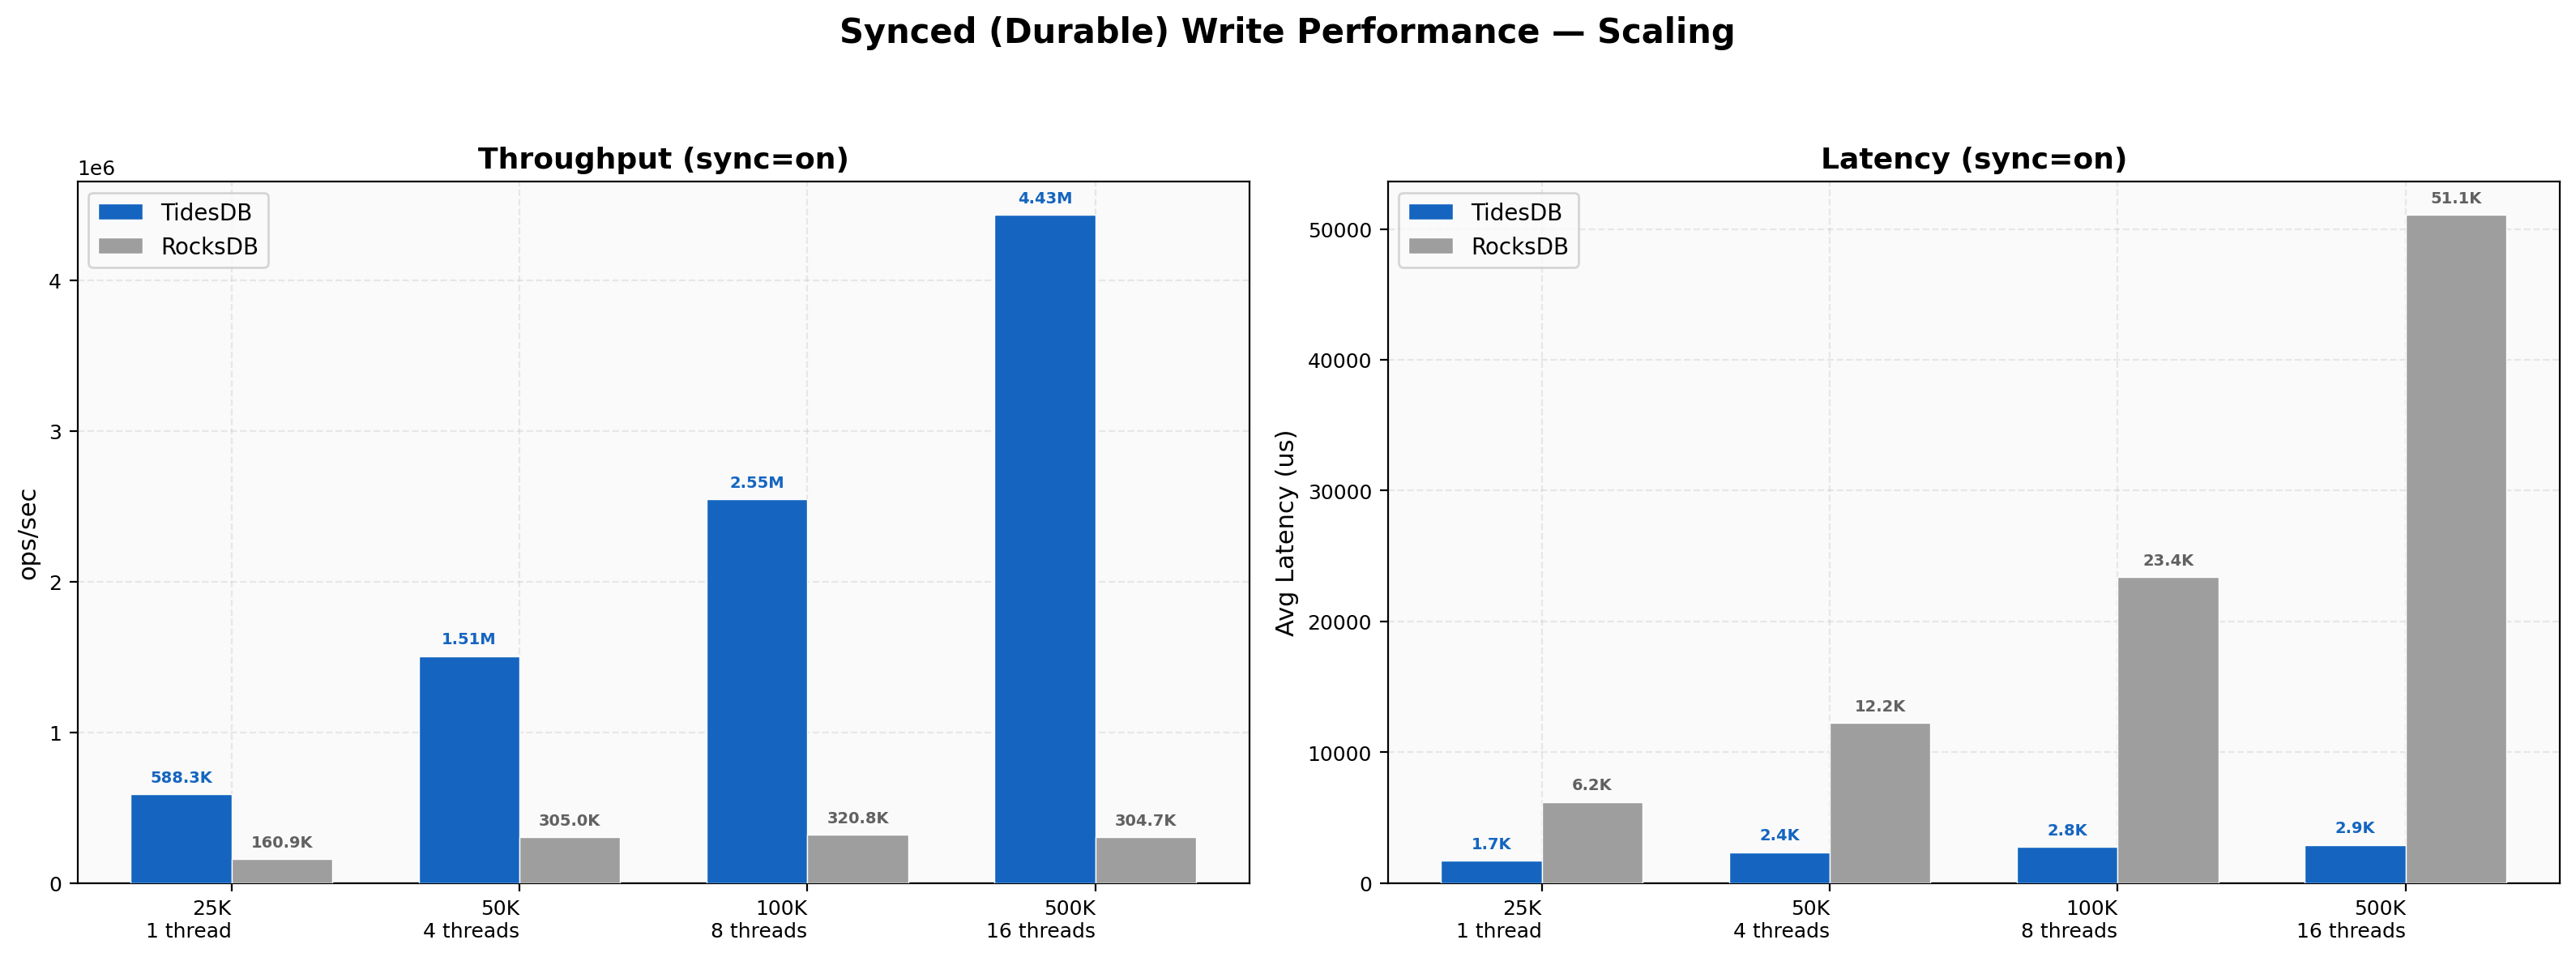
Sync writes with fsync/fdatasync enabled show how each engine handles durable writes as thread count scales from 1 to 16. At 1 thread TidesDB reaches 588K ops/sec against RocksDB at 161K, a 3.66x lead. At 4 threads TidesDB jumps to 1.51M while RocksDB stays at 305K. At 8 threads TidesDB hits 2.55M versus 321K, a 7.94x gap. At 16 threads TidesDB peaks at 4.43M while RocksDB remains flat at 305K, producing a 14.56x advantage. RocksDB’s sync write throughput essentially plateaus past 1 thread while TidesDB scales nearly linearly with core count. This is one of the widest performance gaps in the entire benchmark and highlights how TidesDB’s write path amortizes fsync cost across concurrent batches because of the atomic lock-free block manager design.
On the Threadripper 2950X with 128GB RAM and NVMe storage, TidesDB maintains strong advantages across write, seek, range, and delete workloads at both 8 and 16 threads. Write throughput leads by 4-11x and scales with thread count while RocksDB shows minimal scaling.
The standout exception is random reads at 40M keys with 16 threads where RocksDB wins at 2.28M versus 1.50M. Batch-1 operations also favor RocksDB. Latency and write amplification metrics reinforce TidesDB’s edge with tighter tail latencies and lower I/O amplification across the board.
Summary
Across two different hardware environments the latest minor of TidesDB demonstrates consistent and often substantial performance advantages over the latest version of RocksDB. On the modern i7-11700K, TidesDB leads every throughput metric by 1.3-5x and the higher clock speed plays directly into its cache-friendly design. On the older Threadripper 2950X, TidesDB still outperforms RocksDB on the vast majority of workloads and scales well to 16 threads, though a few configurations like random reads at high concurrency show RocksDB pulling ahead.
TidesDB is designed to leverage modern hardware with fast single-threaded performance and efficient multi-core scaling, and these results validate that design. The only consistent RocksDB advantages are single-key batch-1 operations across both environments. Write amplification, tail latency, and storage efficiency all favor TidesDB regardless of platform. These benchmarks confirm that TidesDB’s clock cache, MVCC, atomic and lock-less design, and batch-oriented write path deliver real-world throughput gains against a mature and well-optimized baseline.
Thank you for reading!
—