Consumer TPC-C Analysis on TideSQL v4.5.0, MyRocks and InnoDB in MariaDB v11.8.6 using HammerDB

published on May 16th, 2026
In this analysis I will be going over results running TideSQL v4.5.0, MyRocks, and InnoDB inside MariaDB v11.8.6.
I am running on a consumer environment as described below:
- Intel Core i7-11700K (8 cores, 16 threads) @ 4.9GHz
- 48GB DDR4
- Western Digital 500GB WD Blue 3D NAND Internal PC SSD (SATA)
- Ubuntu 23.04 x86_64 6.2.0-39-generic
I used GCC (glibc) and the installed version of the TidesDB library used was v9.2.3.
I used a custom HammerDB runner script as seen here hammerdb_runner.sh, a bash wrapper around HammerDB’s hammerdbcli that drives one canonical run per (engine, benchmark) pair end to end.
The command below runs one TPC-C iteration against the TidesDB(TideSQL) engine on a MariaDB reachable at /tmp/mariadb.sock as hammerdb / hammerdb123, using HammerDB under ~/HammerDB-5.0. It builds a 40-warehouse TPC-C schema with 8 build VUs, settles for 5 s, runs the timed workload with 8 measured VUs for 1 minute of ramp-up + 2 minutes of measurement, also capturing the NOPM/TPM/p95 numbers.
./hammerdb_runner.sh -b tpcc --warehouses 40 --tpcc-vu 8 --tpcc-build-vu 8 --rampup 1 --duration 2 --settle 5 -H ~/HammerDB-5.0 -e tidesdb -u hammerdb --pass hammerdb123 -S /tmp/mariadb.sockInstead of running just above script which is good for single engine analysis, I ran mariadb_engines_runner.sh, a higher-level orchestrator on top of hammerdb_runner.sh that sweeps the same workload across multiple engines x multiple iterations and merges the resulting CSVs into one set of comparison charts. In this article’s case we ran 1 iteration of each engine.
Thus the command used in the article was below and it does one TPC-C iteration each for TidesDB(TideSQL) >> RocksDB(MyRocks) >> InnoDB.
/home/agpmastersystem/mariadb_engines_runner.sh \ --harness /home/agpmastersystem/hammerdb_runner.sh \ --user agpmastersystem \ --socket /tmp/mariadb.sock \ --engines tidesdb,rocksdb,innodb \ --iterations 1 \ --warehouses 40 \ --build-vu 8 \ --run-vu 8 \ --rampup 1 \ --duration 2 \ --settle 5 \ --no-restart \ --no-drop-cache \ --no-perfI use a specific small buffer/cache setup that is optimized and aligned for TidesDB (TideSQL), RocksDB (MyRocks) and InnoDB you can find that here: https://github.com/tidesdb/hammer/blob/master/my.cnf.small.example
The total run took 18 minutes 25 seconds across all three engines.
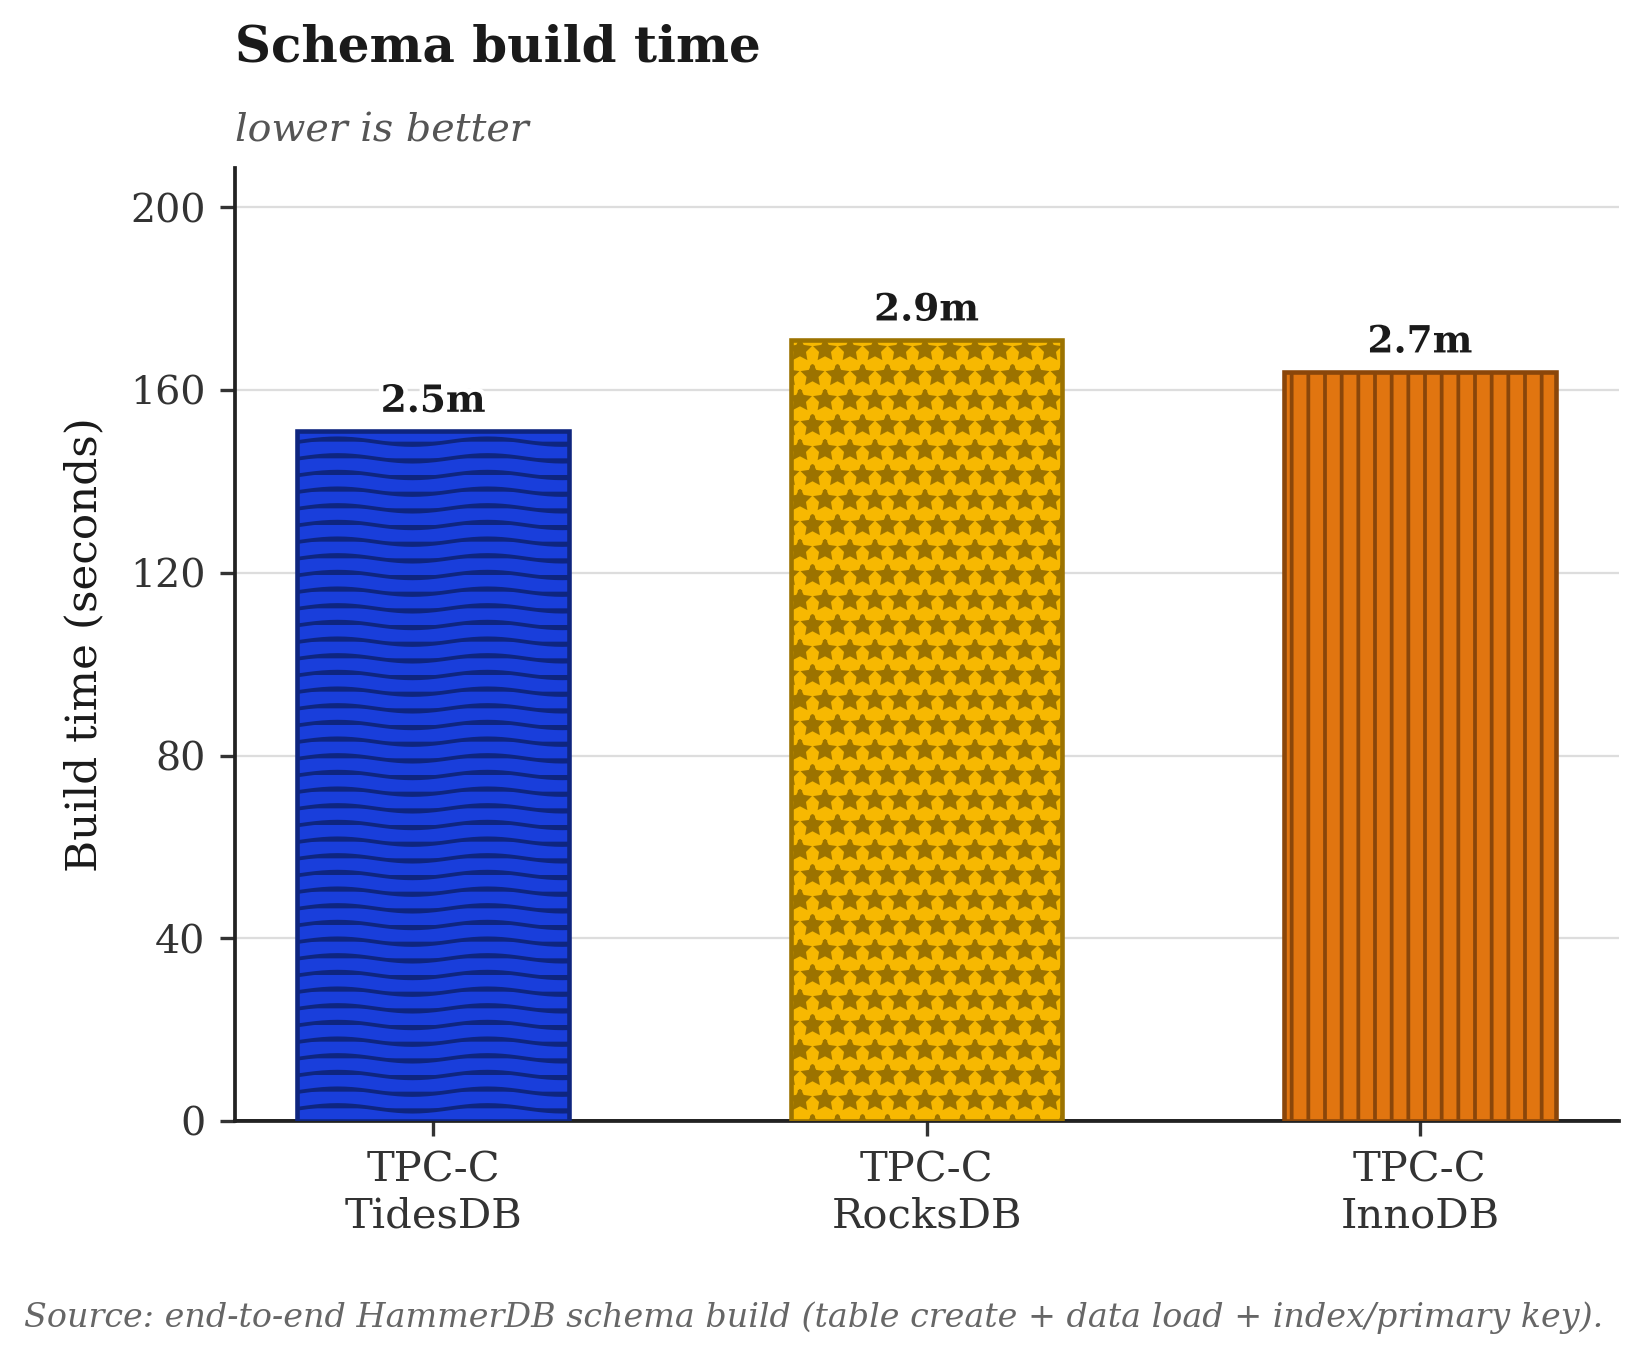
The three engines build the 40 warehouse schema in roughly the same wall clock window. InnoDB takes 164 s, TideSQL 151 s, MyRocks 171 s. The 20 second spread between fastest and slowest sits well inside one rampup minute and is mostly the HammerDB Tcl driver loop and the SQL layer cost rather than storage engine throughput. InnoDB runs with innodb_doublewrite=OFF and innodb_flush_log_at_trx_commit=0 here, MyRocks builds with rocksdb_bulk_load=0 (no skip WAL fast path), TideSQL writes through its unified memtable with tidesdb_unified_memtable_sync_mode=NONE. None of the engines are differentiating themselves on the load path. The bottleneck is elsewhere.
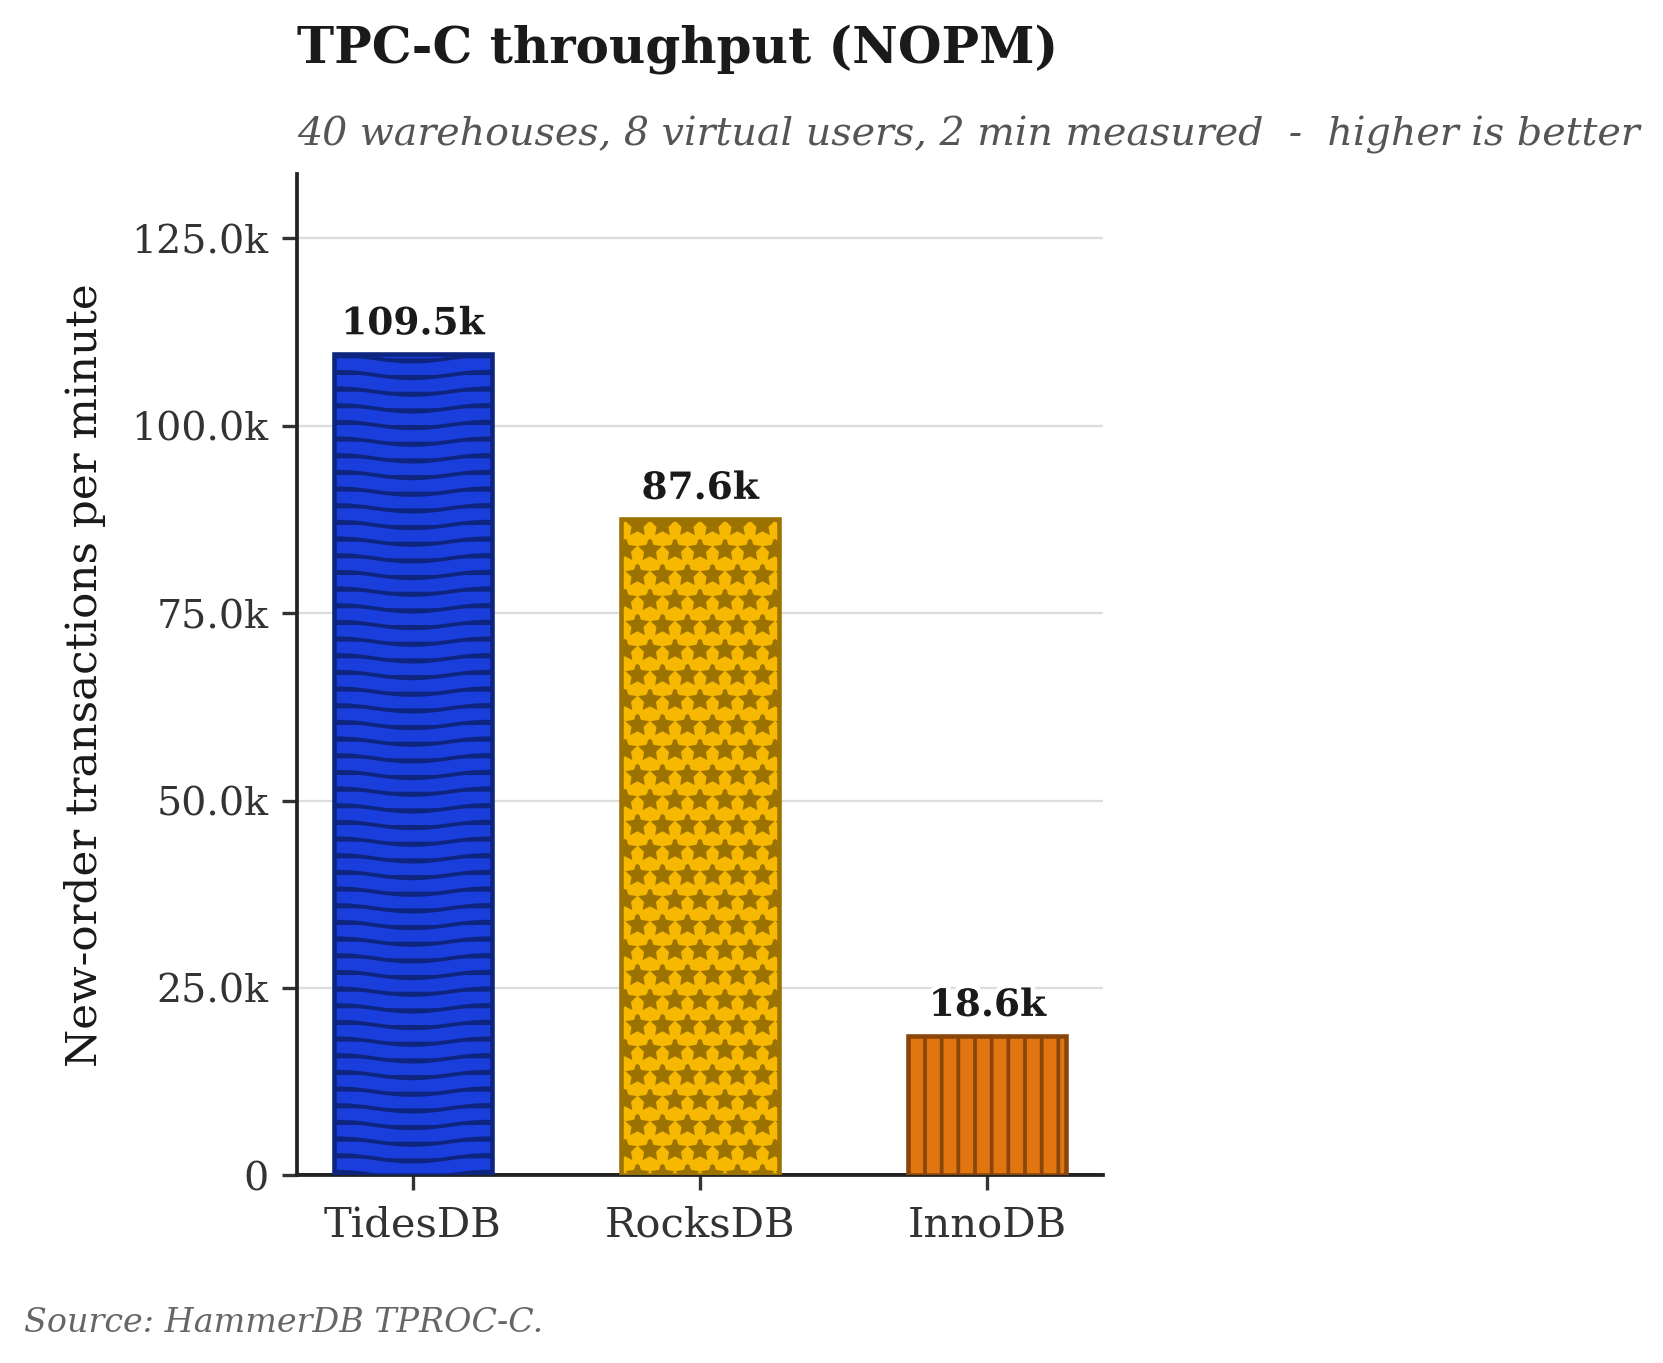
NOPM is the headline TPC-C metric. NewOrder is the heaviest of the five transaction classes and roughly 45 percent of the mix. TideSQL at 109,539 NOPM runs 25 percent ahead of MyRocks at 87,583 and 5.9x ahead of InnoDB at 18,600. The dataset (roughly 4 GB on disk for 40 warehouses) is about 4x the aligned 1 GB primary cache for every engine, so all three are exercising the on disk path plus the OS page cache rather than the in memory path. The InnoDB delta is consistent with what an undersized buffer pool produces on TPC-C. Even with the doublewrite and redo fsync turned off, the update in place model pays a page flushing cost under sustained writes that neither LSM engine pays. Between TideSQL and MyRocks the gap is narrow but consistent across the run.
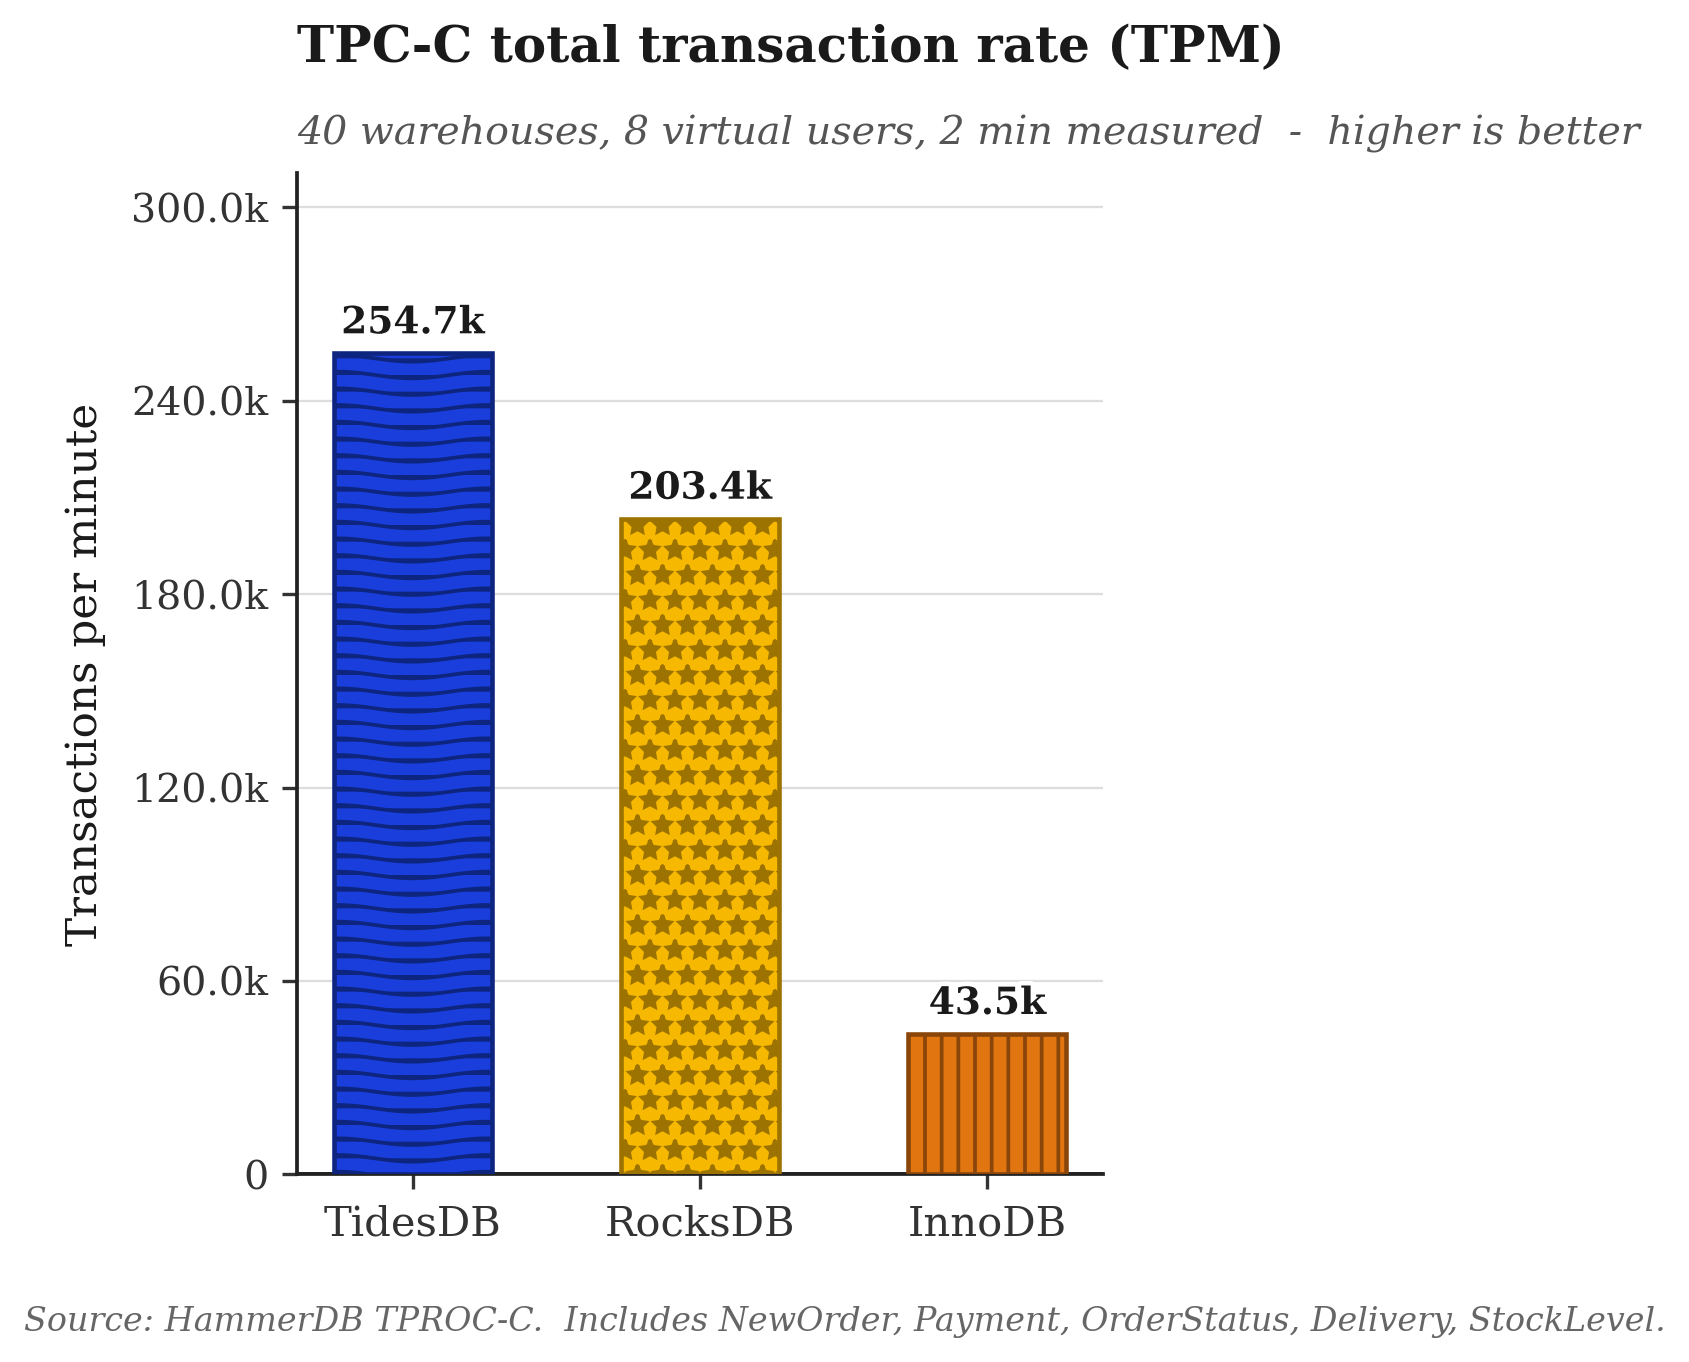
TPM tracks NOPM almost linearly. TideSQL lands at 254,689, MyRocks at 203,381, InnoDB at 43,542. The TPM over NOPM ratios are 2.33, 2.32, and 2.34 respectively, within 1 percent of each other.
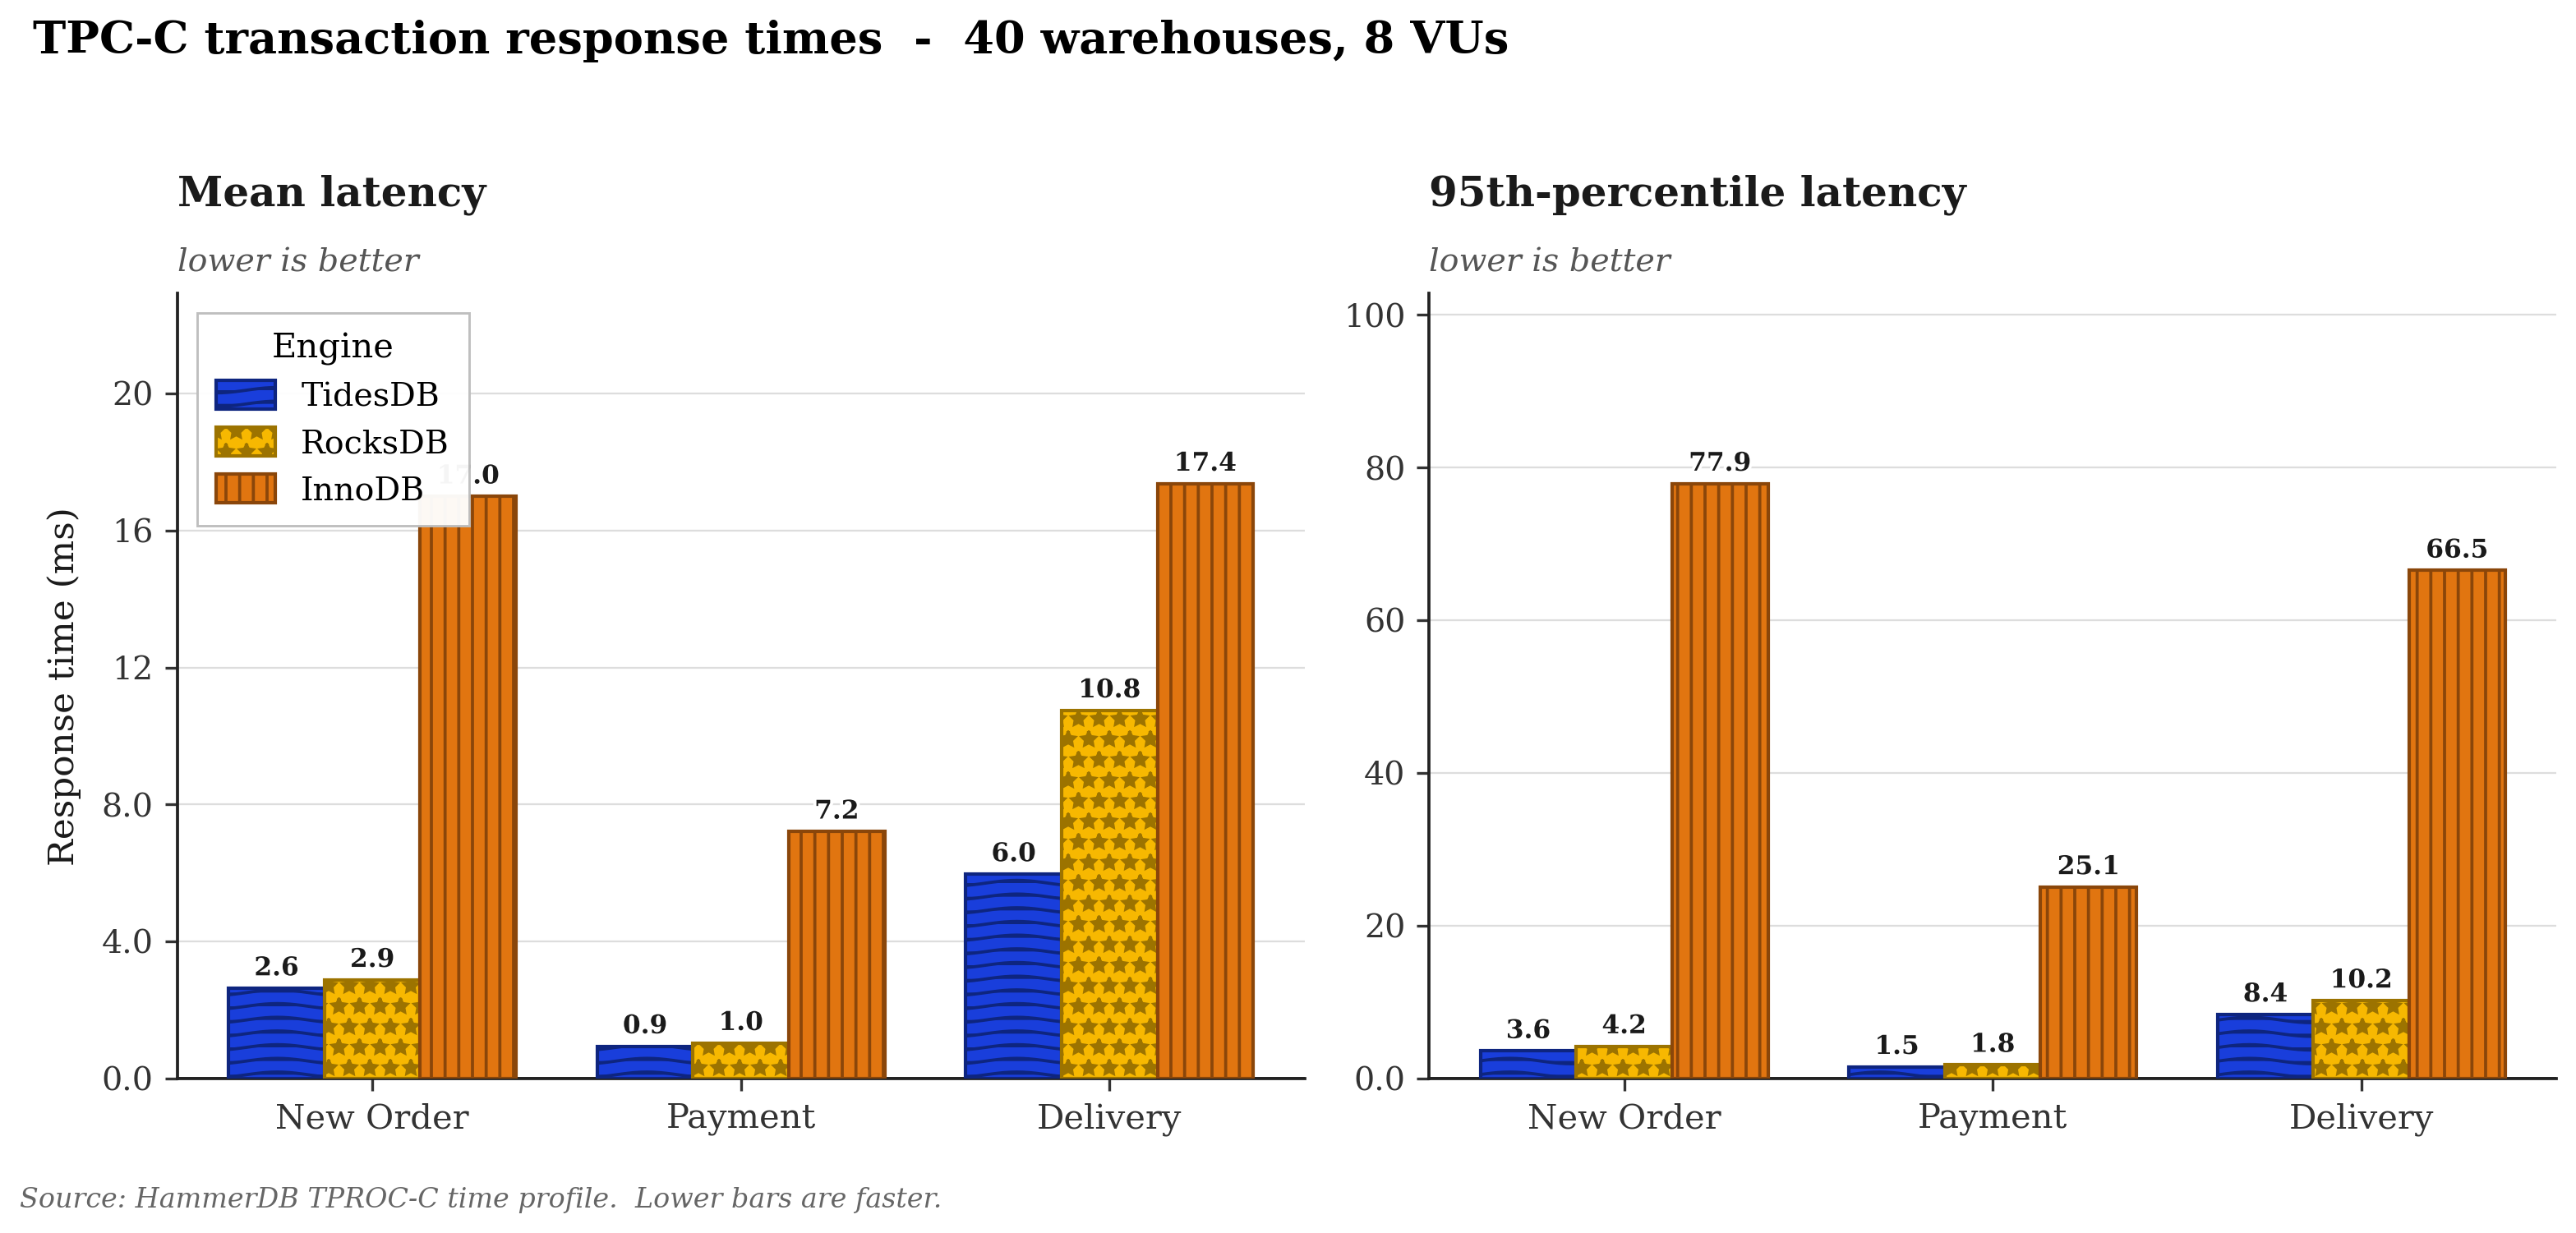
This is where the engines separate most cleanly. NewOrder p95 measures 3.59 ms on TideSQL, 4.23 ms on MyRocks, 77.90 ms on InnoDB. Payment p95 is 1.52, 1.79, and 25.06 ms respectively. Delivery p95 is 8.38, 10.21, and 66.53 ms respectively. Both LSM engines hold sub 10 ms p95 across all three classes. Delivery has the highest absolute latency on all three engines because it is the only TPC-C transaction that touches all districts in a warehouse and does a per row DELETE on NEW_ORDER plus a fan out UPDATE on ORDER_LINE, the most writes per call of any class. Neither LSM engine shows latency cliffs at this duration, so neither trigger appears to fire mid run.
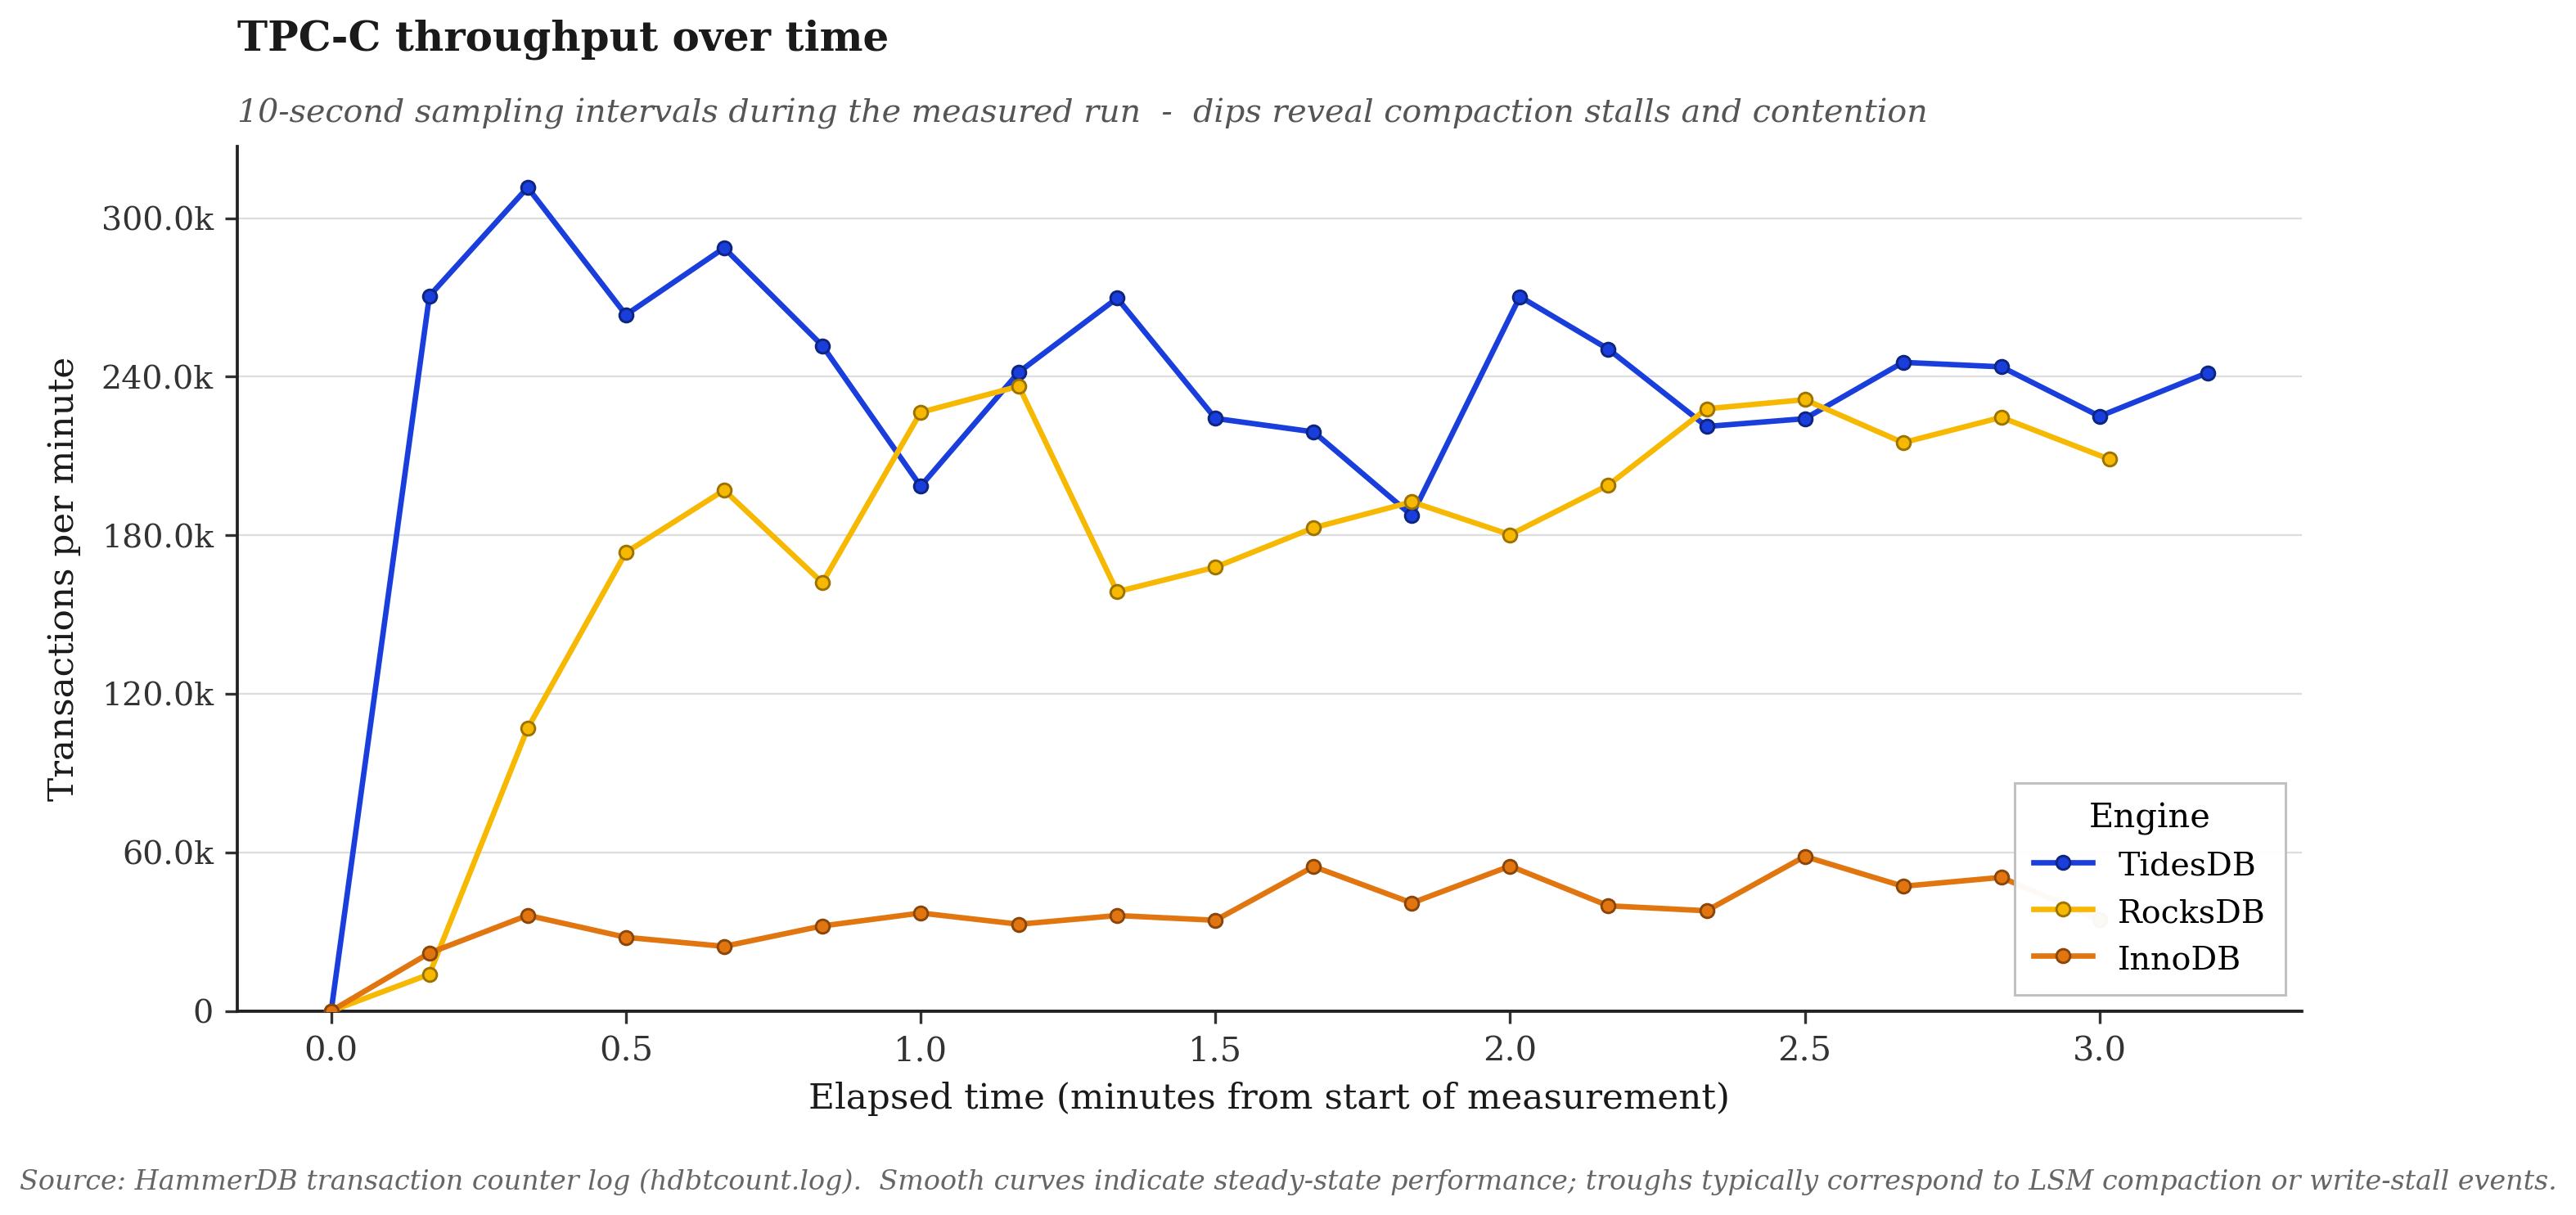
The timeline plots TPM through the 1 minute rampup and the 2 minute measured window. Both LSM engines reach steady state inside the rampup and hold a flat throughput band through measurement.
—
In this analysis both LSM engines outperform InnoDB by 5x to 6x on NOPM. TideSQL leads MyRocks by roughly 25 percent on every aggregate metric and beats it on the p95 of every transaction class.
That’s all for this article. Look out for an upcoming article on a dedicated server pushing all 3 engines with their highly optimized configurations long running.
To find raw data for the analysis session you can find it in the zip below:
- hammerdb_data_consumer_may162026.zip (sha256: d653055dbc3e4b19eb805f8bddfd05502da444eb45a018287a9f72d883115c5a)