Benchmark Analysis on TidesDB v8.9.0 and RocksDB v11.0.3

published on March 16th, 2026
Back with another rather short benchmark analysis article after the latest release of TidesDB v8.9.0. I am benchmarking against a baseline of RocksDB v11.0.3.
The specs for the environment are
- Intel Core i7-11700K (8 cores, 16 threads) @ 4.9GHz
- 48GB DDR4
- Western Digital 500GB WD Blue 3D NAND Internal PC SSD (SATA)
- Ubuntu 23.04 x86_64 6.2.0-39-generic
- GCC (glibc)
I ran the TidesDB benchtool program using script tidesdb_rocksdb_old.sh.
Both engines are configured identically regarding block cache, write buffers, and other relevant settings. Both engines have durable writes disabled. Keys are 16 bytes, values are 100 bytes unless noted otherwise.
What’s changed this latest minor?
This release focused on performance. The biggest item is zero-copy block deserialization in the klog iterator hot path. Improved savepoint performance from O(n) to O(1) with reduced malloc usage, introduced large chunk coalescing in the transaction arena allocator for better locality. We also introduced a unified memtable engine option which is pretty useful in many column family scenarios like in the MariaDB plugin TideSQL where a table(column family) can have many indexes.
Write throughput
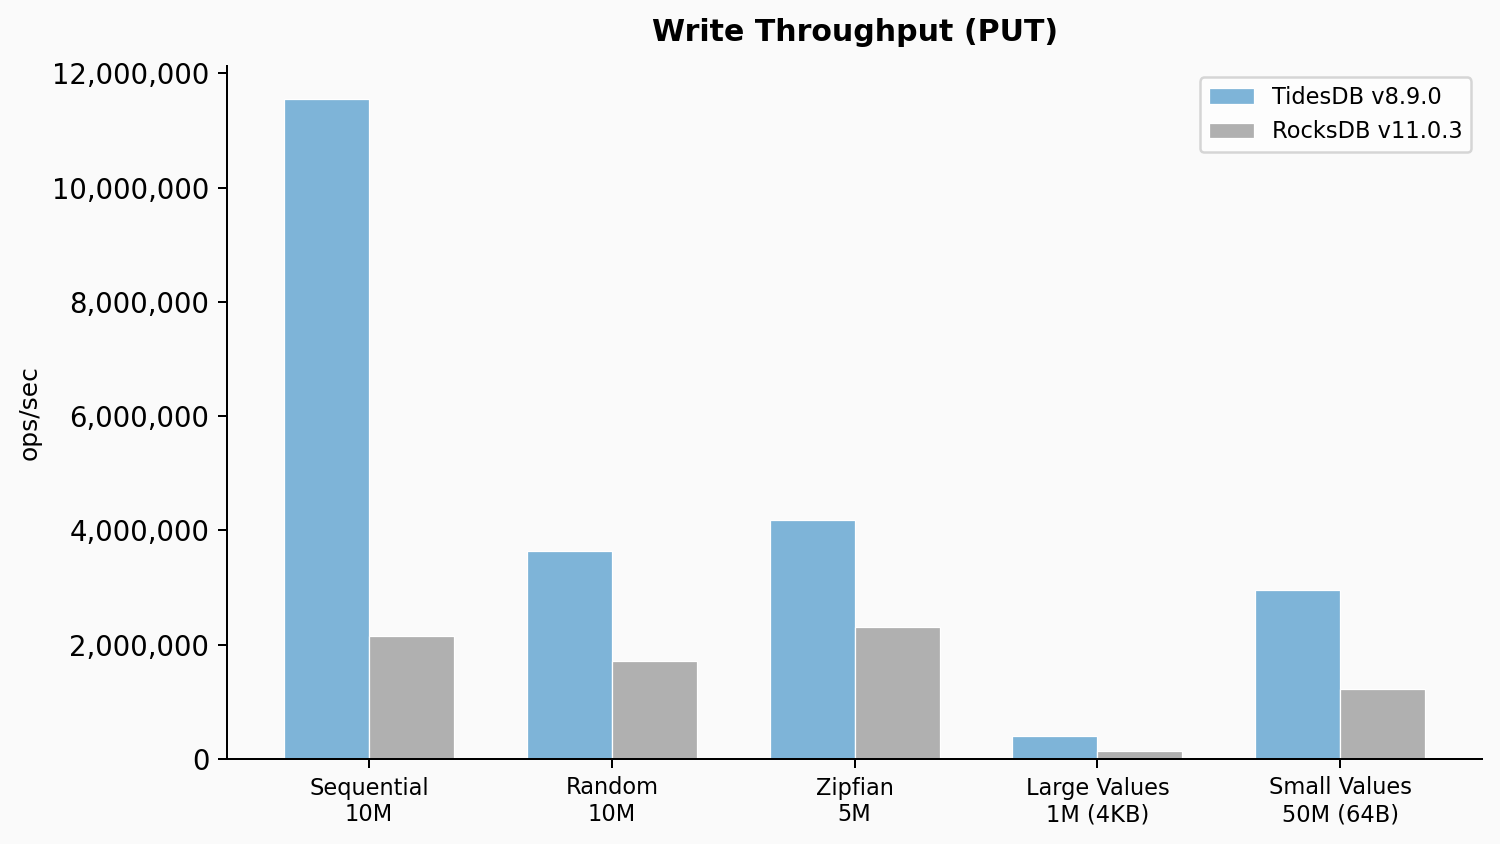
TidesDB hit 11.55M ops/sec on sequential writes which is 5.36x the RocksDB baseline of 2.15M ops/sec. Random writes came in at 3.63M ops/sec versus 1.72M ops/sec for RocksDB, a 2.11x advantage. Zipfian writes showed a similar pattern at 4.19M versus 2.31M ops/sec (1.81x). The large value test with 4KB values showed a 2.95x advantage at 409K versus 139K ops/sec. Small 64-byte values at 50M operations showed TidesDB at 2.96M ops/sec versus 1.22M for RocksDB, a 2.43x lead. TidesDB p99 on sequential writes was 1,062us versus 4,313us for RocksDB. The max latency gap is even more telling at 1,761us versus 498,564us.
Read and mixed workloads
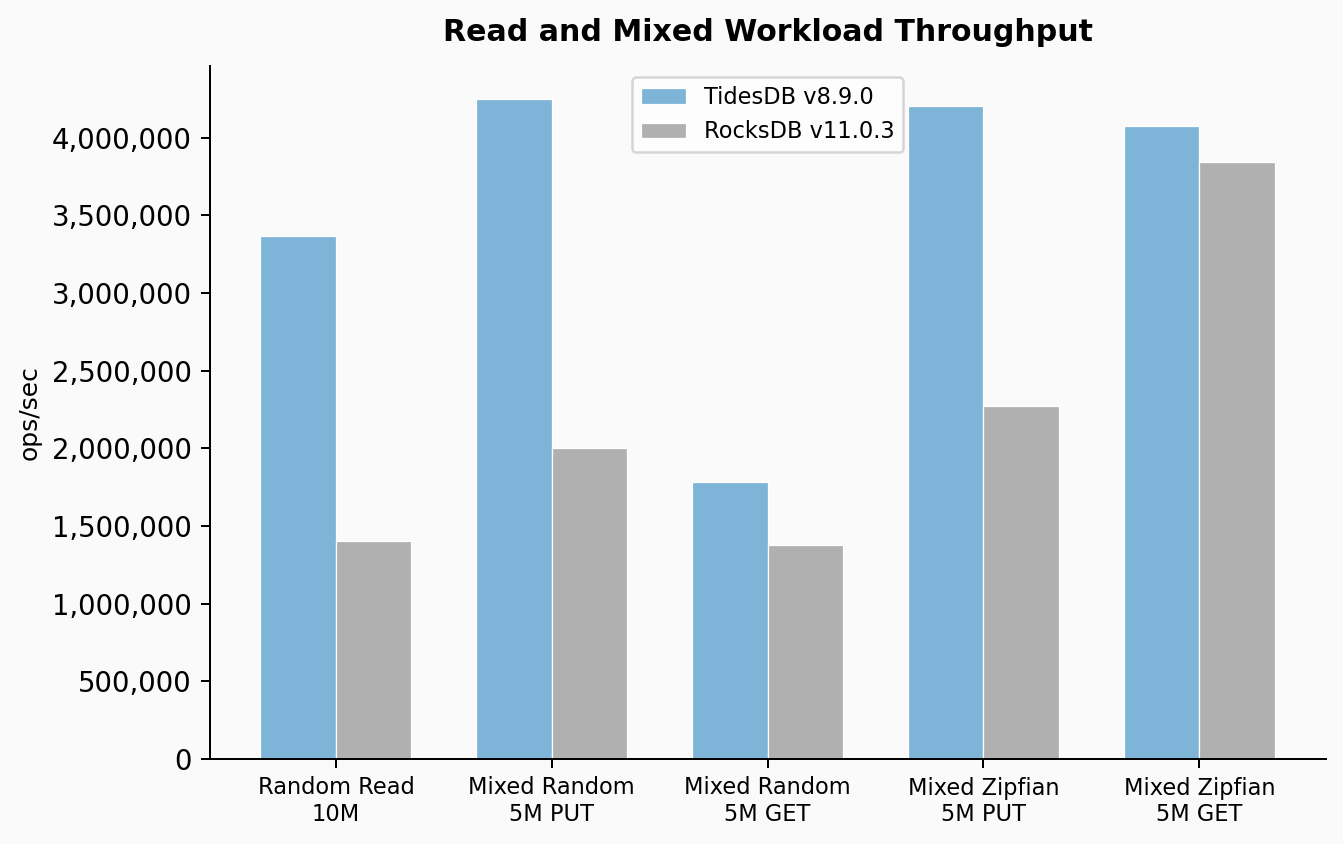
Random reads on a 10M key dataset showed TidesDB at 3.37M ops/sec with a 2.04us average latency versus RocksDB at 1.40M ops/sec with a 5.19us average. That is a 2.40x throughput advantage. The mixed random workload (50/50 read/write at 5M ops) showed TidesDB PUT at 4.25M ops/sec versus RocksDB at 2.00M, and GET at 1.78M versus 1.38M.
Delete throughput
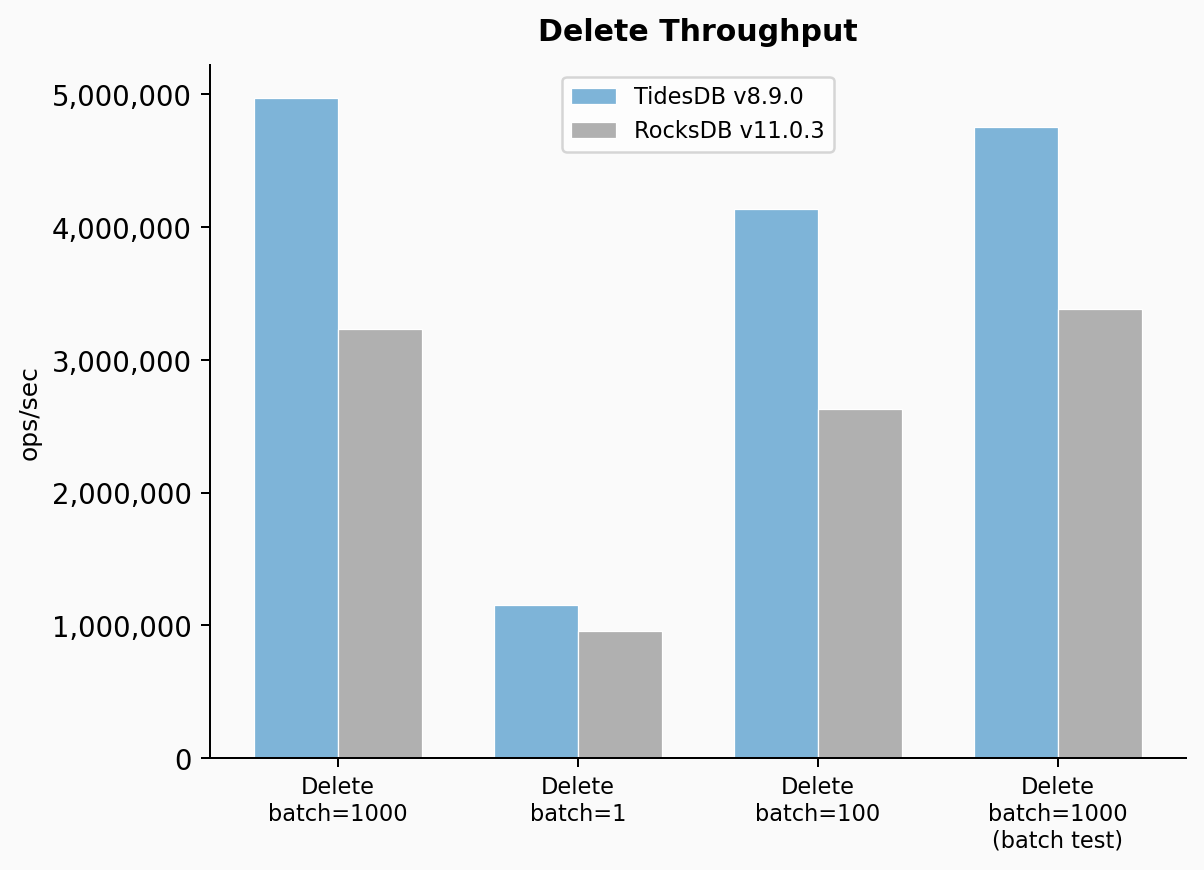
Deletes at batch=1000 showed TidesDB at 4.97M ops/sec versus RocksDB at 3.23M, a 1.54x lead. At batch=1 (single deletes, no batching) TidesDB came in at 1.16M versus 956K for RocksDB. At batch=100 it was 4.13M versus 2.63M.
Batch size scaling
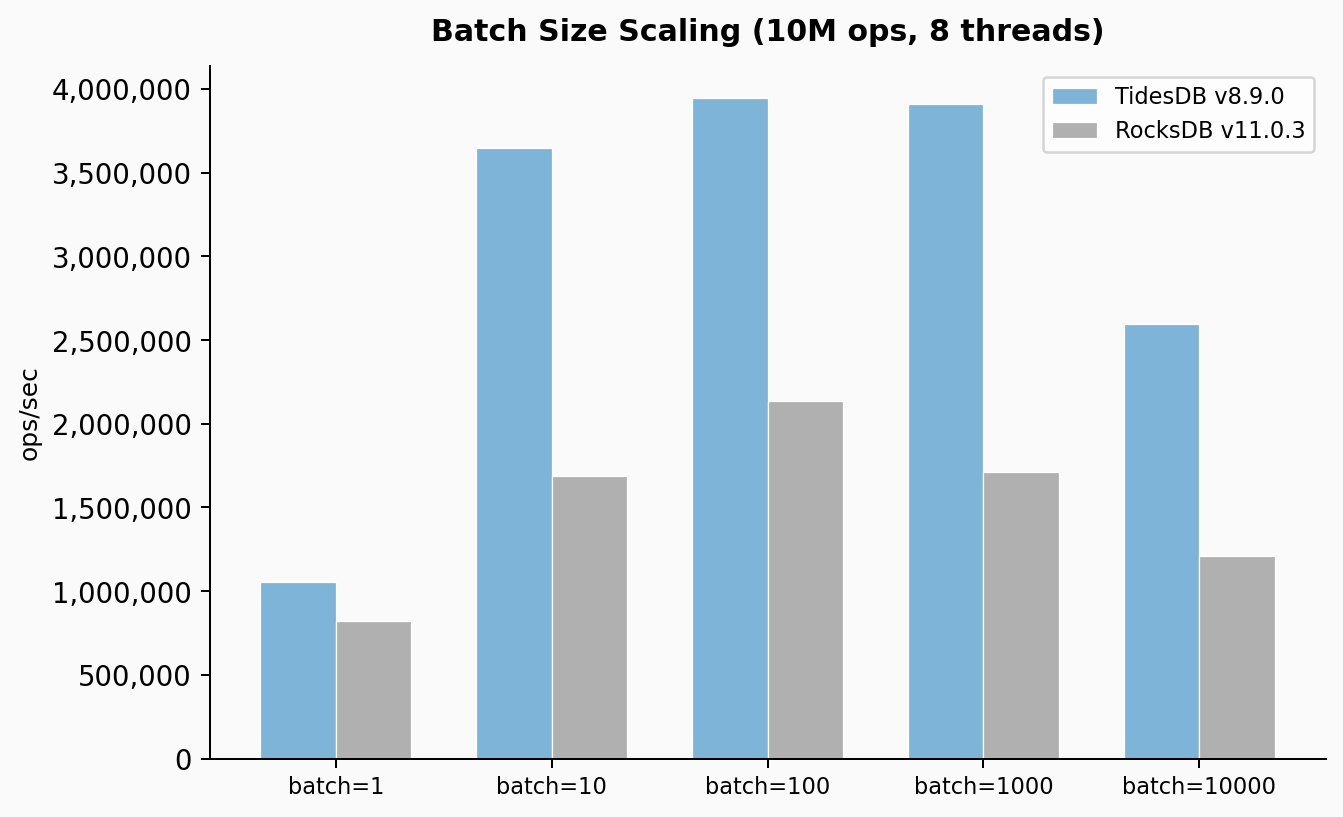
At batch=1 TidesDB did 1.05M ops/sec versus 820K for RocksDB, about 1.28x. At batch=10 the gap opens up to 3.65M versus 1.69M (2.16x). At batch=100 it was 3.94M versus 2.13M (1.85x). At batch=1000 it was 3.91M versus 1.71M (2.29x). At batch=10000 it was 2.59M versus 1.21M (2.15x). TidesDB peaks around batch=100 to batch=1000 and then drops at 10000 because each batch becomes a large transaction that takes longer to commit. RocksDB shows a similar curve but at lower absolute throughput.
Seek throughput
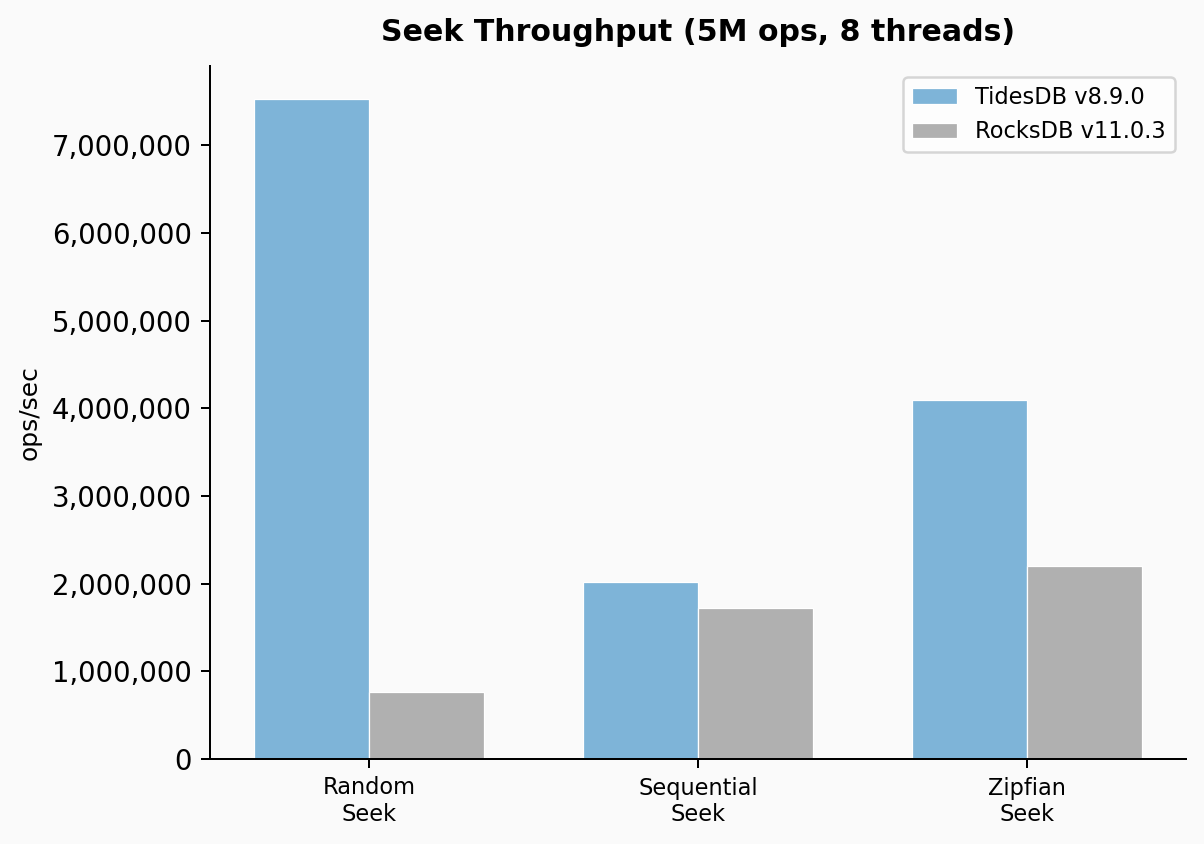
This is where the v8.9.0 zero-copy iterator work really shows. Random seeks hit 7.53M ops/sec on TidesDB versus 762K on RocksDB. That is 9.88x. Sequential seeks came in at 2.02M versus 1.72M (1.17x). Zipfian seeks showed 4.10M versus 2.20M (1.86x).
Range scan throughput
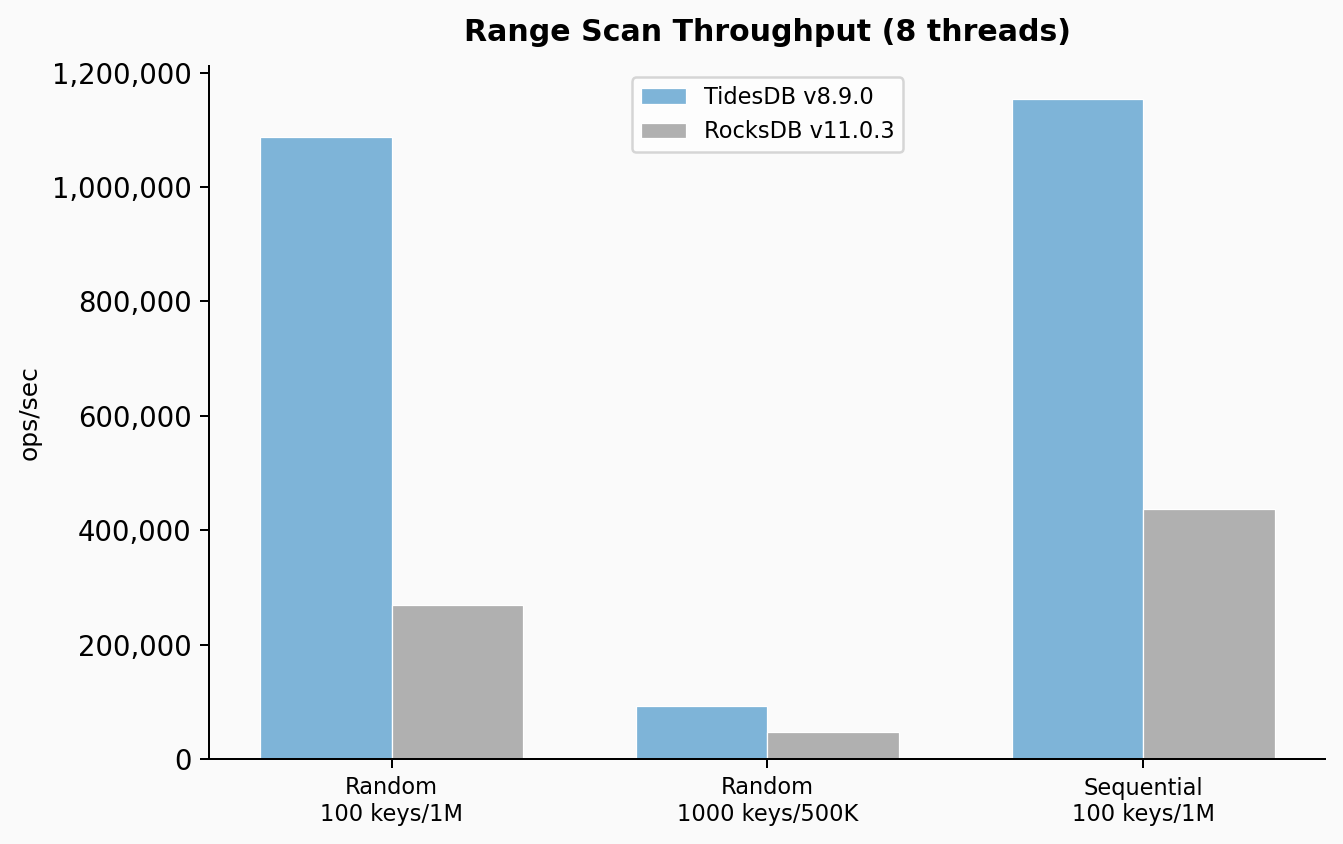
Range scans with 100 keys per range at 1M operations showed TidesDB at 1.09M ops/sec versus 269K for RocksDB, a 4.04x lead. With 1000 keys per range at 500K operations it was 92K versus 47K, a 1.96x advantage. Sequential range scans with 100 keys came in at 1.15M versus 437K (2.64x).
Write latency p99
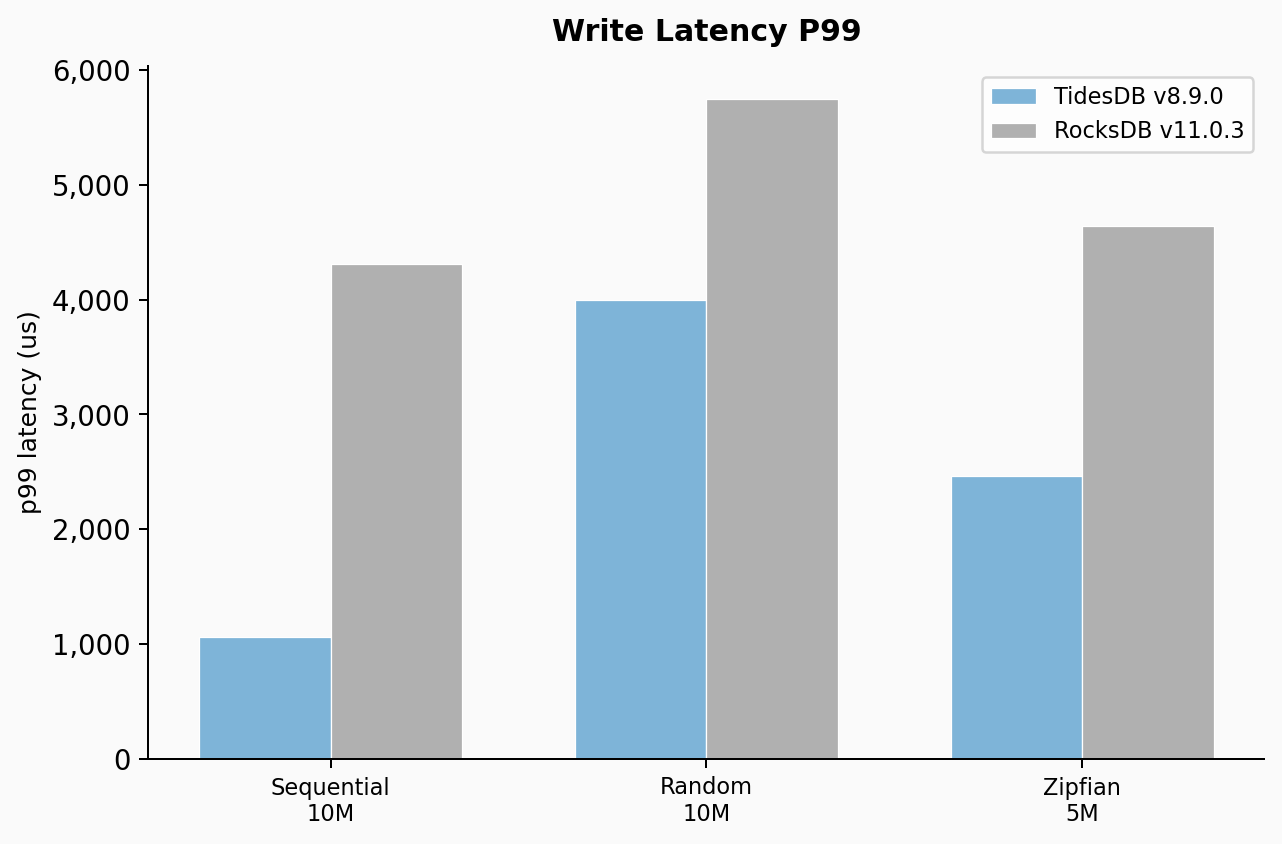
Sequential write p99 was 1,062us for TidesDB versus 4,313us for RocksDB. Random write p99 was 3,996us versus 5,748us. Zipfian write p99 was 2,464us versus 4,645us. The coefficient of variation tells an even more important story. TidesDB’s CV on sequential writes was 21.83% versus 462.29% for RocksDB.
Write amplification
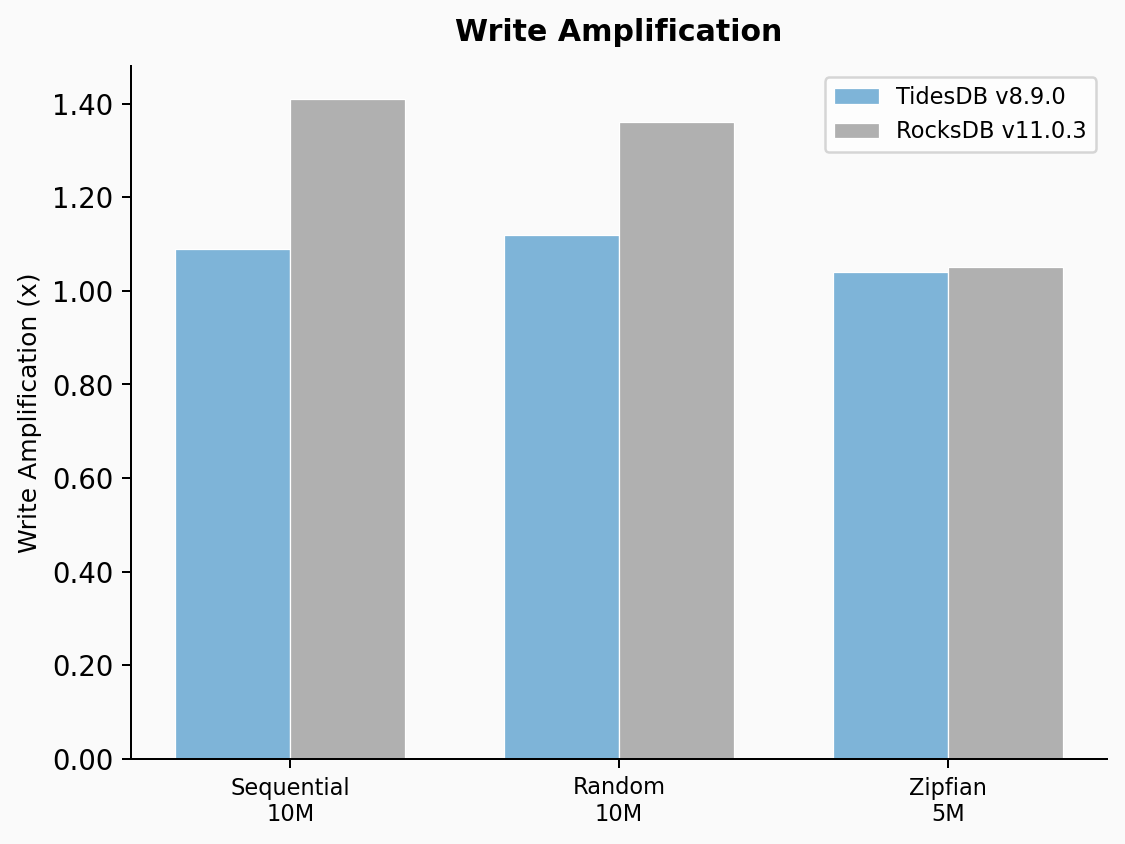
TidesDB showed 1.09x write amplification on sequential writes versus 1.41x for RocksDB. Random was 1.12x versus 1.36x. Zipfian was 1.04x versus 1.05x (very close because Zipfian concentrates writes on a small key set).
On-disk database size
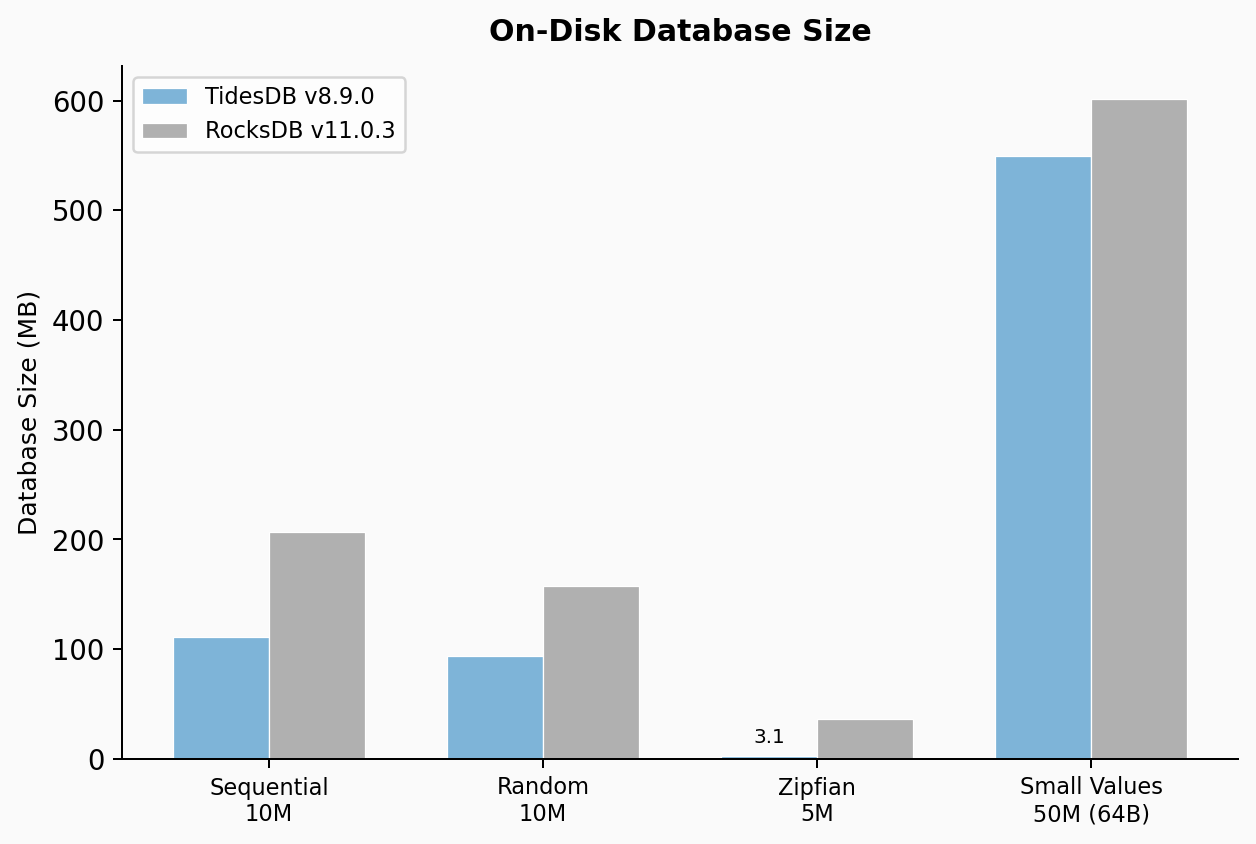
TidesDB produced a 110.66 MB database for the sequential 10M key test versus 206.65 MB for RocksDB. Random writes showed 94.06 MB versus 157.60 MB. Zipfian was 3.09 MB versus 36.57 MB, a 11.8x difference. The small values test at 50M operations showed 549 MB versus 602 MB. Space amplification on the standard workloads is consistently lower for TidesDB.
This minor did not introduce any regressions.
You can find the raw data below:
| File | SHA256 Checksum |
|---|---|
| tidesdb_rocksdb_benchmark_results_20260315_233915.csv | 6bf77fe89f23207a1ae171a94fb4149325be3e1b81aa69ee51b74aa0af14145d |
| tidesdb_rocksdb_benchmark_results_20260315_233915.txt | 290bd306650b7017fb602b6036d299d6000402fa90dea19001874f47cd4a55a8 |
That’s all for now.
Thank you for reading!