Benchmark Analysis on TidesDB v9.2.1 and RocksDB v11.1.1

published on May 14th, 2026
I am back with a new benchmark analysis article and today we will be looking at the data on the latest patch of TidesDB and RocksDB, v9.2.1 and v11.1.1 respectively.
Both bring bug corrections and optimizations in which you can read about further in their release pages.
With that let’s dive in, before we do the specs for the environment are
- AMD Ryzen Threadripper 2950X (16 cores 32 threads) @ 3.5GHz
- 128GB DDR4
- Ubuntu 22.04 x86_64
- GCC (glibc)
- XFS raw NVMe (SAMSUNG MZVLB512HAJQ-00000) with discard, inode64, nodiratime, noatime, logbsize=256k, logbufs=8
It’s a Hetzner dedicated server.
I ran the TidesDB benchtool program using script tidesdb_rocksdb_old.sh, which is the usual for my analysis.
The runner was executed three times and reported numbers are the median. Run to run spread stays under 10% for every headline result, with one exception on the cold random read workload. Keys are 16 B and values are 100 B unless noted. Both engines share a 64 MB write buffer, 64 MB block cache, 10 bits per key bloom filters, LZ4 compression, and 8 shared background flush and compaction threads.
Throughput
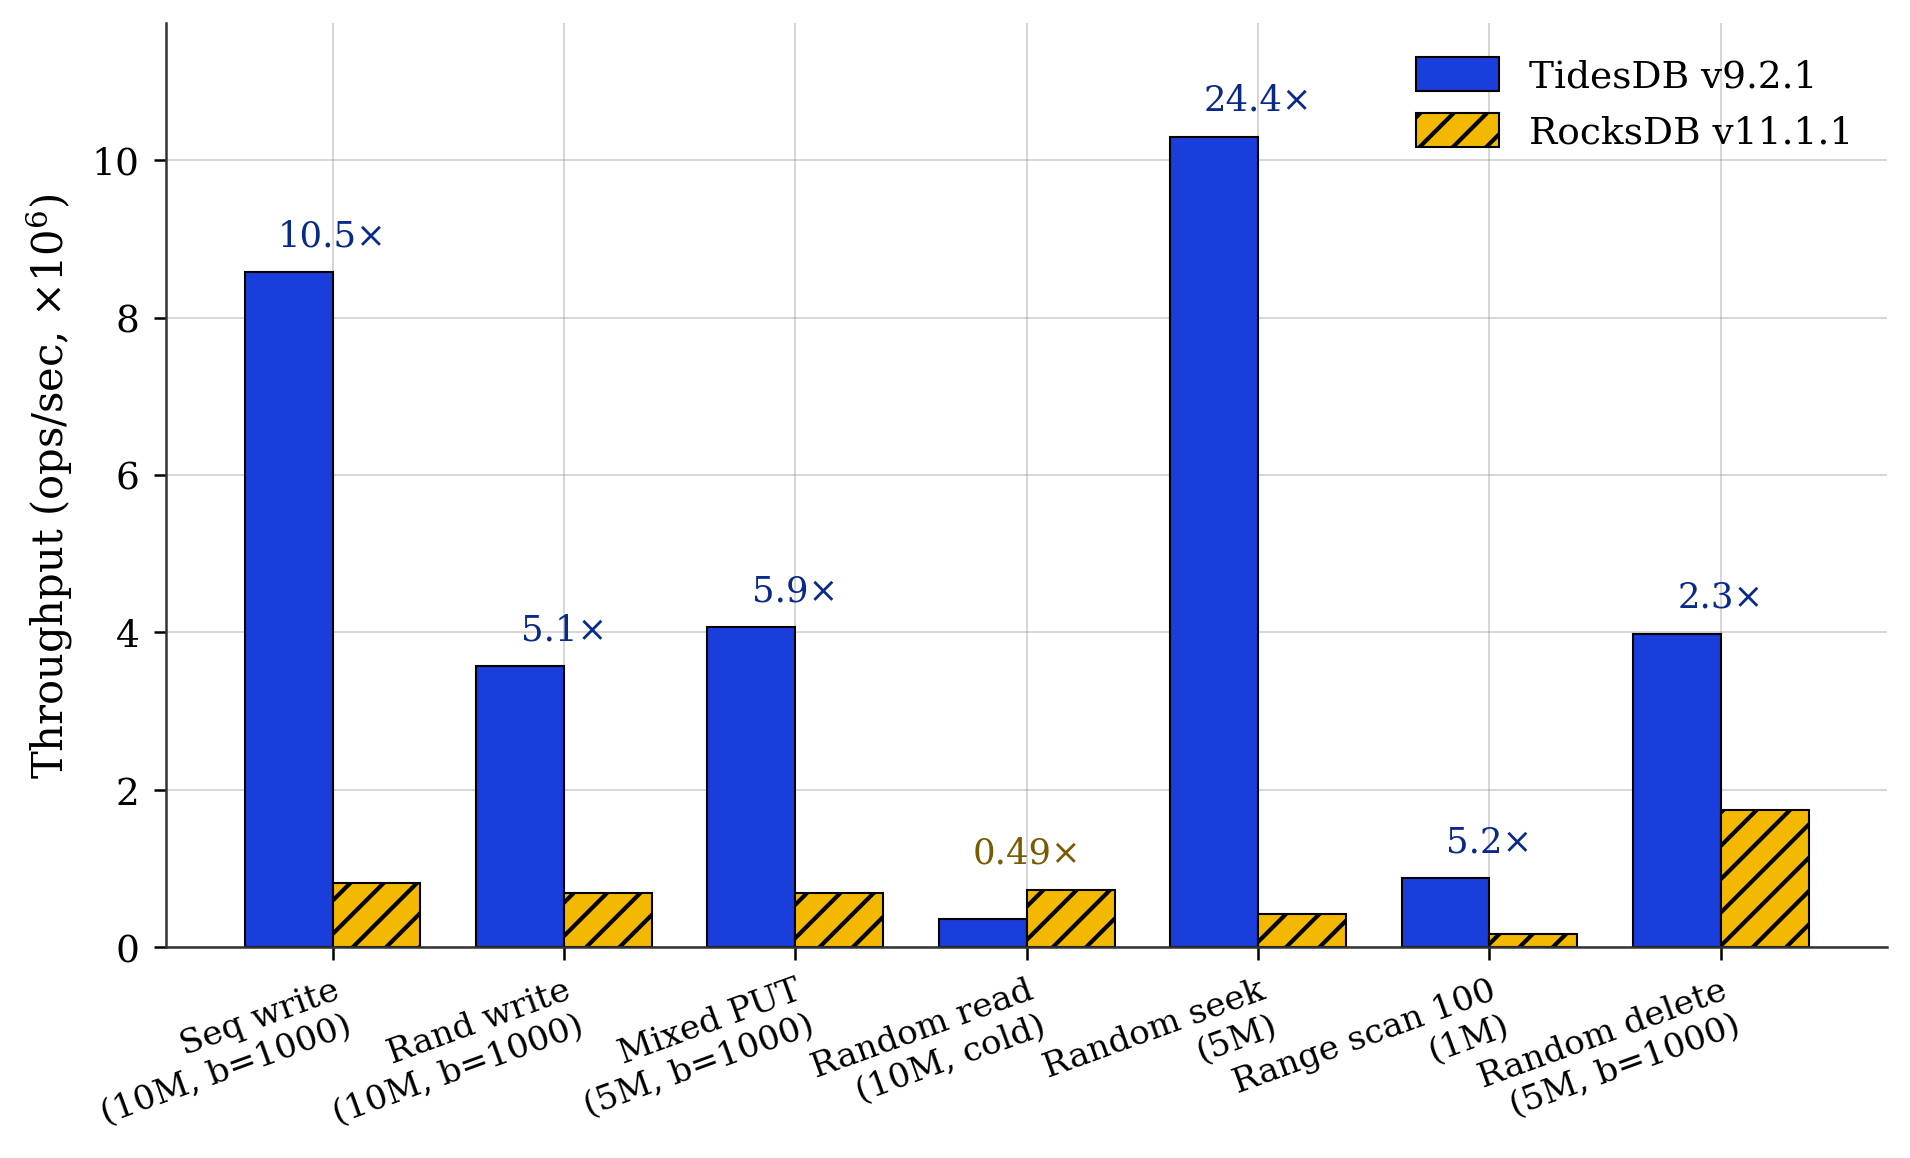 Fig. 1. Throughput across seven representative workloads (ops/sec, median of three runs). Annotations show the TidesDB over RocksDB ratio.
The ratios in Fig. 1 break into three groups.
Writes and deletes go to TidesDB. Sequential write reaches 10.5x, random write 5.1x, mixed PUT 5.9x, and random delete 2.3x. The ingest path stays fast as the write buffer fills.
Seek and range go to TidesDB by a larger margin. Random seek lands at 24.4x and range scan at 5.2x. The seek workload exercises the in memory block index without iterator setup cost.
Cold random read goes to RocksDB at 0.49x. After a full populate and flush, RocksDB serves random GETs about 2x faster than TidesDB. This is the one workload where the comparison is unambiguously the wrong way around.
Batching
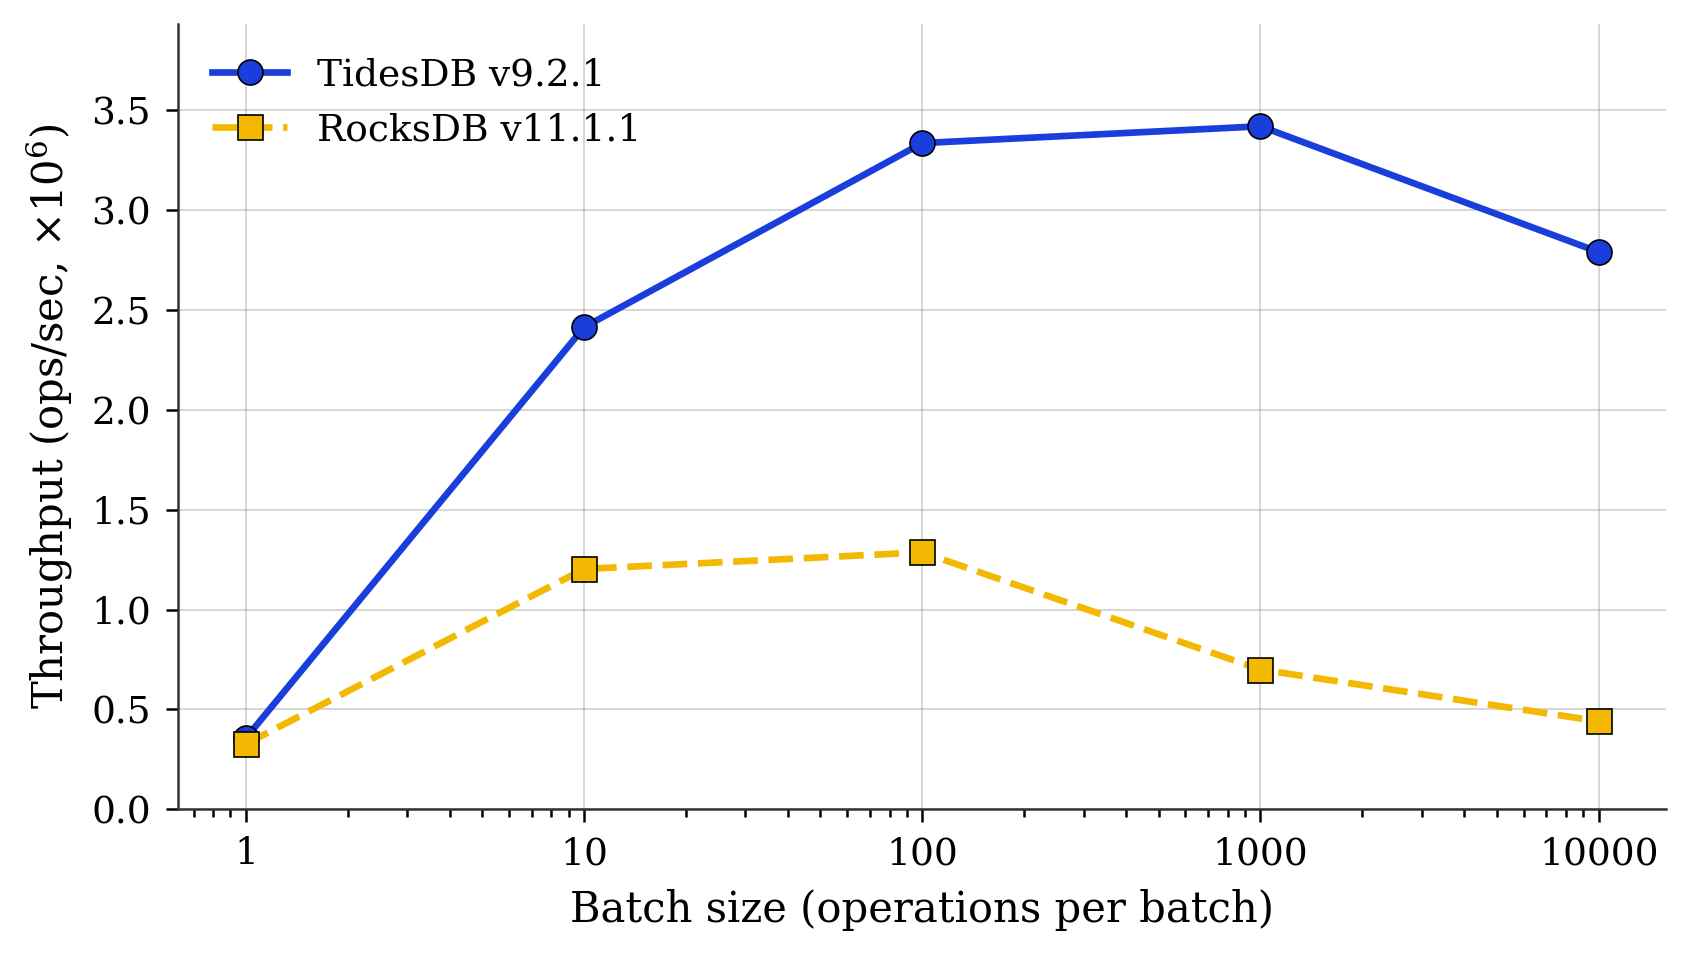 Fig. 2. Random PUT throughput vs batch size (10M ops, 8 threads, log x).
Fig. 2 is sharp. At batch size 1, both engines sit near 350k ops/s and stay within 9% of each other. From there, TidesDB rises smoothly to a 3.4M plateau around batch 1000, with a modest regression at batch 10000. RocksDB peaks earlier and lower at batch 100 (1.29M), then drops sharply to 700k at batch 1000 and 441k at batch 10000.
The ratio at batch 10000 is 6.3x. If a workload submits one PUT at a time, the engines are roughly equivalent. If it batches, the gap is the whole story. Deletes show the same shape, with 1.06x at batch 1 and 2.9x at batch 100.
Latency tails
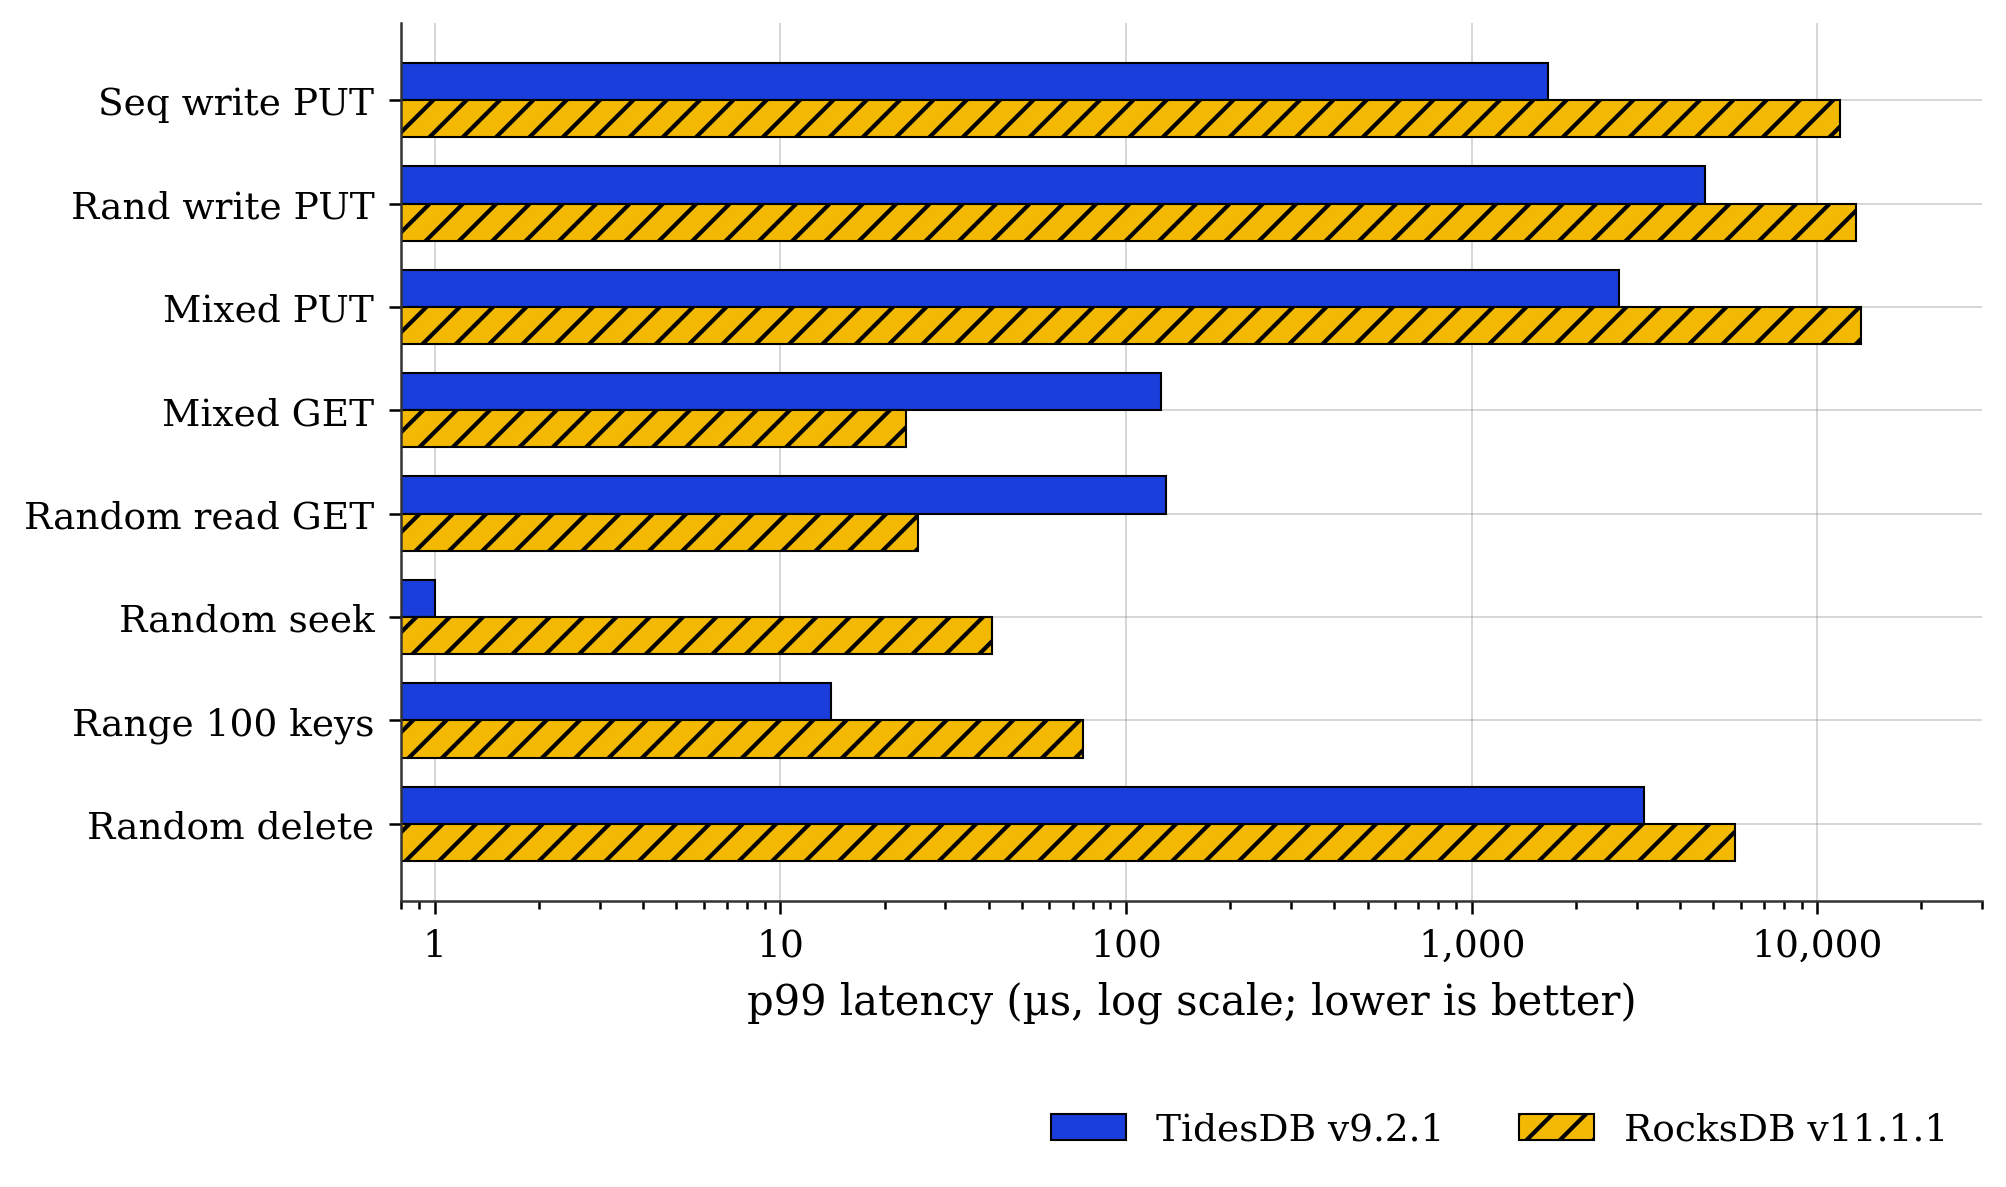 Fig. 3. p99 latency by workload (µs, log scale, lower is better).
Fig. 3 separates two effects that the throughput numbers conflate.
On the write side, TidesDB has lower p99 by roughly an order of magnitude. Sequential PUT lands at 1.7 ms versus 11.7 ms, random PUT at 4.7 ms versus 13.0 ms, and mixed PUT at 2.7 ms versus 13.3 ms. RocksDB’s CV% is tighter (7 to 8% against TidesDB’s 26 to 33%), so per operation cost is more uniform. It is also uniformly slow. TidesDB’s tail is wider in shape but smaller in magnitude.
On the read side, the picture inverts. Mixed GET p99 is 126 µs on TidesDB versus 23 µs on RocksDB. Random read GET is 130 µs versus 25 µs. RocksDB is also more consistent here, with CV% near 50% against TidesDB’s 175 to 205%. This is the same observation as Fig. 1. The GET path has work to do.
Seek and range invert this back. TidesDB random seek p99 is 1 µs against 41 µs for RocksDB. Range 100 p99 is 14 µs against 75 µs.
Amplification and disk footprint
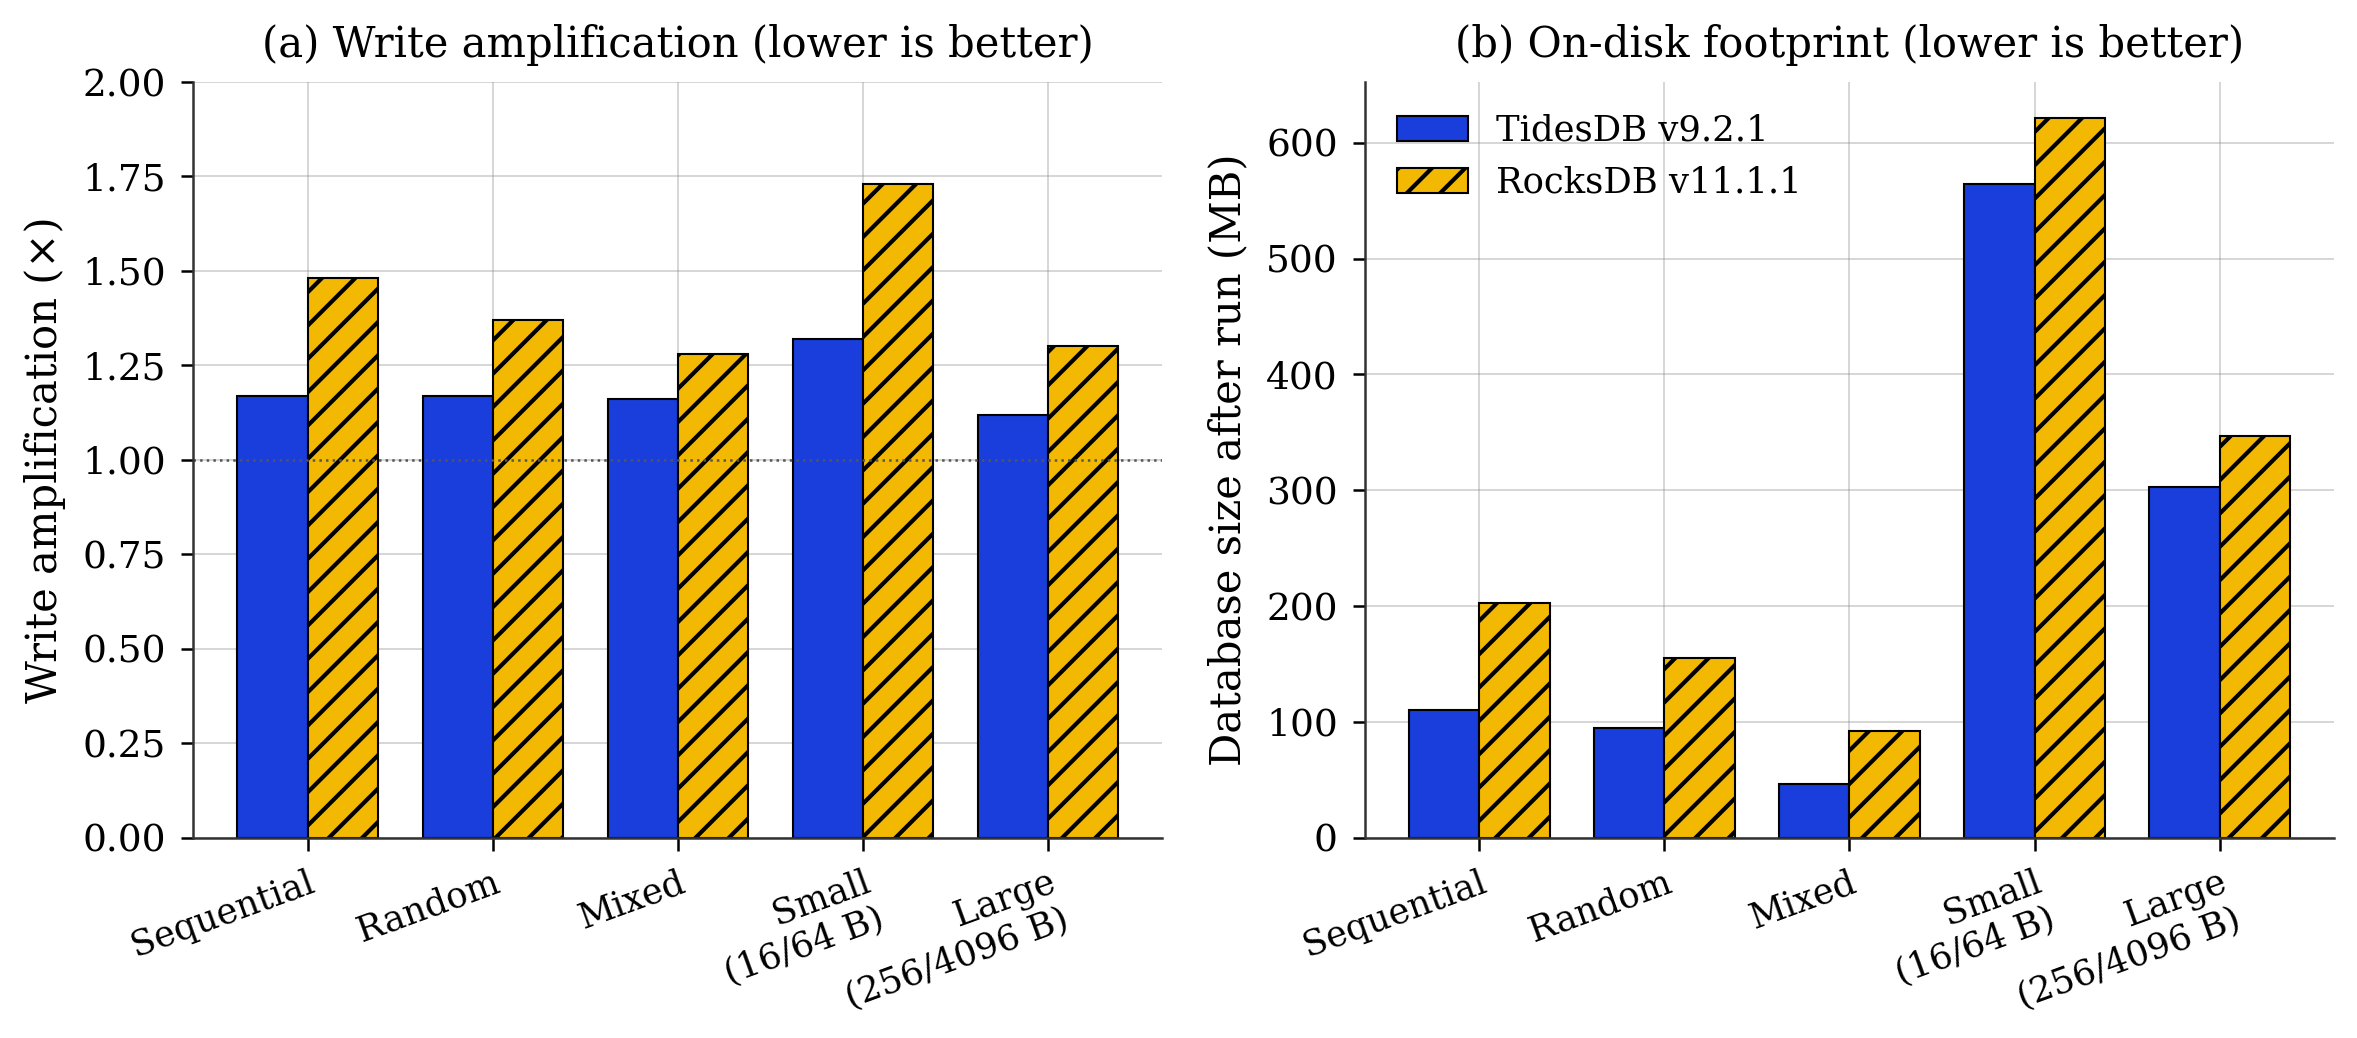 Fig. 4. (a) Write amplification by workload, with the dotted line marking the no amplification floor at 1.0x. (b) On disk database size after the run.
Write amplification (Fig. 4a) is lower for TidesDB on every workload. TidesDB sits at 1.12x to 1.32x against RocksDB at 1.30x to 1.73x. The gap is widest on the small value workload (16 B keys, 64 B values), where compaction overhead dominates, with 1.32x against 1.73x. Translated to bytes written on the SSD, that is the difference between 5.04 GB and 6.60 GB for the same 50M op workload.
On disk footprint (Fig. 4b) tracks the same pattern. After the random 10M run, TidesDB holds 94 MB on disk against RocksDB’s 155 MB. After the mixed run, 46 MB against 92 MB, which is roughly half the space for the same logical data under the same compression algorithm.
The cost lives in memory. Peak RSS on the 10M write runs is 1.20 GB for TidesDB against 414 MB to 811 MB for RocksDB. The ingest path that buys faster PUTs and lower write amplification buys them with larger in memory structures, and this shows up on the scale.
Three results are unambiguous. Write throughput scales with batch size further on TidesDB than on RocksDB. Seek and range query throughput are several fold higher in many cases. Write amplification and on disk footprint are consistently smaller.
Two results require work on our end. Cold random read GET throughput is half of RocksDB’s, and the run to run spread on that single workload is 37%, substantially higher than the under 10% spread elsewhere in the suite.
With that.
Thank you for reading!
—
Data compressed: tidesdb_rocksdb_benchmark_results_20260515_0.zip (sha256: b494461279cd43d97f0ce4e6c23da2596815054cd6f36479aabb1e4409f178f1)