
sysbench zipfian read-write Analysis on TidesDB v9.3.11/TideSQL v4.5.9, RocksDB (MyRocks), in MariaDB v11.8.6
published on July 8th, 2026
In this short article I’ll be going through some reproducible sysbench analysis I ran today. The analysis I am running stresses TidesDB, and RocksDB in MariaDB v11.8.6 utilizing sysbench read-write.
I use this simple script and run a few different variations of read-write. I modified configurations between some runs, while ensuring a clean state for each one, engine directories and tables were completely wiped, servers restarted.
- 8 threads, 4 tables, 1m rows per table, 60 seconds, zipfian(exp=0.8), no warmup
- 24 threads, 4 tables, 2.5m rows per table, 300 seconds, zipfian(exp=0.8), no warmup
- 8 threads, 4 tables, 5m rows per table, 120 seconds, zipfian(exp=0.8), no warmup, same seed (2024), LZ4 compressed, TidesDB unified memtable OFF
- 8 threads, 4 tables, 5m rows per table, 120 seconds, zipfian(exp=0.8), no warmup, same seed (2024), LZ4 compressed, TidesDB unified ON
- 512 threads, 4 tables, 1m rows per table, 60 seconds, zipfian(exp=0.8), no warmup, same seed (2024), LZ4 compressed, TidesDB unified ON
- 512 threads, 4 tables, 1m rows per table, 60 seconds, zipfian(exp=0.8), no warmup, same seed (2024), NO compressed, TidesDB unified ON
For basline both engines have their cache and write buffers in parity. TidesDB is utilizing unified mode, thus setting block cache to 128mb and write buffer to 128mb, as opposed to the non unified write buffer of 64mb, similar to RocksDB. L0 and L1 queues are brought down to parity for both engines to reach graduated back-pressure similarly. I am using RC read committed isolation level for both engines, and durability is off on both. Runs 1 and 2 are uncompressed, from run 3 on both engines run LZ4.
My environment:
- Intel Core i7-11700K, 8 cores and 16 threads, at 3.6GHz
- 48 GiB DDR4
- Ubuntu 23.03, Linux 6.2.0 x86_64
- WD Blue WDS500G2B0A, a consumer SATA SSD, ext4
- gcc 12.3.0, linked against jemalloc
- TidesDB v9.3.11
My base cnf:
[mysqld]basedir = /media/agpmastersystem/c794105c-0cd9-4be9-8369-ee6d6e707d68/home/bench/mariadbdatadir = /media/agpmastersystem/c794105c-0cd9-4be9-8369-ee6d6e707d68/home/bench/mariadb/dataport = 3306socket = /tmp/mariadb.sockuser = agpmastersystempid-file = /media/agpmastersystem/c794105c-0cd9-4be9-8369-ee6d6e707d68/home/bench/mariadb/data/mariadb.pidlog-error = /media/agpmastersystem/c794105c-0cd9-4be9-8369-ee6d6e707d68/home/bench/mariadb/data/mariadb.errinit_file = /media/agpmastersystem/c794105c-0cd9-4be9-8369-ee6d6e707d68/home/bench/mariadb/init.sqlplugin_load_add = ha_rocksdb.so;ha_tidesdb.soplugin_maturity = gammabind-address = 127.0.0.1max_connections = 4096table_open_cache = 16384table_open_cache_instances = 16back_log=1500default_password_lifetime=0ssl=0performance_schema=OFFmax_prepared_stmt_count=128000skip_log_bin=1character_set_server=utf8mb4collation_server=utf8mb4_general_cithread_cache_size = 256transaction_isolation = READ-COMMITTEDdefault_storage_engine = MyISAMdefault_tmp_storage_engine = MyISAMrocksdb_block_cache_size = 128Mrocksdb_max_background_jobs = 8rocksdb_flush_log_at_trx_commit = 0rocksdb_default_cf_options = "compression=kNoCompression;write_buffer_size=64m;target_file_size_base=64m;max_bytes_for_level_base=1g;level0_file_num_compaction_trigger=4;level0_slowdown_writes_trigger=5;level0_stop_writes_trigger=10;max_write_buffer_number=4;block_based_table_factory={cache_index_and_filter_blocks=1;filter_policy=bloomfilter:10:false;whole_key_filtering=1};level_compaction_dynamic_level_bytes=true;optimize_filters_for_hits=true;compaction_pri=kMinOverlappingRatio"rocksdb_compaction_sequential_deletes_count_sd = 1rocksdb_compaction_sequential_deletes = 199999rocksdb_compaction_sequential_deletes_window = 200000tidesdb_unified_memtable = ONtidesdb_unified_memtable_sync_mode = NONEtidesdb_default_sync_mode = NONEtidesdb_block_cache_size = 128Mtidesdb_unified_memtable_write_buffer_size = 128Mtidesdb_flush_threads = 8tidesdb_max_concurrent_flushes = 0tidesdb_compaction_threads = 8tidesdb_max_open_sstables = 0tidesdb_default_isolation_level = READ_COMMITTEDtidesdb_default_compression = NONEtidesdb_default_bloom_filter = ONtidesdb_default_bloom_fpr = 10tidesdb_default_l0_queue_stall_threshold = 10tidesdb_default_l1_file_count_trigger = 4tidesdb_default_block_index_prefix_len = 32tidesdb_default_klog_value_threshold = 1024tidesdb_default_tombstone_density_trigger = 5000tidesdb_default_tombstone_density_min_entries = 2048tidesdb_log_level = NONEtidesdb_print_all_conflicts = OFFjoin_buffer_size=32Ksort_buffer_size=32Kslow_query_log = OFF[client]port = 3306socket = /tmp/mariadb.sock[mysqldump]quickmax_allowed_packet = 64M[mariadb-backup][mysqld_safe]malloc-lib=/lib/x86_64-linux-gnu/libjemalloc.so.2Run 1
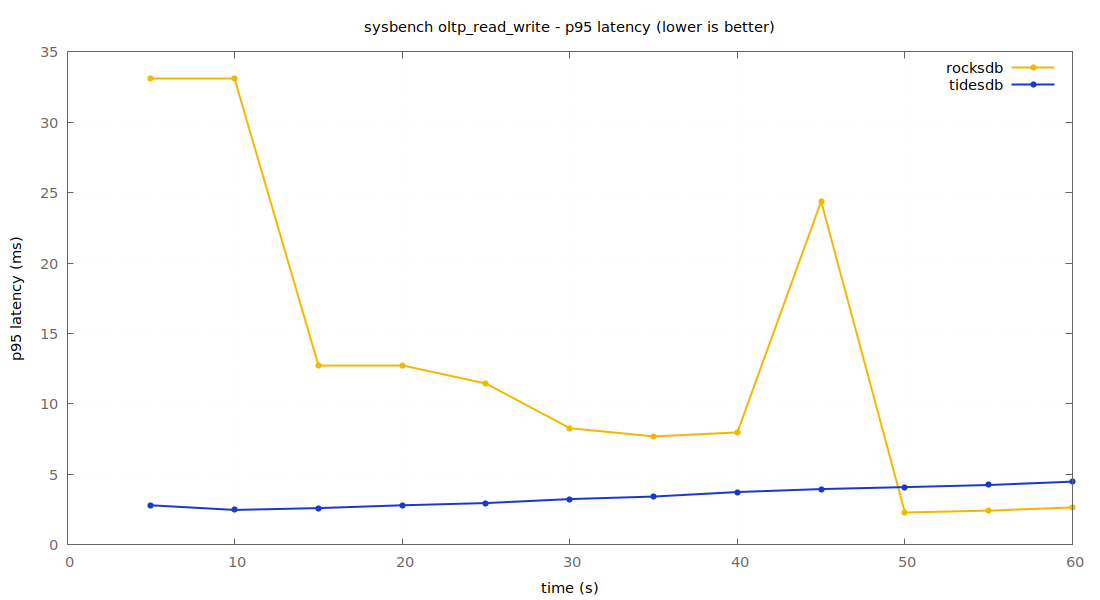
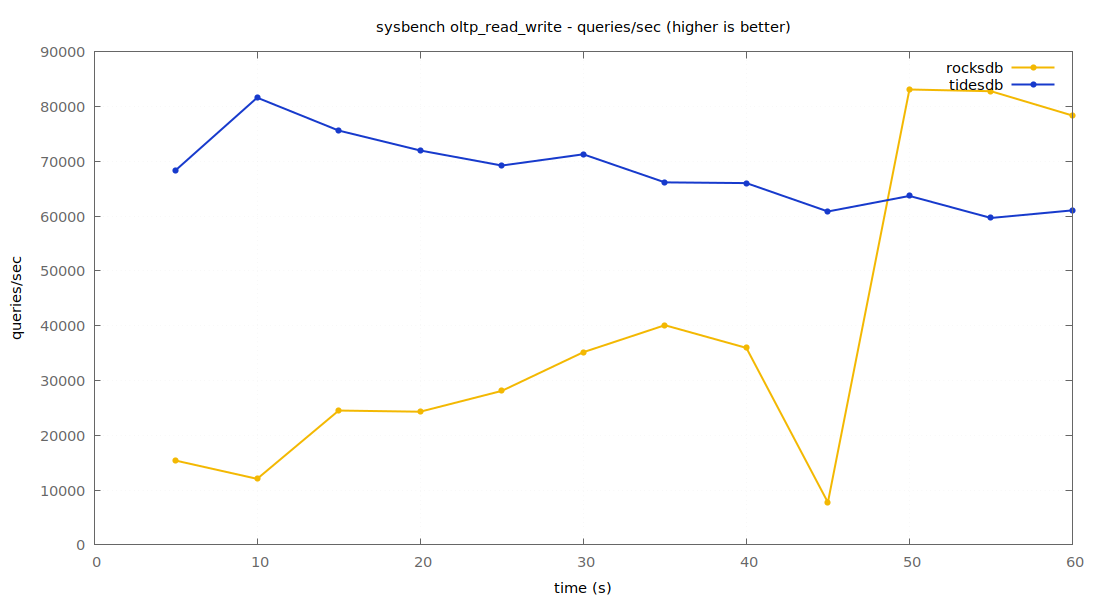
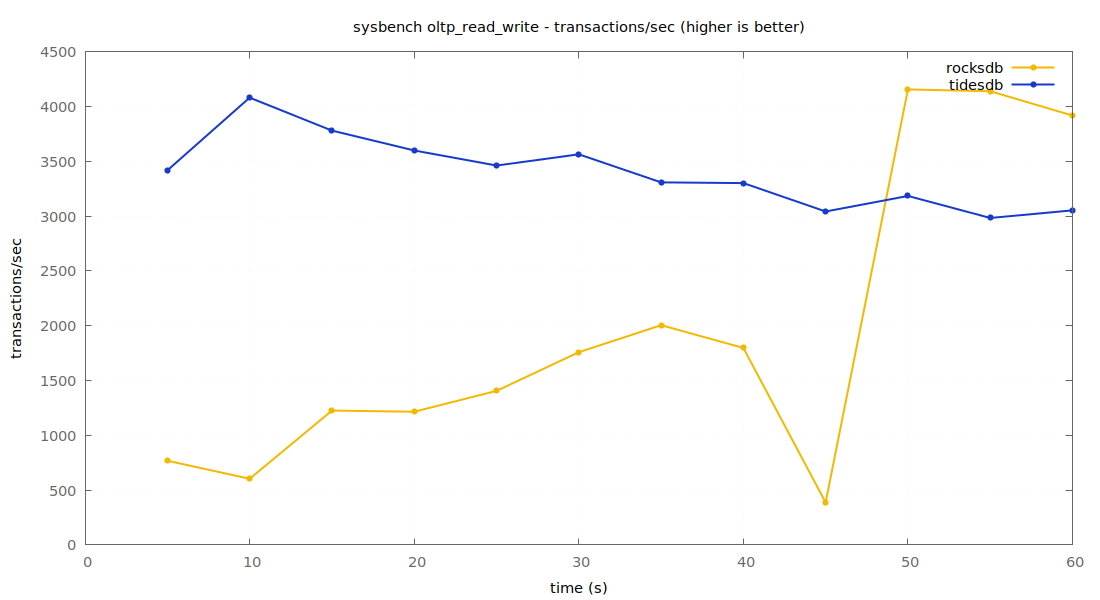
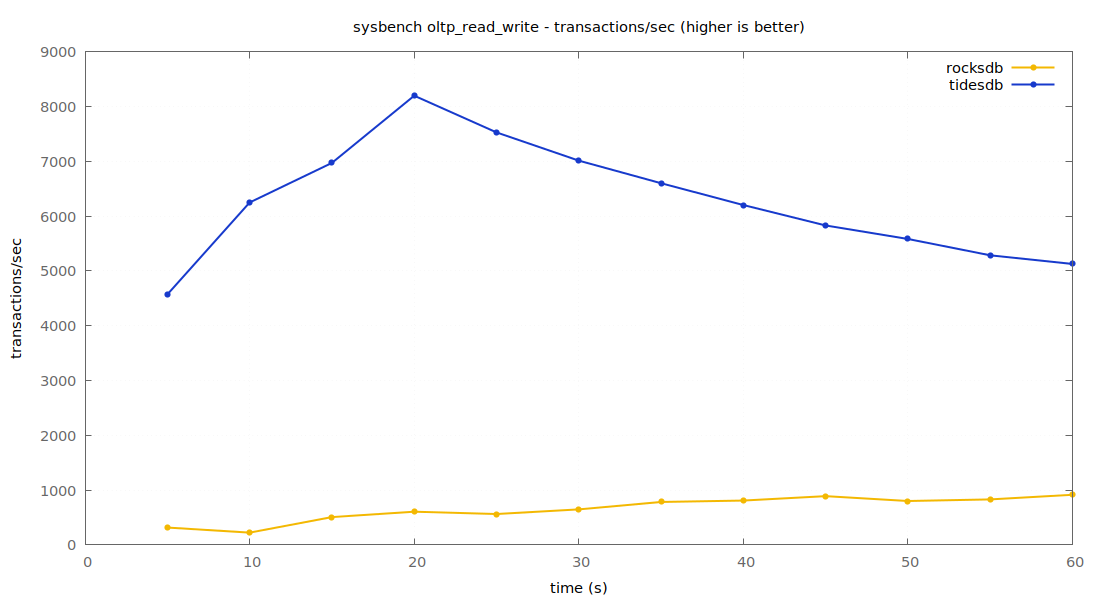
The baseline, no compression, 8 threads. TidesDB runs ~3.3k tps to RocksDB’s ~1.9k, and holds p95 at 3.55ms against 10.84ms. Clean, zero errors on both.
P95
QPS
TPS
Run 2
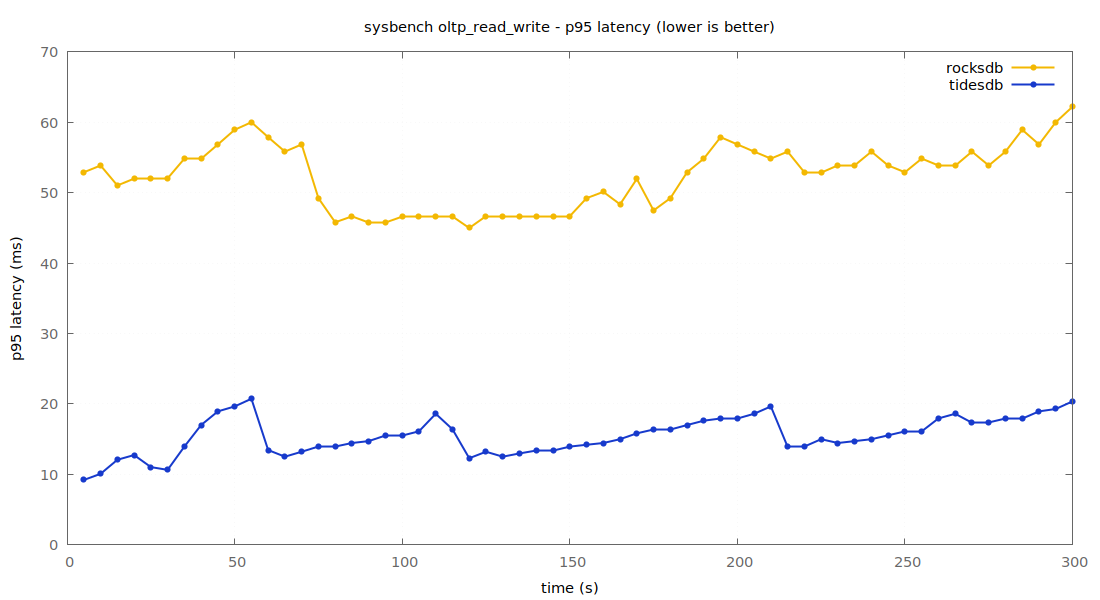
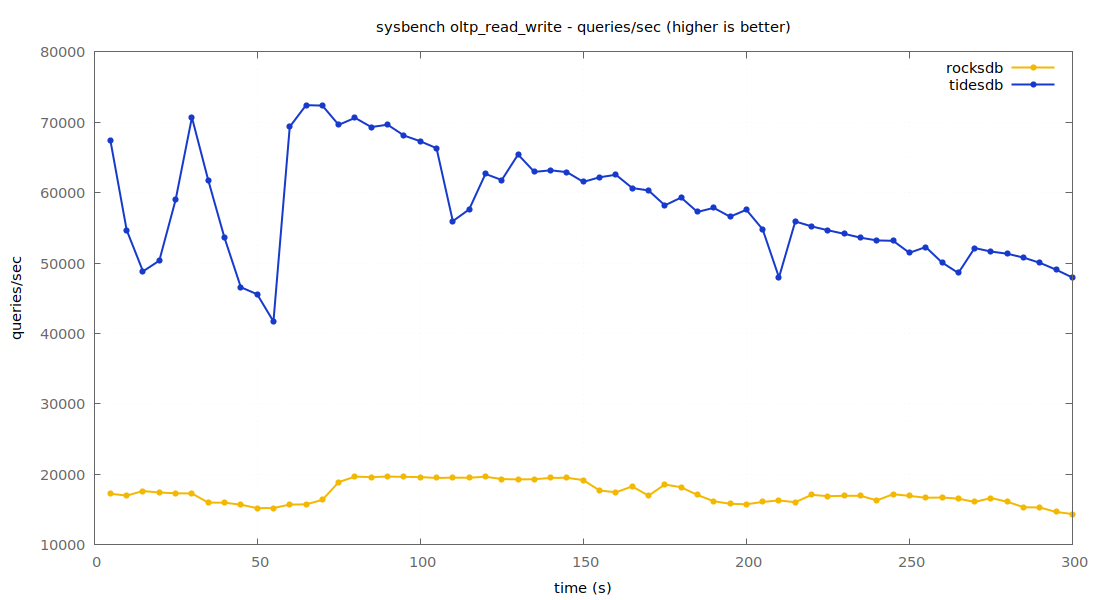
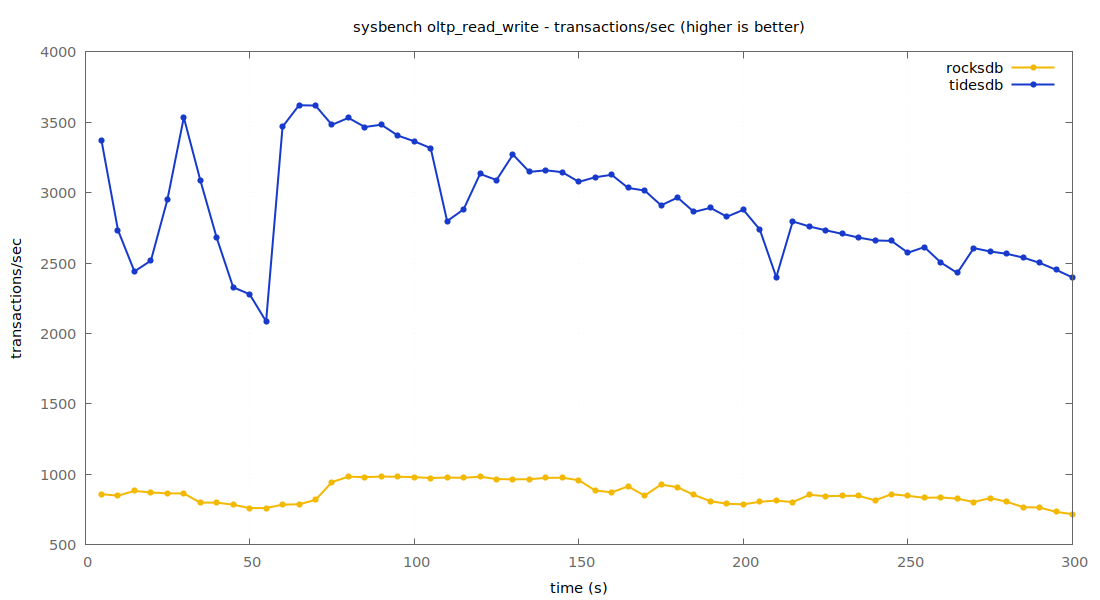
More threads, more rows, longer run. TidesDB holds ~2.9k tps versus ~866, and keeps p95 at 15.83ms while RocksDB climbs to 52.89ms. TidesDB has one latency spike to ~3.3s max, RocksDB stays tighter at the very tail.
Run 3
tidesdb_unified_memtable = OFF tidesdb_default_compression = LZ4 rocksdb_default_cf_options >> compression=kLZ4Compression (prepended)
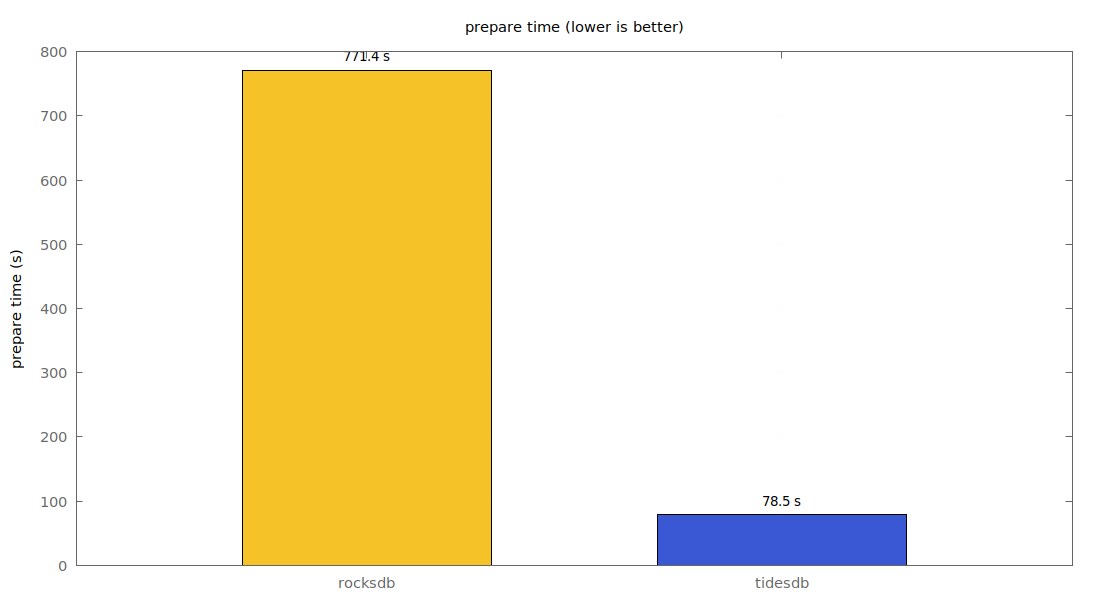
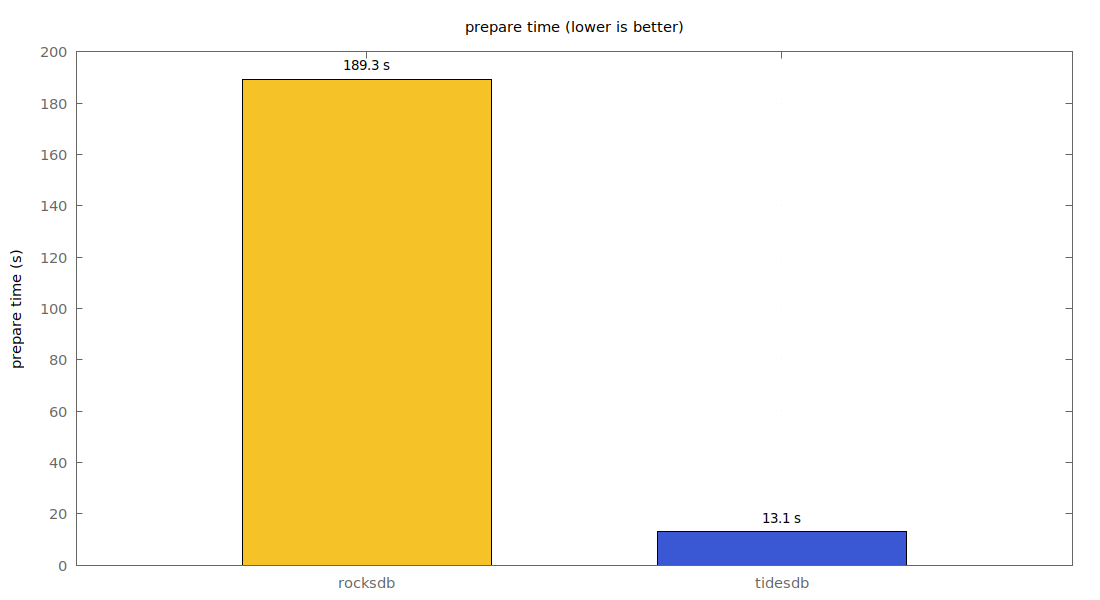
TidesDB zipfian prepare is mighty fast as seen below, 78s against RocksDB’s 771s over the same 20m rows.
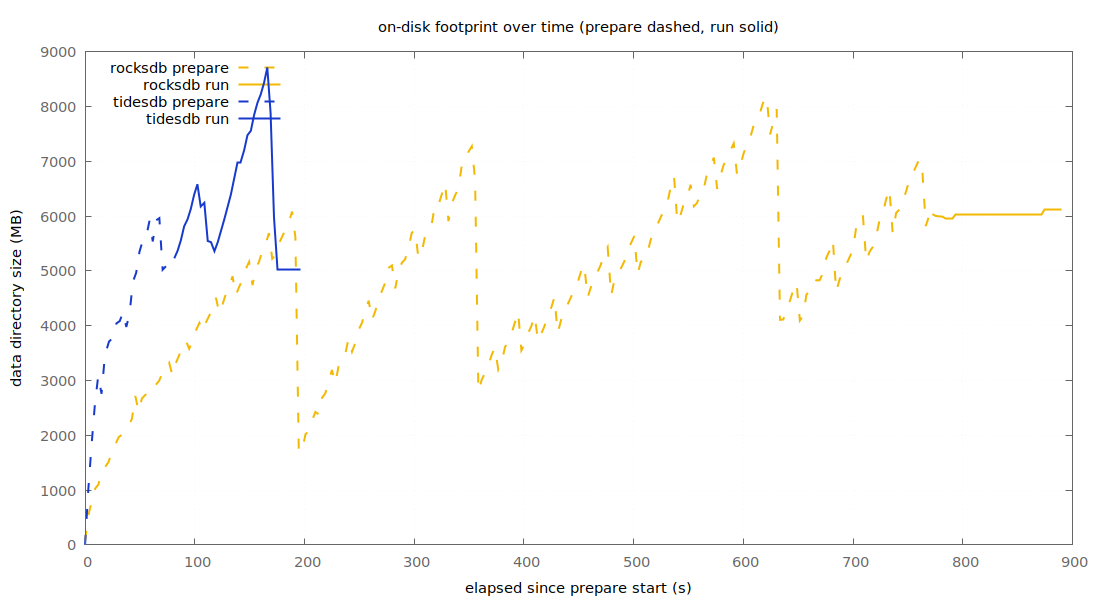
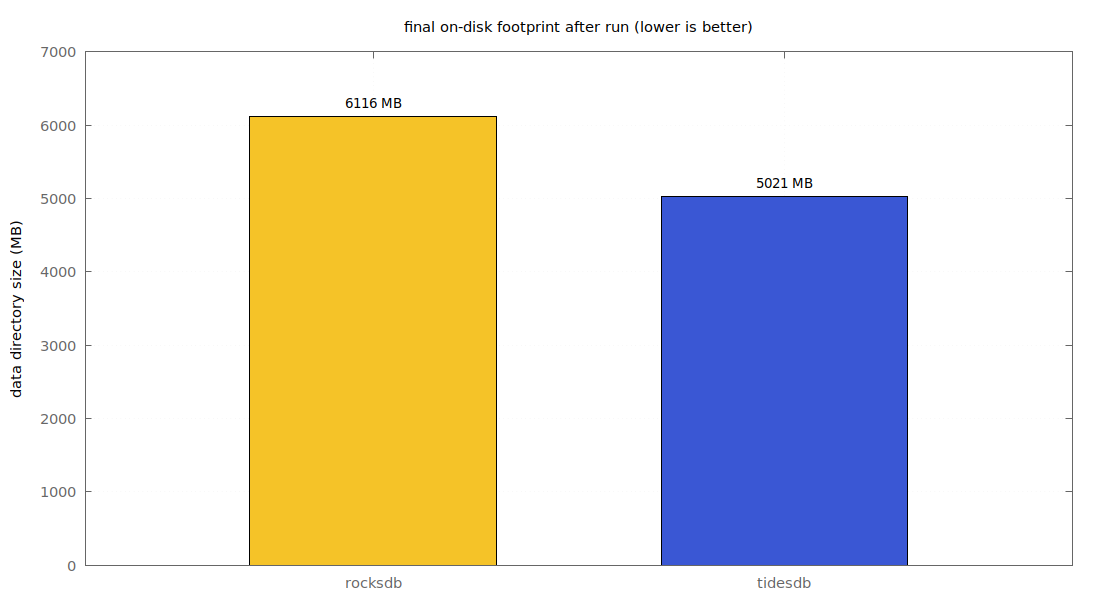
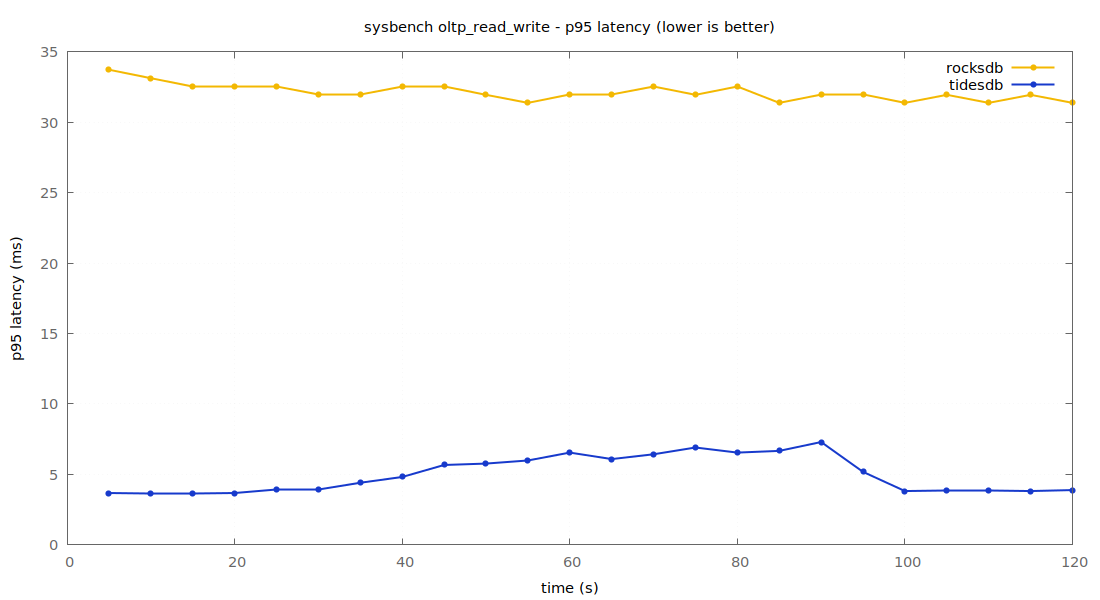
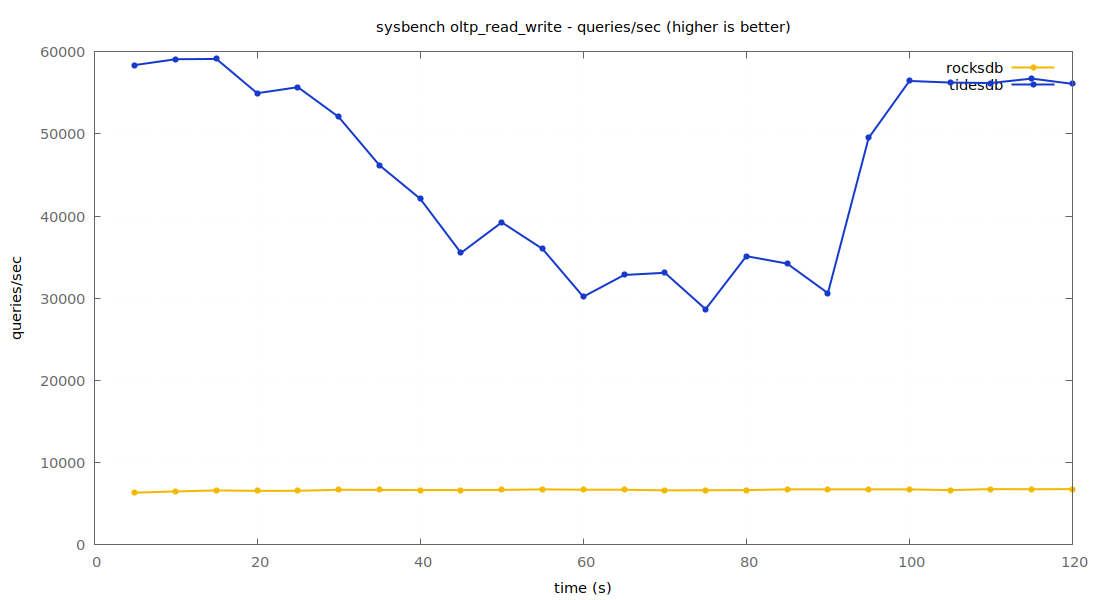
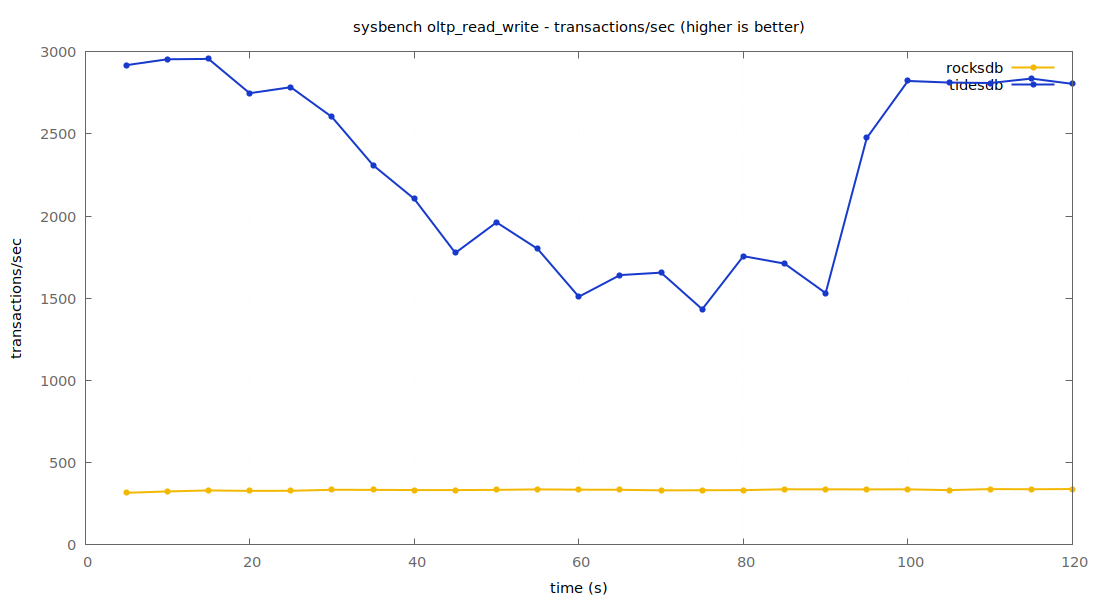
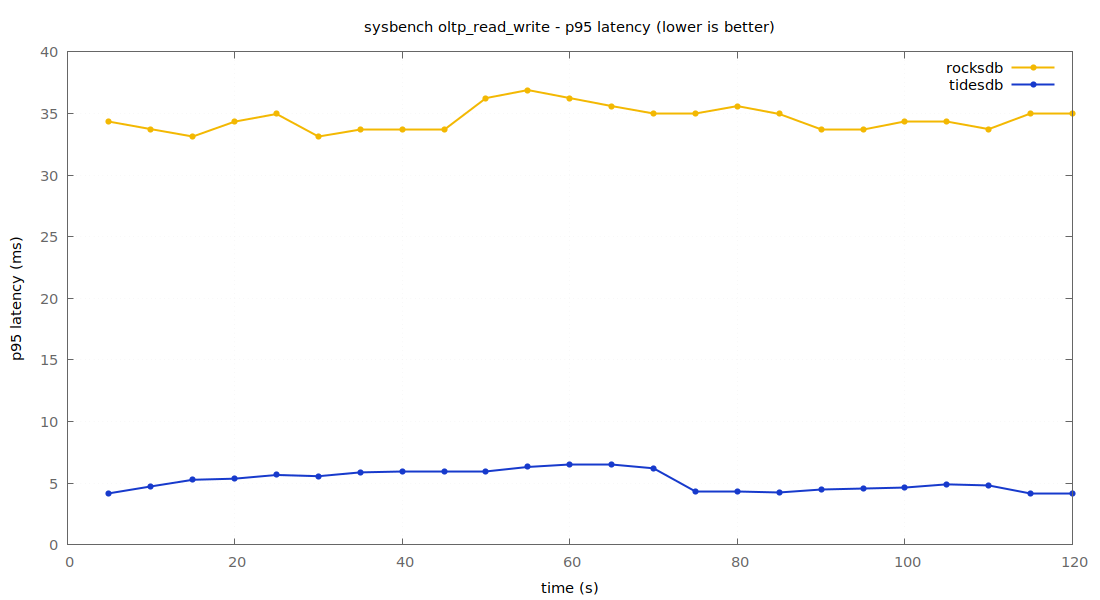
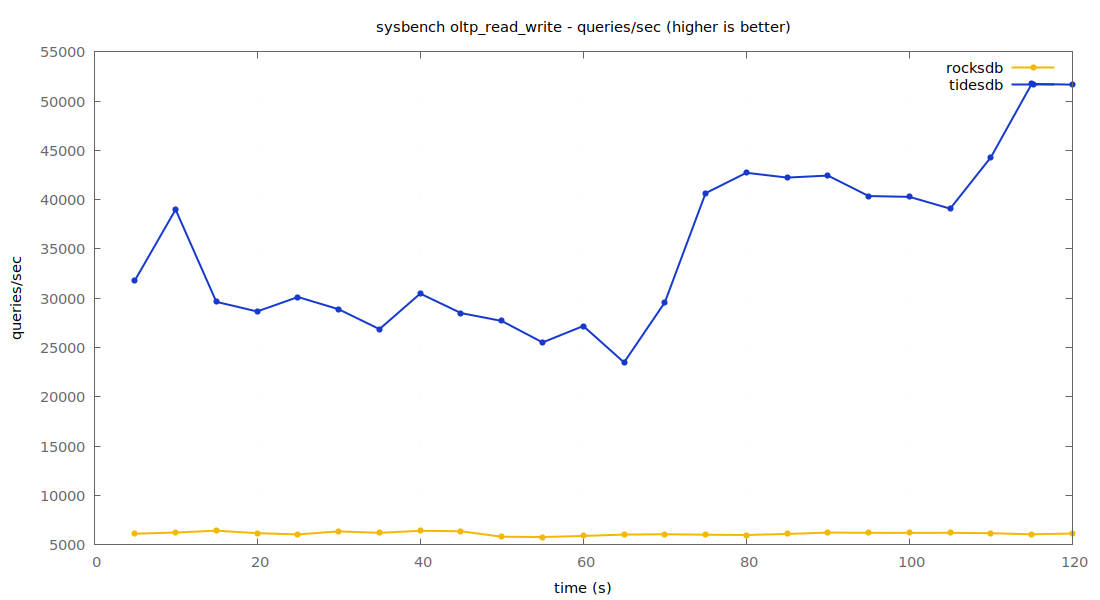
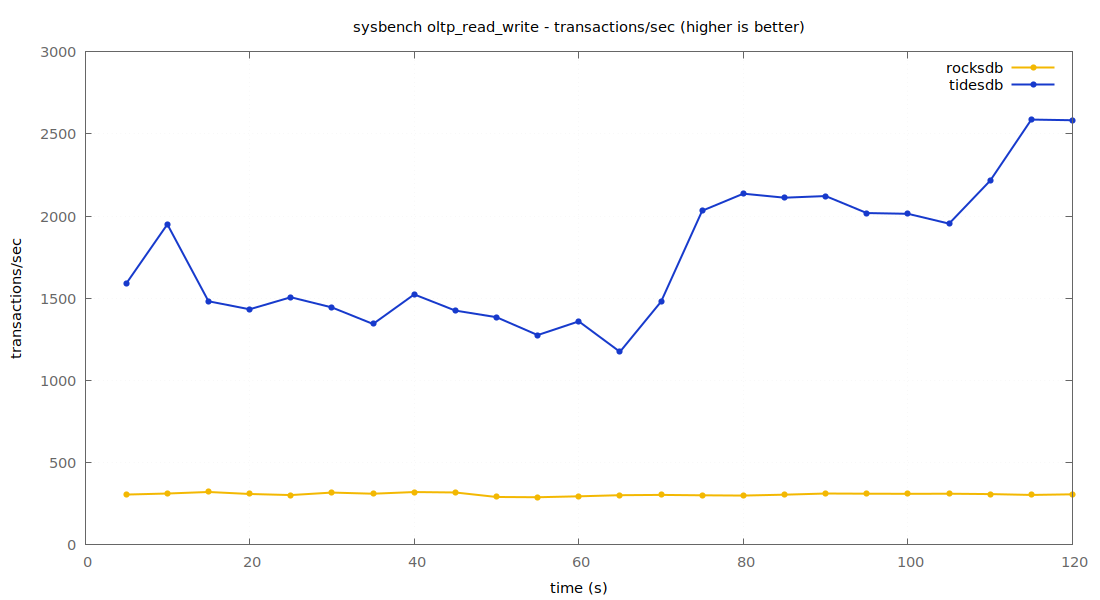
TidesDB takes less space in this run, 5.0 GB against 6.1 GB. On throughput it holds ~2.3k tps to RocksDB’s ~334, with p95 5.37ms against 31.94ms.
Run 4
tidesdb_unified_memtable = ON tidesdb_default_compression = LZ4 rocksdb_default_cf_options >> compression=kLZ4Compression (prepended)
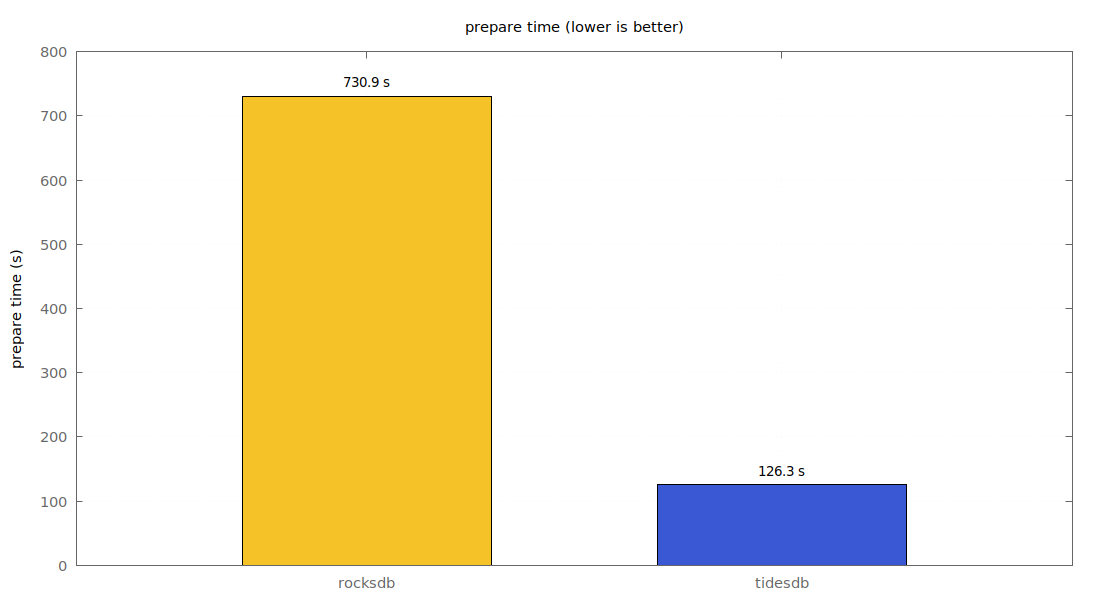
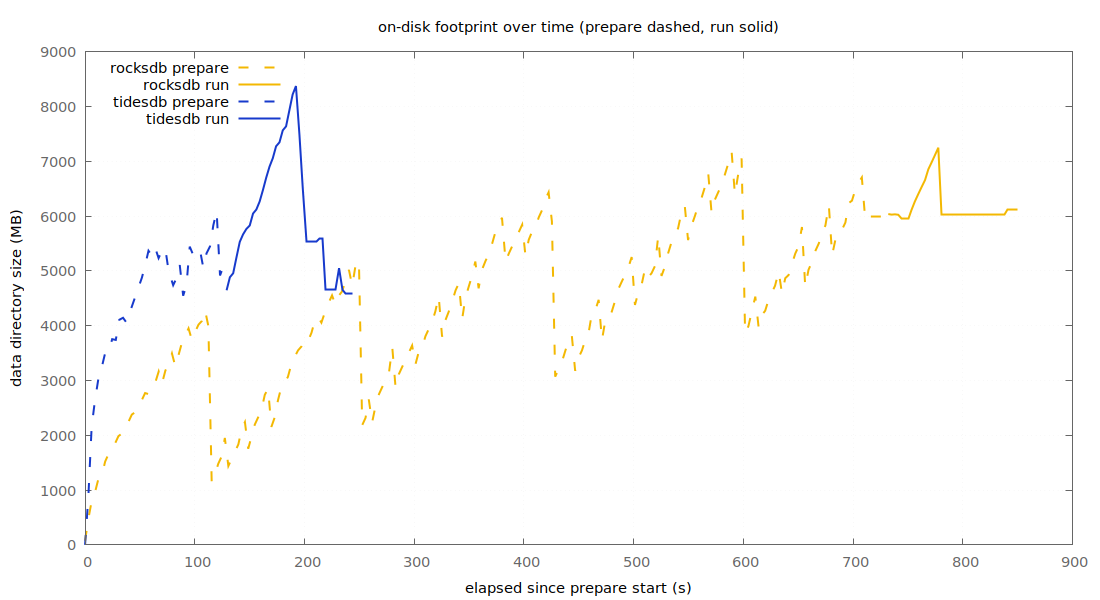
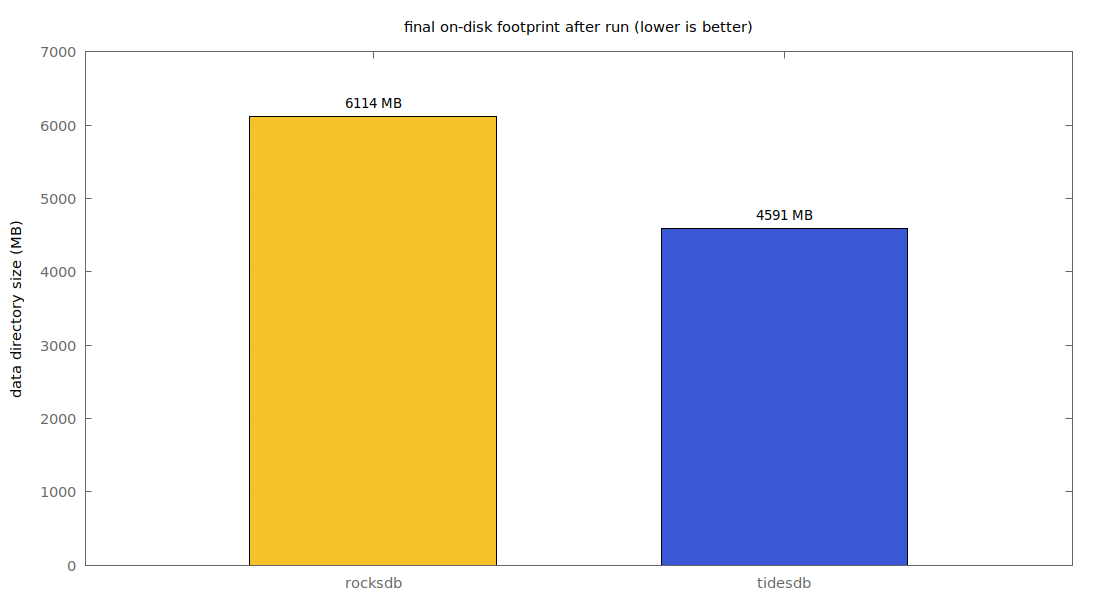
Same shape as run 3 with the unified memtable back ON. TidesDB settles ~1.76k tps, prepares in 126s, and the footprint drops further to 4.6 GB, the smallest of the 5m row runs. RocksDB is unchanged around 307 tps and 6.1 GB. Interesting note, unified OFF (run 3) was quicker to prepare and higher throughput here, unified ON traded some of that for a smaller footprint.
Run 5 512 thread madness.
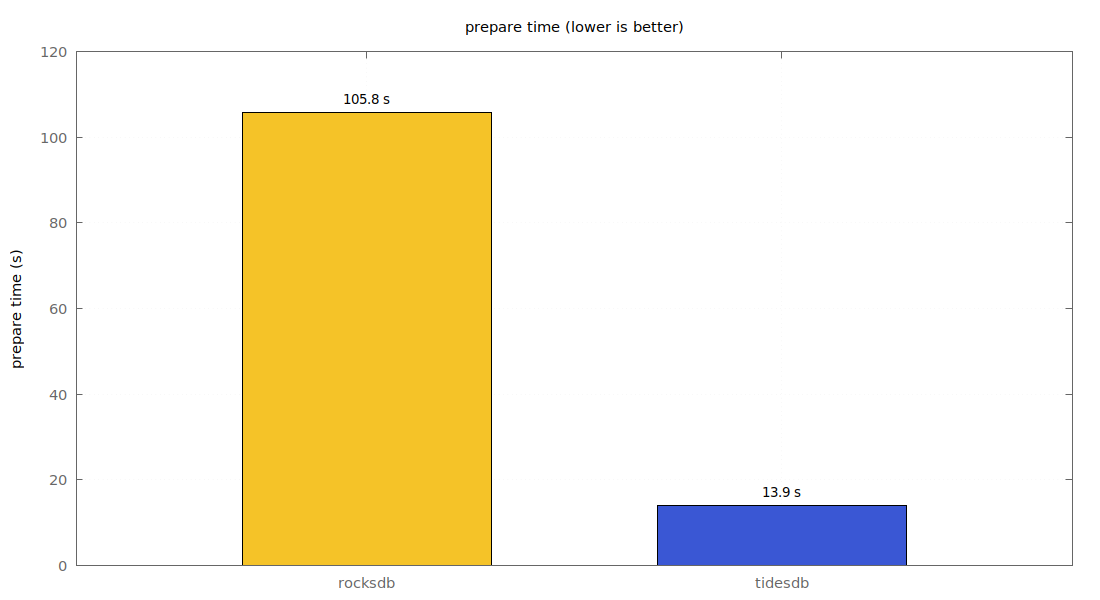
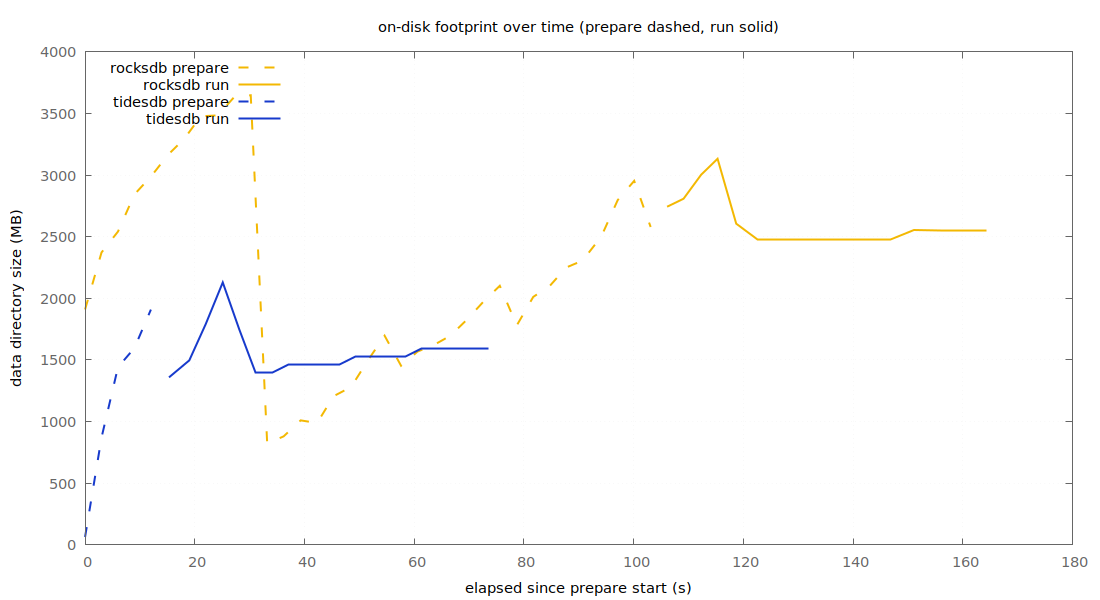
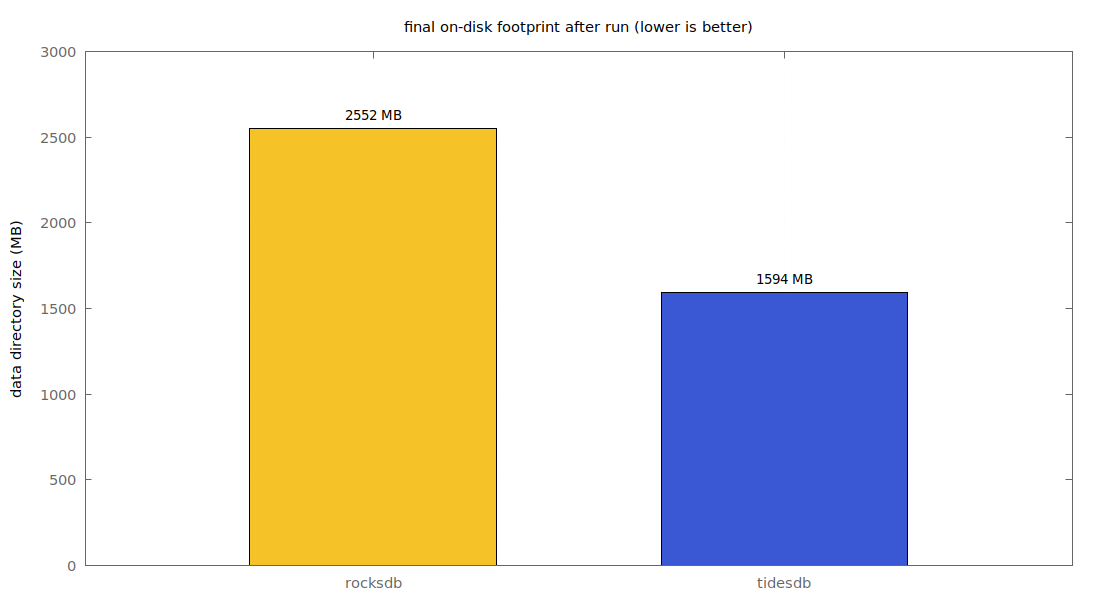
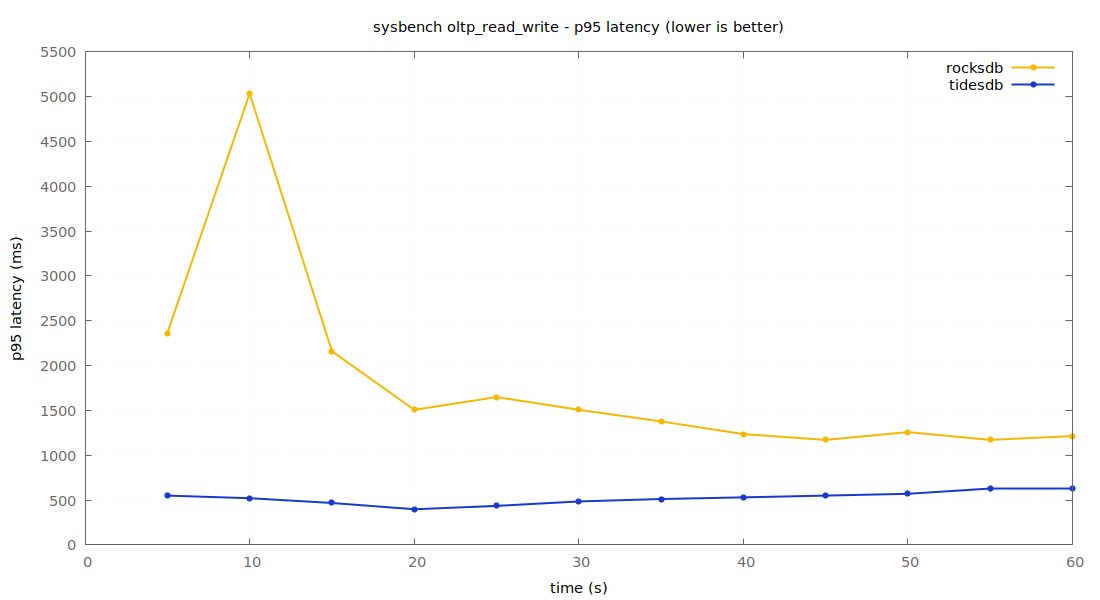
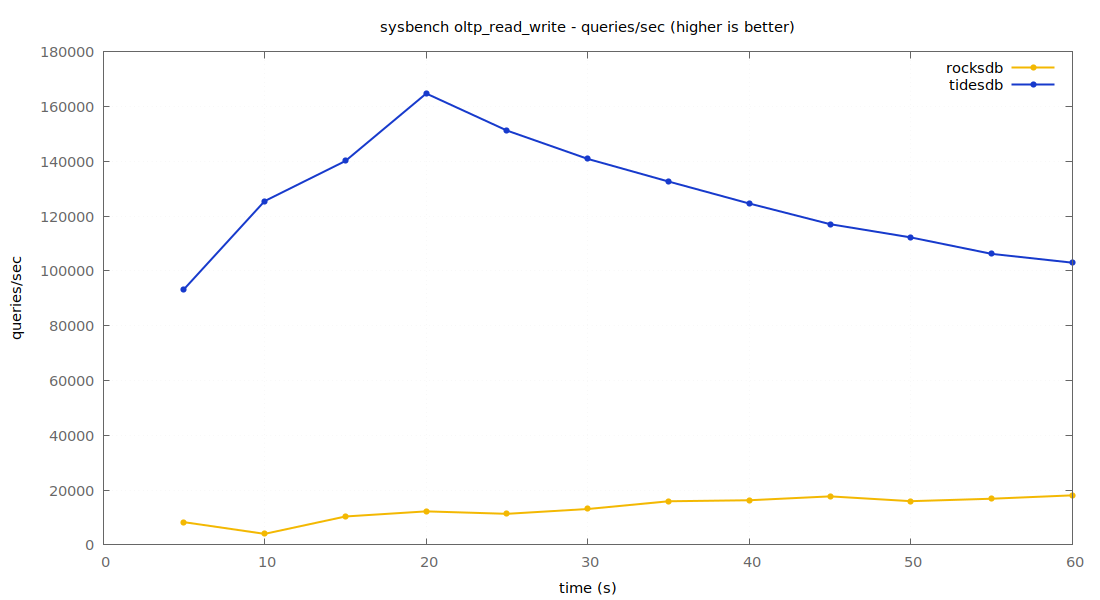
TidesDB pushes ~6.2k tps and 125k qps to RocksDB’s ~664 tps, prepares in 14s against 106s, and lands at 1.6 GB versus 2.6 GB. At this contention both engines lean on retries, RocksDB logged 333 ignored errors and TidesDB 2032, all retryable conflict and lock-wait codes that sysbench replays. p95 blows out on both, 520ms for TidesDB and 1.7s for RocksDB, this is well past what the box wants to serve.
Run 6
tidesdb_default_compression = NONE rocksdb_default_cf_options >> compression=kNoCompression (prepended)
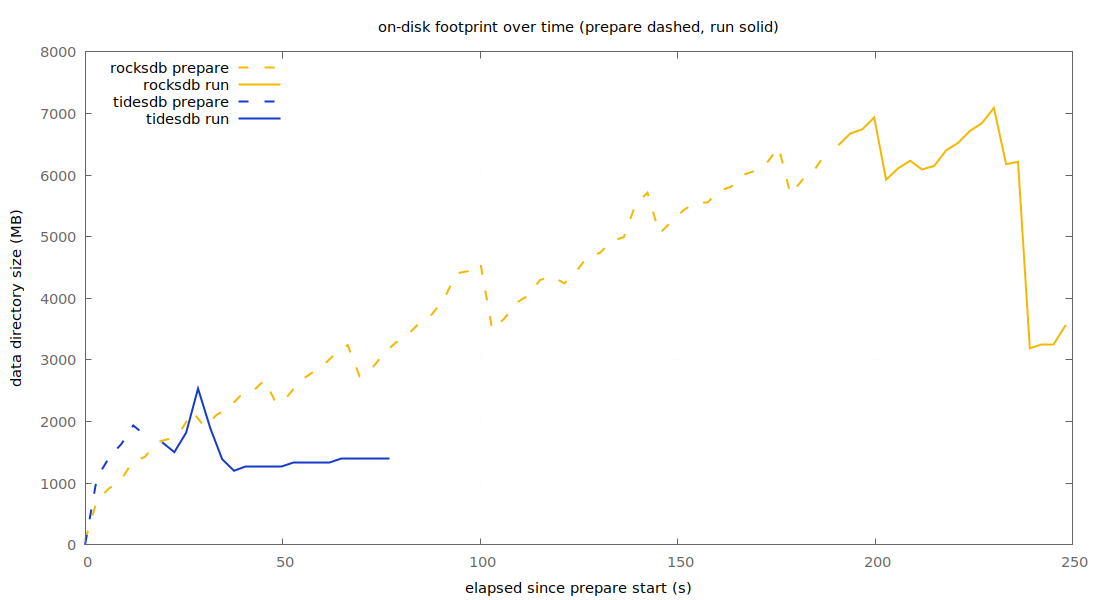
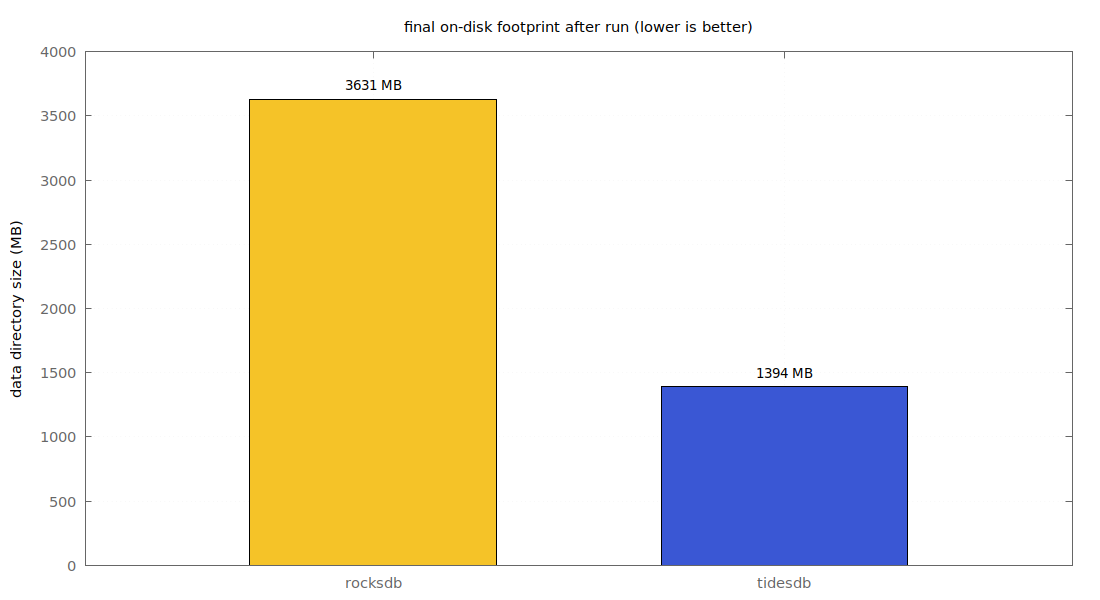
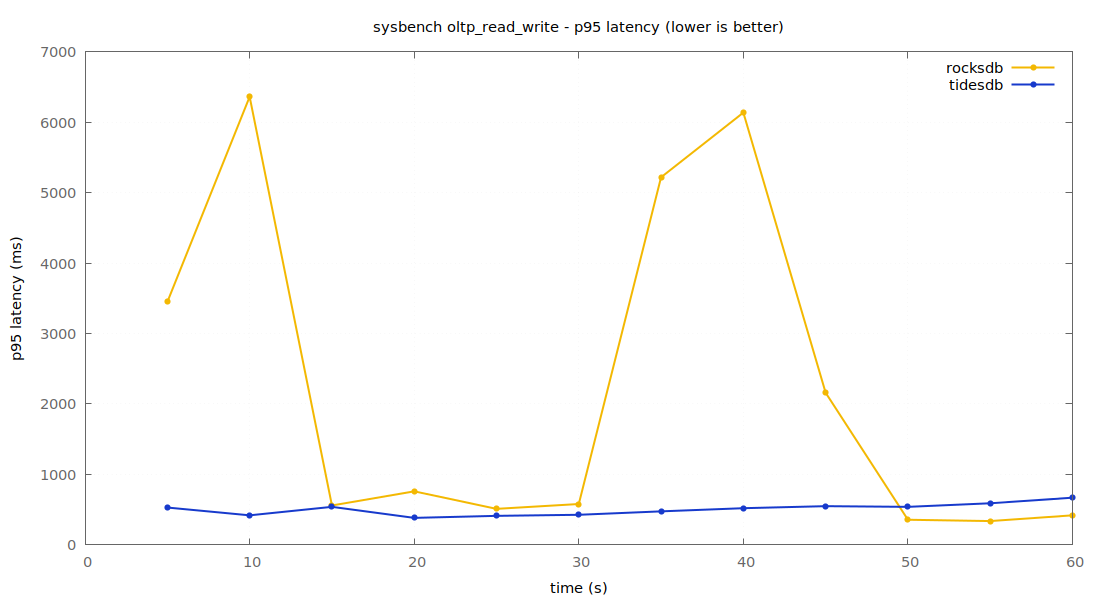
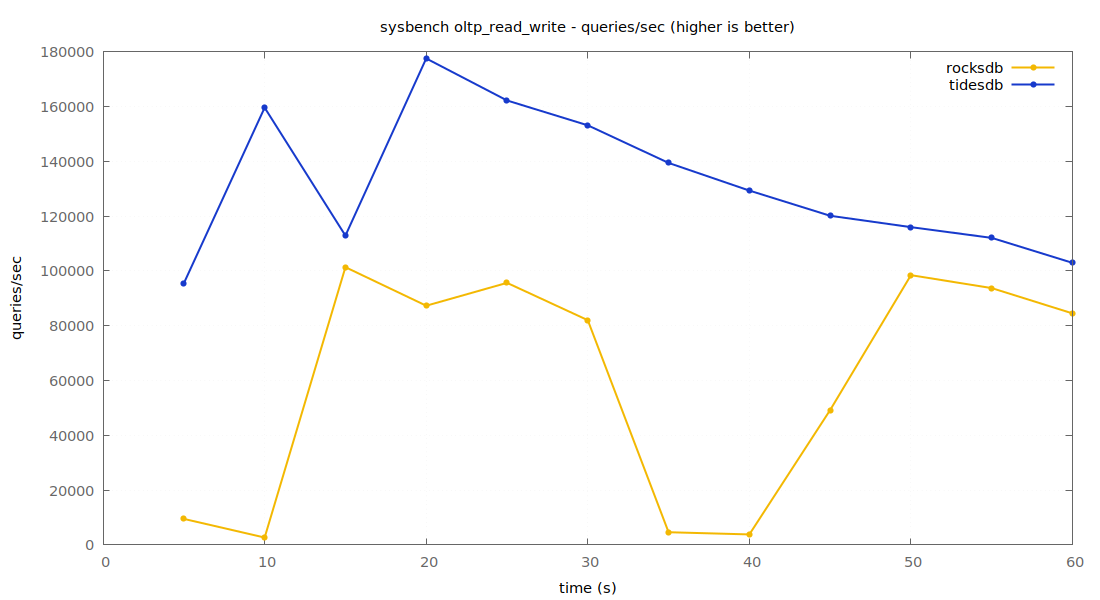
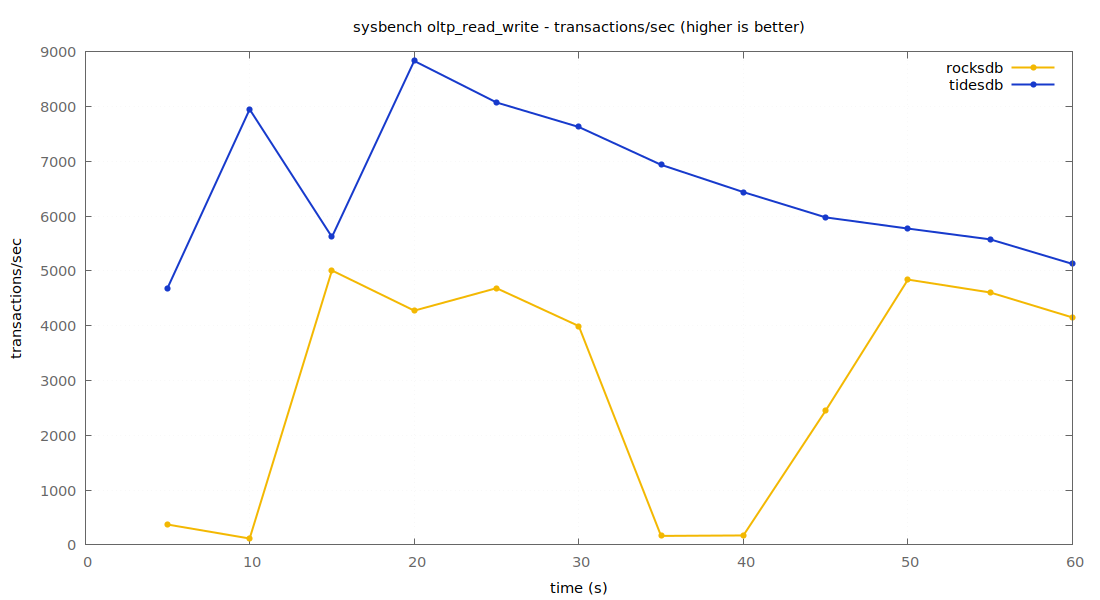
Run 5 again with compression off on both engines, to see what LZ4 was actually buying each one. The footprint story splits by engine. RocksDB compresses well, LZ4 took it from 3.6 GB down to 2.6 GB, roughly 30% off. TidesDB barely moved, 1.4 GB uncompressed against 1.6 GB with LZ4, so at a 60 second 512 thread churn the transient compaction state dominates and LZ4 is close to a wash on space here. Throughput is where it gets interesting. RocksDB jumped from ~664 tps with LZ4 to ~2.9k with it off, a 4.4x swing, so most of its run 5 deficit was LZ4 CPU cost and not the write path. TidesDB was nearly indifferent, ~6.2k to ~6.5k tps, compression is close to free for it. Even uncompressed, and even with RocksDB’s big jump, TidesDB still leads, about 2.25x the throughput and 2.6x smaller on disk.
—
Across all six runs TidesDB came out ahead on throughput and tail latency, and the gap widened as threads, rows and contention went up. On the 5m row runs it also prepared far faster and landed smaller on disk under the same LZ4. A quick look at the numbers, tps and p95 are TidesDB against RocksDB.
| run | workload | tps (tdb/rdb) | p95 ms (tdb/rdb) | prepare s (tdb/rdb) | final disk (tdb/rdb) |
|---|---|---|---|---|---|
| 1 | 8t / 1m / 60s | 3343 / 1948 | 3.55 / 10.84 | — | — |
| 2 | 24t / 2.5m / 300s | 2900 / 866 | 15.83 / 52.89 | — | — |
| 3 | 8t / 5m / 120s, LZ4, unified OFF | 2280 / 334 | 5.37 / 31.94 | 78 / 771 | 5.0 / 6.1 GB |
| 4 | 8t / 5m / 120s, LZ4, unified ON | 1756 / 307 | 5.47 / 34.33 | 126 / 731 | 4.6 / 6.1 GB |
| 5 | 512t / 1m / 60s, LZ4 | 6228 / 664 | 520.62 / 1708.63 | 14 / 106 | 1.6 / 2.6 GB |
| 6 | 512t / 1m / 60s, no compression | 6512 / 2893 | 493.24 / 877.61 | 13 / 189 | 1.4 / 3.6 GB |
Runs 1 through 4 were zero errors on both engines, runs 5 and 6 pushed the 512 thread contention into retries on both. These are single runs on a consumer SSD, so treat the small deltas (runs 3 and 4) as ballpark, the order of magnitude gaps are what hold. Run 6 is the honest footnote on compression, LZ4 costs RocksDB a lot of throughput at high concurrency while saving it real space, and costs TidesDB almost nothing either way.
Benchmark it yourself

if you are interested and willing of course!
Everything here is reproducible. Grab the script, point it at a MariaDB with both engines loaded, and run it. Between runs I wipe each engine’s data directory to assure valid calculation, clean state, and restart the server so nothing carries over.
Run 3 for example was just:
ENGINES="rocksdb tidesdb" TABLES=4 TABLE_SIZE=5000000 THREADS=8 TIME=120 \RAND_TYPE=zipfian RAND_ZIPFIAN_EXP=0.8 RAND_SEED=2024 \./rw-sysbench-rocksdb-tidesdb.shIt writes the CSVs and, if gnuplot is on your PATH, the plots you see above into a timestamped results/ directory. If gnuplot was missing at run time you can regenerate them after the fact from the CSVs:
./rw-sysbench-rocksdb-tidesdb.sh --plot-only results/<timestamp>That’s all for now!
—
All data: zip (40338a7256d9b8a75c882cca812d56a1e37ce6a4008b91f95e6b4340fbe11f61)