Keybench Analysis with TidesDB v9.3.6 and RocksDB v11.1.1

published on June 9th, 2026
In this article I’ll be going over the first public run with a new tool, so I will spend as much time on how the numbers were produced as on the numbers themselves. If you only read one section, read the caveats at the end before you quote anything here.
For these results I used keybench, a benchmark harness for sorted key value stores that I have been working on inspired by sysbench and HammerDB.
The idea is rather simple. You write the workload in Lua, the harness drives it across one or more storage engines, times every operation, and reports throughput and latency. The same script runs unchanged against every engine, so a comparison measures the engines and not the harness. A few design points matter for reading the rest of this article.
- The engine owns concurrency. keybench spawns the worker threads, splits the work across them, and joins them. It never holds a lock around an engine call, so a serialized engine reports as serialized and a parallel one reports as parallel. The Lua script is single threaded and never reasons about locks.
- Two rates are reported.
wu/sis workload units per second, one unit being one call to yourrun()function, a whole operation as the script defines it such as a cart checkout.ops/sis primitive operations per second, the raw key touches. When a unit is one primitive op the two are equal and one line is printed. When a unit is several, such as a batch of B keys,ops/sis B timeswu/sand both are printed. - Latency is a distribution, per operation kind. Each of put, get, del, range, mget, mput, mdel keeps its own histogram. The report gives p50, p99, p99.9, and the max. I care more about the tail than the median.
- The seed is measured, not hidden. Loading the dataset is its own timed phase with its own thread count, and it streams progress, so I can see ingest rate separately from the timed workload.
One more thing that shaped this run. A storage engine under write pressure will eventually push back, RocksDB by blocking the writer during a stall, TidesDB by returning a busy code that asks the caller to retry. keybench now treats both the same way, it waits and retries the busy code so a stall blocks the writer rather than dropping the write. That keeps the comparison honest, an engine cannot look fast by quietly failing writes, and it means long tails you will see below are real stalls that a client would feel.
Environment
- Intel Core i7-11700K, 8 cores and 16 threads, at 3.6GHz
- 46.8 GiB DDR4
- Ubuntu 23.03, Linux 6.2.0 x86_64
- WD Blue WDS500G2B0A, a consumer SATA SSD, ext4, 159 GiB volume
- gcc 12.3.0, linked against jemalloc so the whole malloc family agrees across both engines
- TidesDB v9.3.6, RocksDB v11.1.1, keybench 0.1.1
This is a modest consumer box on a SATA SSD, not a server with NVMe.
How the engines were run
Every workload was run against both engines across 1, 8, and 16 threads for 60 seconds per point, single run, with the median reported per point. The reason it is a single run rather than three is stated in the caveats.
The dataset was 500,000 keys with 4 KiB values, the cart workload sized by 90,000 users of line items instead. Each seed loaded that full dataset, half a million keys for mixed, scan, and batch and a comparable count of line items for cart, so the live data is roughly 2 GiB, about 16 times the combined 128 MiB of memtable and block cache each engine was given. The on disk footprint is larger than that and keeps growing through the run, because under seed once all three thread points write against the one store for 60 seconds each, and an uncompressed LSM holds obsolete versions and tombstones until compaction clears them. The point of the sizing was to push the data out of the memtable and into SSTables and compaction rather than let it sit in memory.
Both engines were configured for parity as far as their knobs allow, which is the important hedge.
| RocksDB v11.1.1 | TidesDB v9.3.6 | |
|---|---|---|
| compression | off (kNoCompression) | off (none) |
| write buffer | 64 MiB | 64 MiB |
| block cache | 64 MiB | 64 MiB |
| bloom filter | 10 bits | enabled, fpr 0.01 |
| compaction workers | max_background_jobs=8 | num_compaction_threads=4 |
| L0 pressure | trigger 4, slowdown 5, stop 10 | l0_queue_stall_threshold=10, l1_file_count_trigger=4 |
| durability | default WAL, no explicit sync | sync_mode=none |
These are matched in spirit, small memtable, no compression, a bloom filter on the read path, and an aggressive L0 setting so compaction has to keep up. They are not matched one to one, because the engines do not share knobs. Read the results as “these two configurations on this box”, not “the best each engine can do”.
The seed used keybench’s seed once mode, the store is seeded a single time per engine and the whole thread sweep runs against that one store rather than reseeding for every point. That models the realistic shape of load once, then serve, and it means a later, higher thread point runs against a store the earlier points already lived in, with whatever compaction debt that left. I think that is the right thing to measure, but it is a choice and it shows up in the tails.
Workloads
Four workloads, each a Lua file.
- mixed is the plain baseline, a uniform random mix over the whole keyspace, 50% get, 30% put, 10% del, 10% short range. No locality, so it is close to a worst case for the block cache, and the 10% deletes steadily build tombstones, which is its own kind of pressure on an LSM.
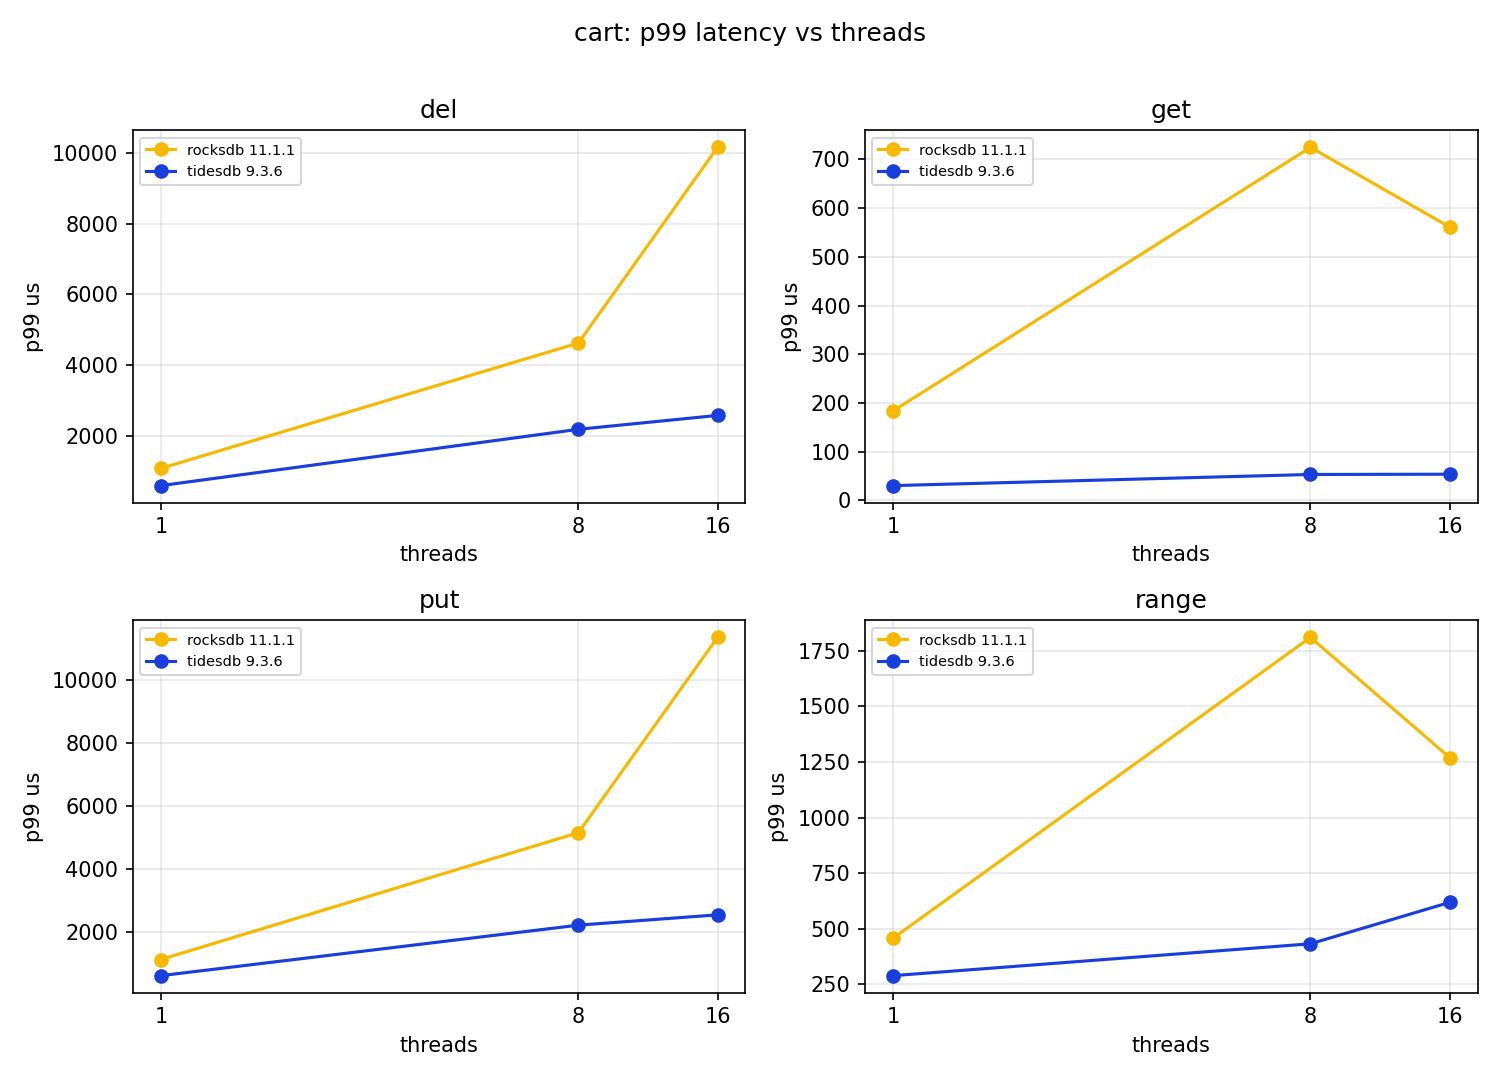
- cart models an Amazon style shopping cart, one key per line item under a per user prefix, so “view cart” is a range scan. The mix is 35% add, 25% view (range), 15% get, 10% update, 10% remove, 5% checkout (scan the cart, then delete every line). Users are skewed so a few are hot, which is far more realistic than uniform.
- scan is read only, a streaming scan of 1,000 rows per call through a callback that never materialises a result array. It isolates the range read path with no write interference at all, which makes it the cleanest comparison here.
- batch issues a 60/40 mix of multi get and multi put, and sweeps the batch size B over 1, 64, and 256 keys per call. It traces the amortisation curve, how per call cost spreads over more keys. Its dataset does not depend on B, so under seed once it is seeded once and shared across the sizes.
Throughput, the wide view
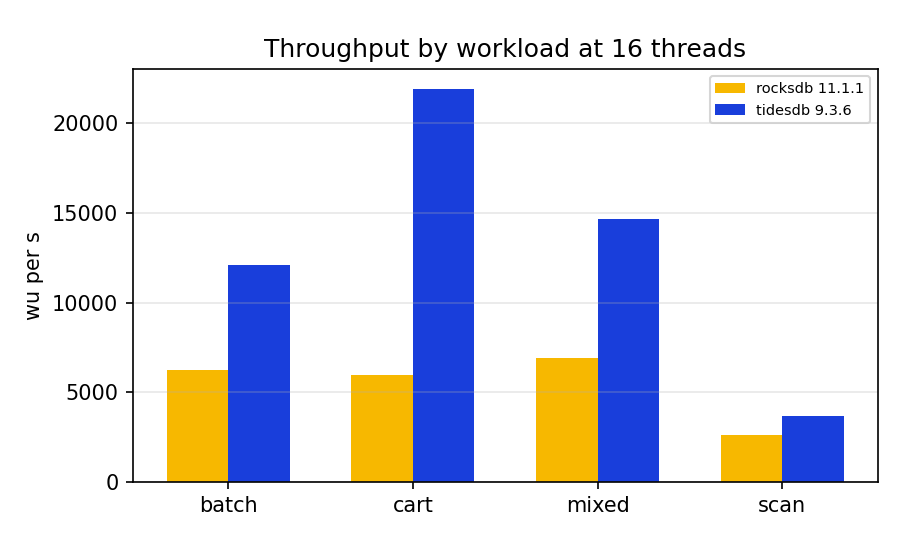
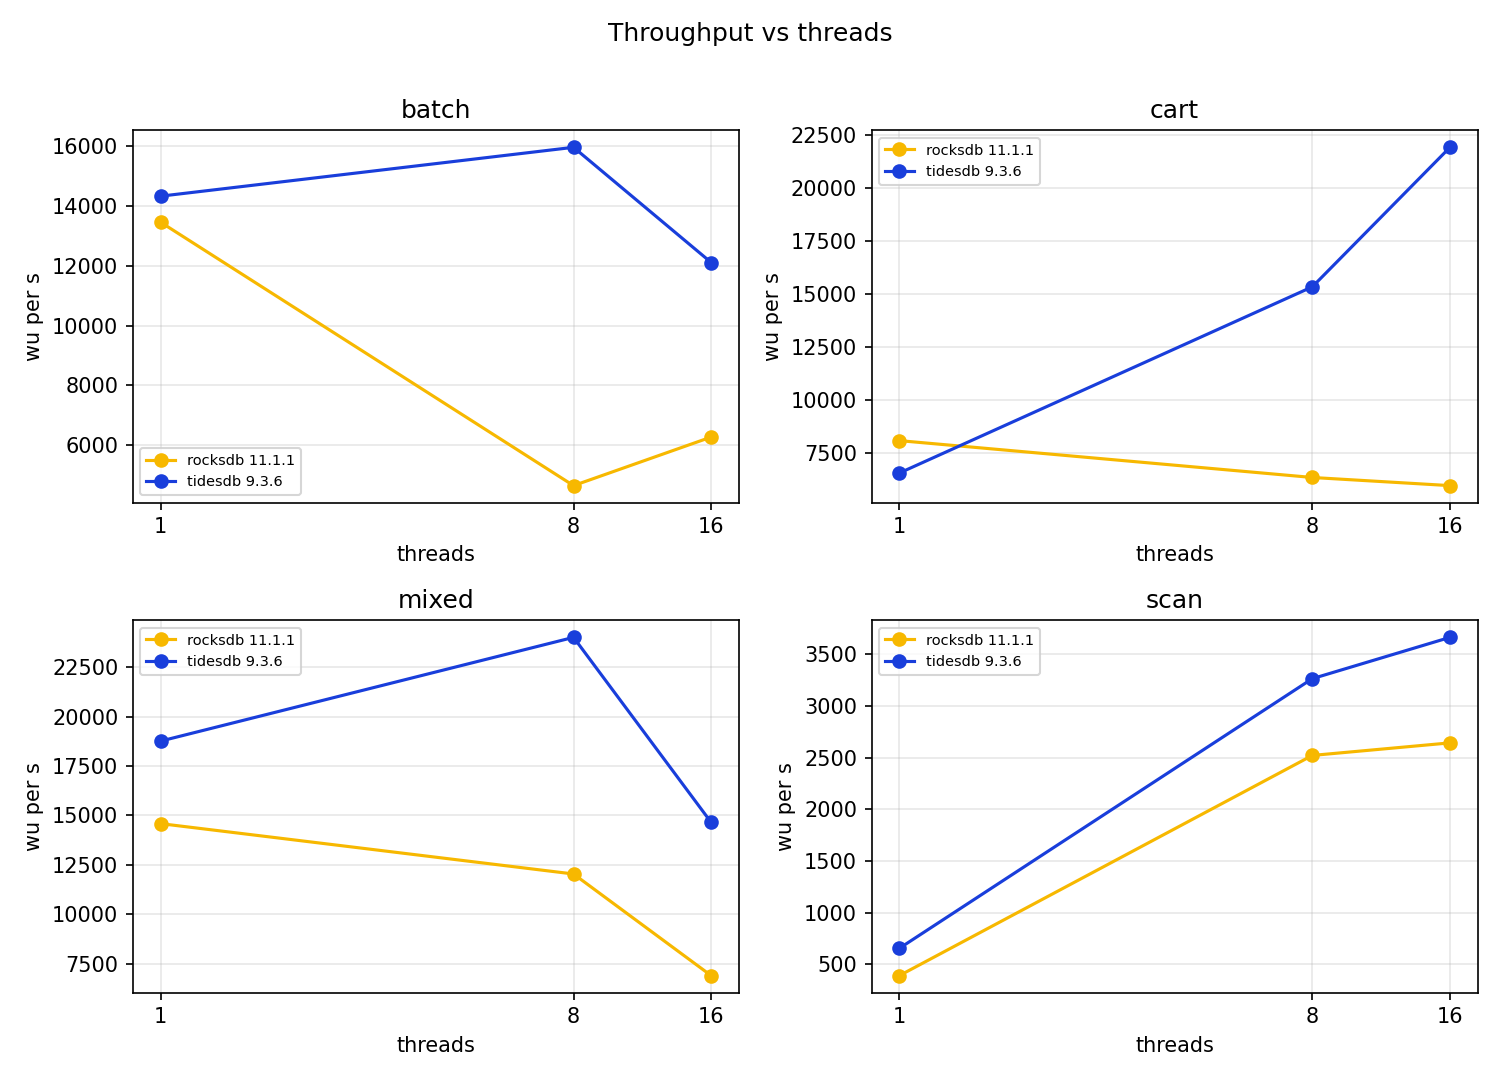
The most consistent pattern across the four workloads is not the absolute numbers, it is the shape of the scaling curve. TidesDB gains throughput from 1 to 8 threads on every workload, then from 8 to 16 it keeps gaining on cart and scan and eases back on mixed and batch. RocksDB, at this configuration, does not gain the same way, on the write heavy mixed and cart it is fastest at a single thread and slides down as threads are added, it scales up only on the read only scan, and on batch it is erratic. I will come back to the RocksDB write path, because I do not think it is the whole story, but it is what the data shows.
mixed
| threads | RocksDB wu/s | TidesDB wu/s |
|---|---|---|
| 1 | 14,587 | 18,761 |
| 8 | 12,038 | 24,010 |
| 16 | 6,893 | 14,644 |
At one thread TidesDB is about 29% ahead. At 8 threads it is roughly 2x. Both engines fall off from 8 to 16, which I expect on an 8 core box where the extra threads are hyperthreads and where the write path is contended, but RocksDB falls further, from 14.6k at 1 thread to 6.9k at 16.
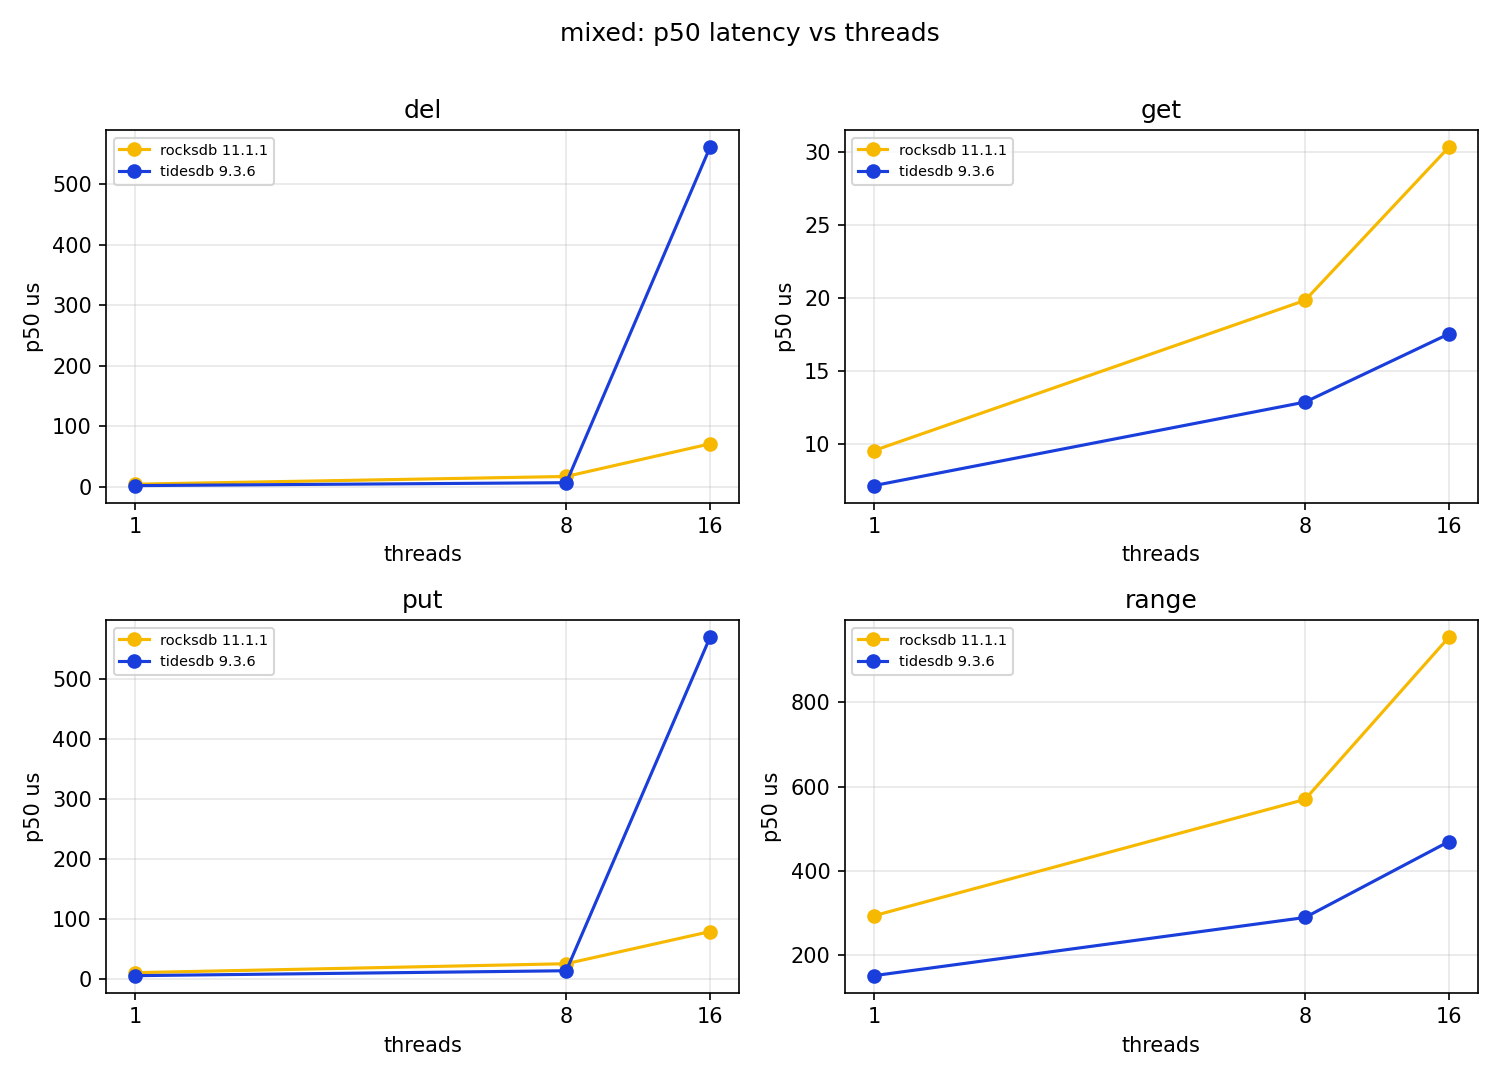
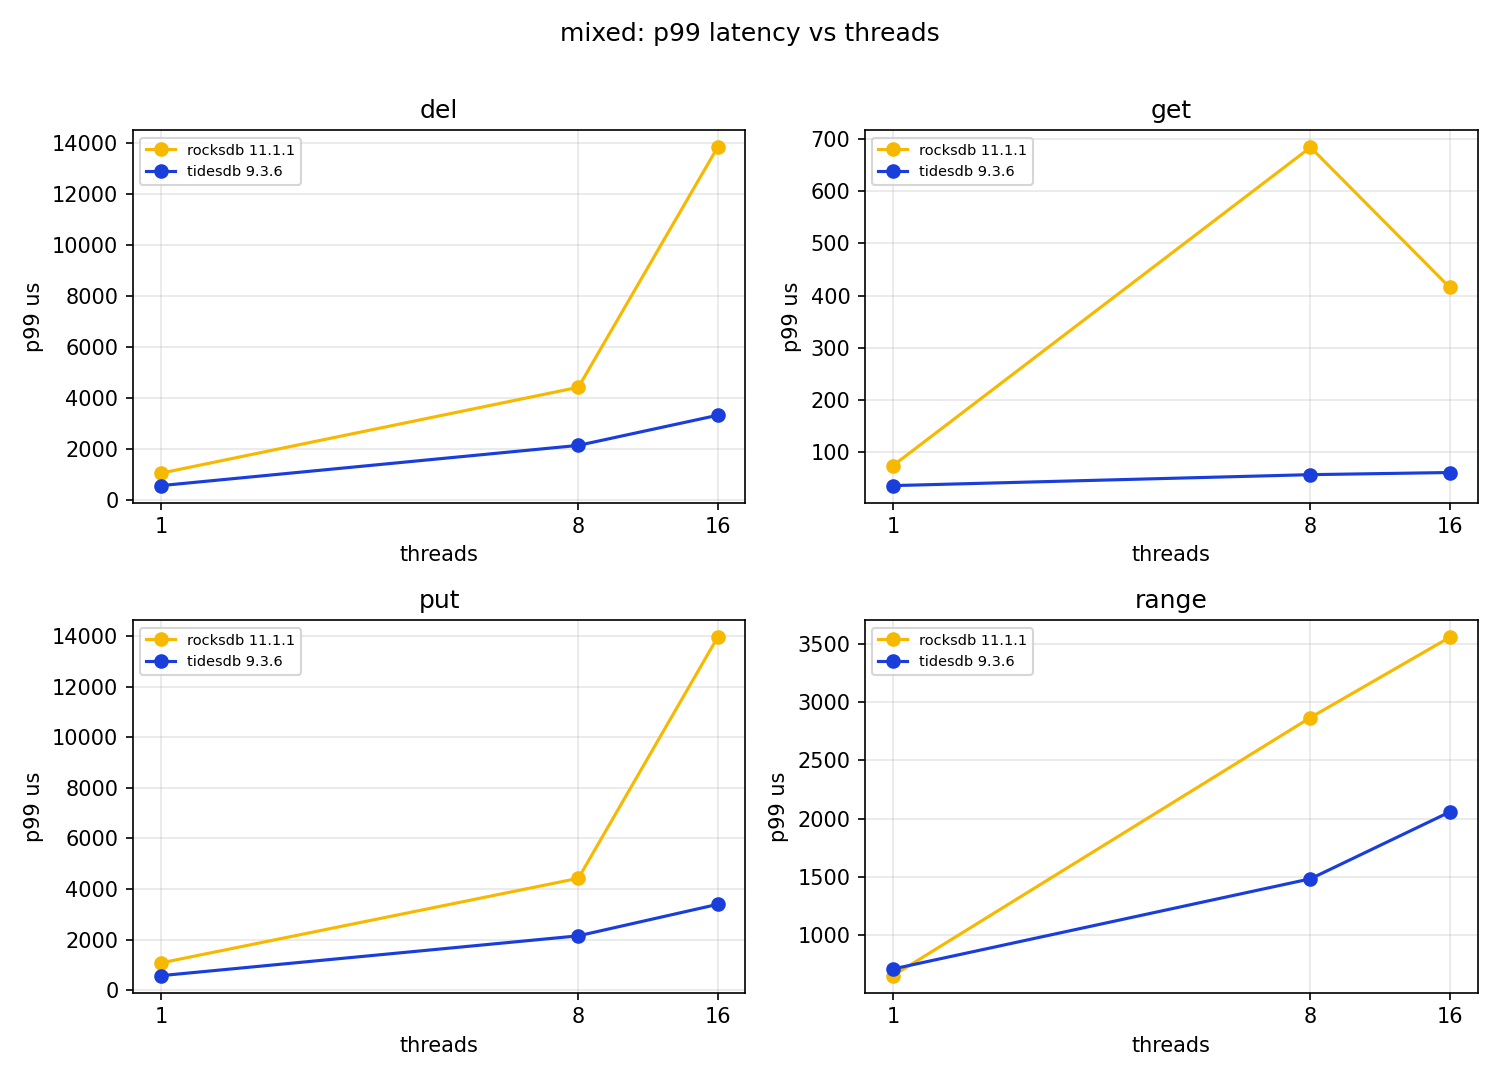
The median latencies favour TidesDB, its put p50 at one thread is 4.77us against 9.79us, its get p50 7.14us against 9.54us. The interesting wrinkle is at 16 threads, where TidesDB’s put p50 jumps to 569us while RocksDB’s is 78us, TidesDB is paying its concurrency cost in the write median there even as it wins on throughput. Both engines show ugly write tails, RocksDB’s put p99 at 16 threads is 13.96ms and TidesDB’s is 3.39ms, and both have multi second maxima, which are compaction stalls. The get hit rate falls from about 92% to about 80% as threads rise on both engines, which is the delete churn eating into the live keyspace, identical pressure for both.
cart
| threads | RocksDB wu/s | TidesDB wu/s |
|---|---|---|
| 1 | 8,073 | 6,540 |
| 8 | 6,332 | 15,336 |
| 16 | 5,947 | 21,926 |
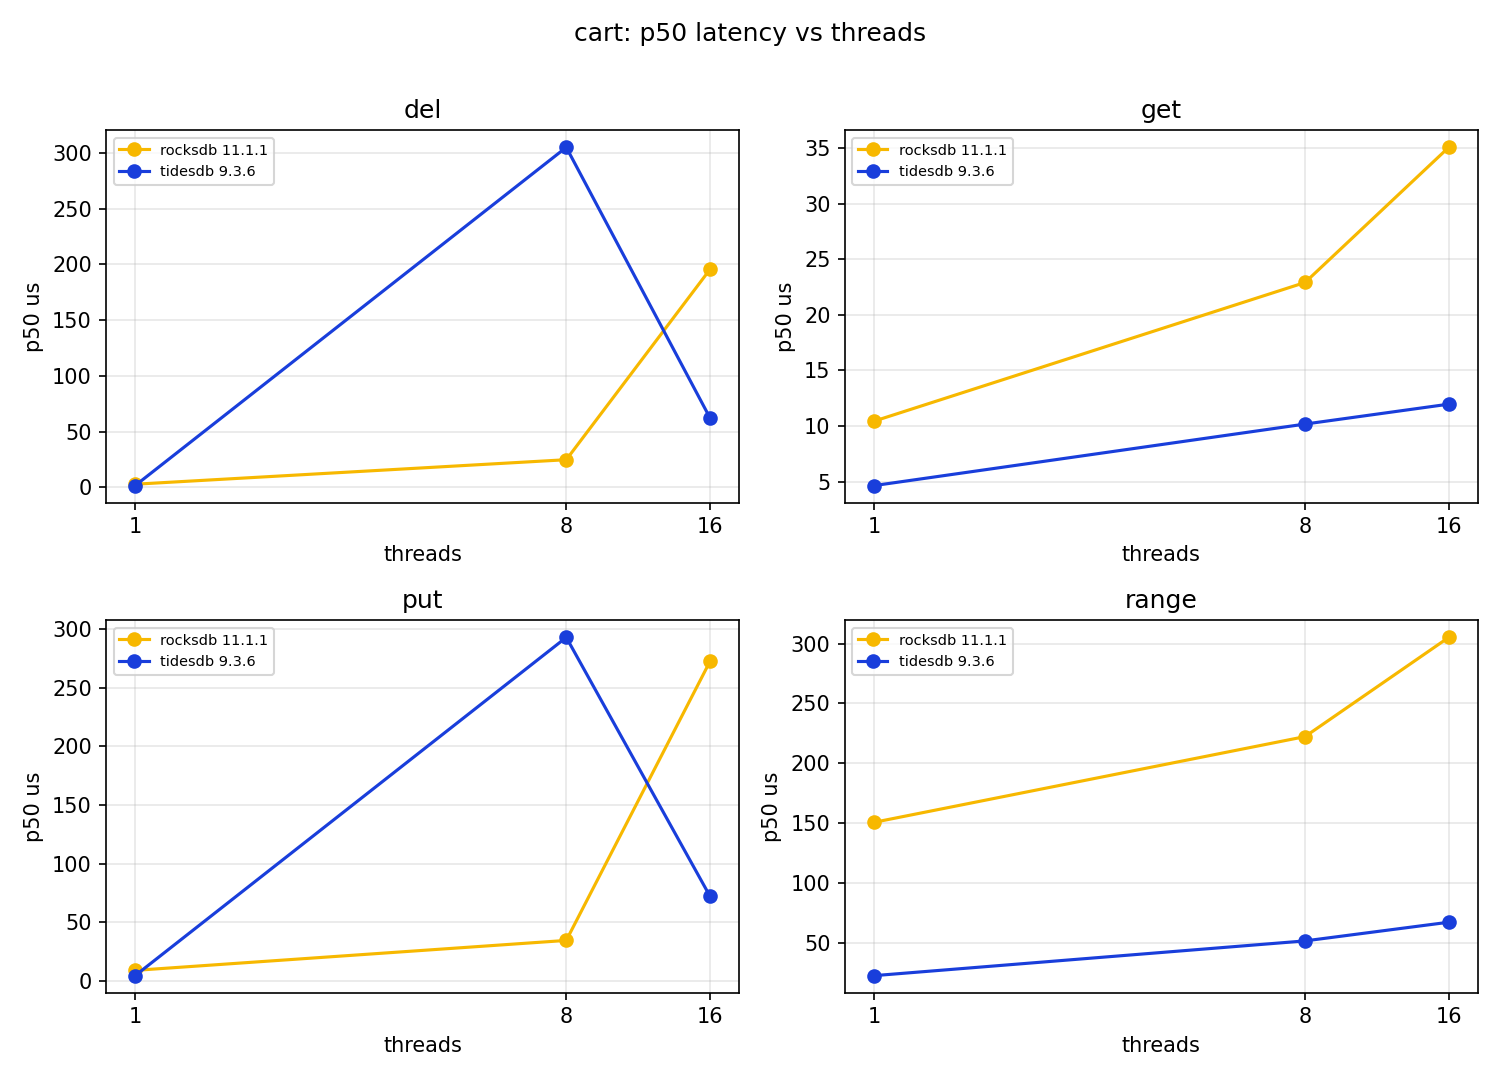
This is the one workload where RocksDB wins outright at a point, at one thread it is about 23% ahead, 8,073 against 6,540. That is worth stating plainly.
It is also the workload with the widest gap at scale, and the reason is the scaling shape again. RocksDB’s cart throughput goes the wrong way with concurrency, 8,073, then 6,332, then 5,947, a steady decline. TidesDB goes 6,540, then 15,336, then 21,926, a 3.4x gain that ends 3.7x ahead of RocksDB at 16 threads. The cart’s view and checkout are range reads over a hot user’s line items, and TidesDB’s range p50 is much lower here, 22us at one thread against 150us, which helps the read heavy part of the mix.
scan
| threads | RocksDB /s | TidesDB /s |
|---|---|---|
| 1 | 389 | 653 |
| 8 | 2,521 | 3,265 |
| 16 | 2,643 | 3,665 |
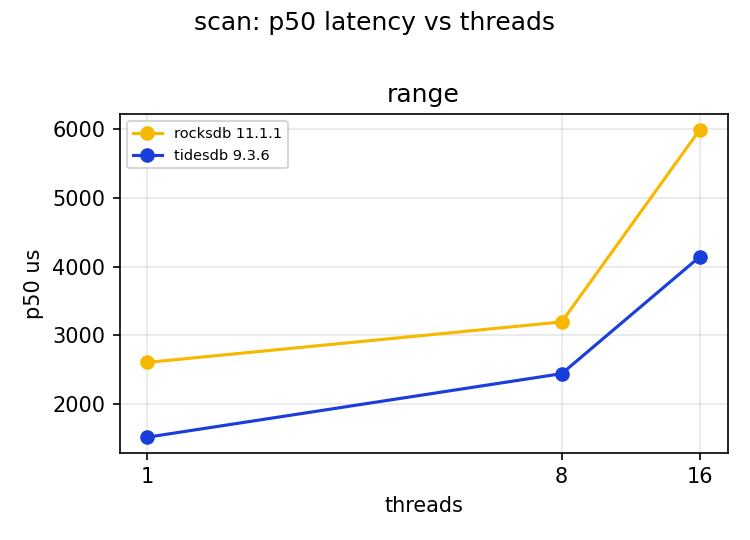
This is the cleanest comparison in the set, read only, no writes, no stalls, so it is purely the range read path. Each unit scans 1,000 consecutive rows of 4 KiB, so these rates are streaming a lot of data, 389/s at one thread on RocksDB is roughly 1.5 GiB/s of value bytes touched.
TidesDB is ahead throughout, by about 68% at one thread and around 30 to 40% at 8 and 16 threads. The p50 scan latency is 1.52ms against 2.61ms at one thread. Both scale cleanly to 8 threads and flatten by 16, which is what I expect when the work is read bound and the box has 8 physical cores. One thing to be clear about, the SSTable files sit in the OS page cache, so the SSD is mostly out of the picture, but the 64 MiB engine block cache is tiny against the ~2 GiB dataset, so these scans are not served from a warm engine cache, they run the full read path and only the device latency is absorbed. Read the scan numbers as a comparison of the range read path at a warm device, not a cold disk one.
batch
The batch workload is where the tails get genuinely violent for both engines, and where reading ops/s rather than wu/s matters, because at batch size 64 or 256 a single unit is touching 64 or 256 keys.
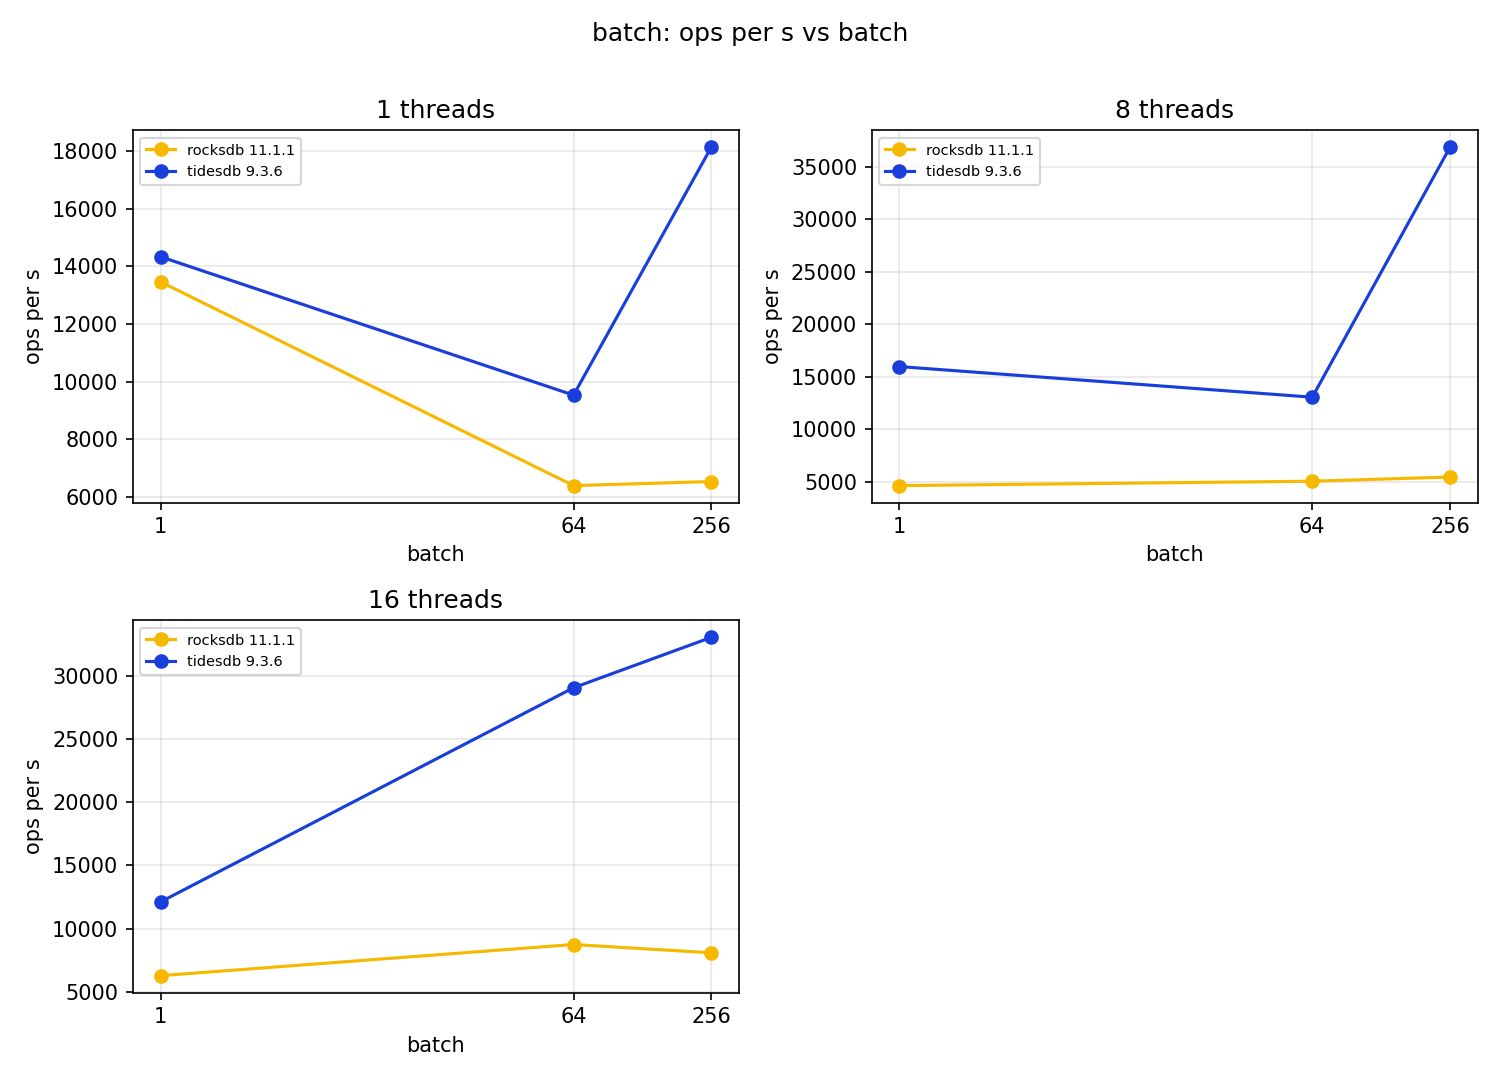
Primitive ops per second at batch size 256:
| threads | RocksDB ops/s | TidesDB ops/s |
|---|---|---|
| 1 | 6,540 | 18,129 |
| 8 | 5,460 | 36,827 |
| 16 | 8,081 | 33,069 |
TidesDB sustains far more batched key throughput, up to about 6.7x at 8 threads. But I want to be careful not to oversell that, because both engines have multi second write tails under batched writes. RocksDB’s mput p99 at batch 256 climbs into the 10 to 12 second range and TidesDB’s mput max reaches about 9.96 seconds. A 4 KiB by 256 key batch is a megabyte of writes in one commit, and on a 64 MiB memtable feeding a SATA SSD the flush and compaction simply cannot keep up, so the writer waits. TidesDB clears more total work, but neither engine is giving you a tight tail on million byte batched writes at this configuration. If your workload looks like this, smaller batches and a larger memtable are the obvious levers, and that is a tuning exercise this run did not do.
Why does RocksDB scale down here
I do not want to hand wave past RocksDB’s negative scaling, because it is the most likely thing to be a configuration artifact rather than an engine property.

The L0 stop trigger was set to 10 to mirror TidesDB’s L0 stall threshold of 10. Those two knobs share a number but not a meaning, and 10 is a low stop trigger for RocksDB, whose default is 36. With a 64 MiB memtable and 4 KiB values, L0 fills quickly, and under 8 to 16 concurrent writers RocksDB hits that stop trigger and blocks writers hard. The engine internals timeline shows it, the write stop signal and the pending compaction bytes track the throughput dips. A more generous L0 setting would very likely change RocksDB’s scaling story, and I would not be surprised to see it hold throughput better with default triggers. So the fair reading is, at a parity matched aggressive L0 configuration, TidesDB tolerated concurrency better on this box, not that RocksDB cannot scale. I would want to rerun with RocksDB’s own recommended L0 settings before saying anything stronger.
The seed
The ingest curves are a nice illustration of how differently the two engines absorb a bulk load. RocksDB rises as a smooth ramp, its delayed write throttle metering the ingest at a steady rate. TidesDB rises in steps, it buffers and then stalls flat while a flush drains, then jumps. Both finish loading the same dataset, the path there is just shaped by each engine’s flush and stall machinery. There is nothing to declare a winner on here, it is a behavioural picture, and it is the kind of thing the timeline view was built to show.
tl;dr
On this box, this configuration, and these four workloads, with single 60 second runs:
- TidesDB v9.3.6 led on throughput in most points, clearly so once past one thread, by roughly 2x on mixed at 8 threads, up to 3.7x on cart at 16 threads, about 30 to 40% on scans, and several fold on batched writes.
- RocksDB v11.1.1 won cart at one thread by about 23%, its only outright win in the run.
- RocksDB was fastest at a single thread on the write heavy mixed and cart and slid down as threads were added, while it scaled up on the read only scan. I believe the aggressive L0 stop trigger is a large part of the write side story, and would rerun with RocksDB’s default L0 settings before generalising.
- Both engines showed severe write tails under write heavy and batched workloads, multi second p99.9 and max, which are real compaction stalls a client would feel. High throughput did not buy a clean tail for either engine.
Caveat Emptor
I would not build a decision on this run alone, and here is why.
- Single run per point.
repeatwas 1, so there is no variance estimate. A 60 second LSM benchmark can swing point to point depending on where compaction happens to be. The medians here are medians of one. I will rerun with repeat 3 next time. - The device is hidden by the OS page cache, the engine caches are not. The ~2 GiB of SSTable files sits in the 46 GiB of RAM, so a block cache miss is satisfied from the page cache rather than the SSD, and these numbers do not test cold, I/O bound reads. What they do test is the engine read path, because each engine was given only a 64 MiB block cache and a 64 MiB write buffer against that ~2 GiB dataset, far too small to serve reads from its own cache. So every get and scan still runs the full path, bloom filter, index, and SSTable block fetch, the page cache only removes the disk seek. Read these as read path efficiency at a warm device, not as device bound reads.
- Short runs, lived in store. 60 seconds per point under seed once means each point inherits the previous one’s compaction debt and never reaches a long term steady state. That is realistic for serve after load, but it is not a soak test.
- The configuration is parity matched, not engine optimal. Neither engine was tuned to its best. The L0 settings in particular are aggressive and matched by number rather than by meaning, and they clearly shaped RocksDB’s scaling.
- Modest single box. One consumer SATA SSD, eight physical cores. NVMe and more cores would change the balance, probably in favour of whichever engine is better at using parallel I/O.
- We maintain TidesDB. Reproduce it yourself, the tool and the config are public.
The config that produced this run ships in the keybench repository at samples/rocksdb-vs-tidesdb.cnf, and every number above is in the run’s report.txt and points.tsv. If you find something I got wrong, do let me know via email.
That’s all for now!
Thank you for reading.
—
Gist: https://gist.github.com/guycipher/04a7eaf65b332f662c8a8f968c0a3528
Raw data: keybench-tidesdb-v9-3-6-rocksdb-v11-1-1/20260609-100854.zip (sha256: b1d9afc26a9940a850f05f47a91d2b7c4237e70f6e06fe8c84064b53dfa238d7)