HammerDB TPC-C Analysis on TidesDB v9.3.3/TideSQL v4.5.4 and InnoDB in MariaDB v11.8.6

published on June 3rd, 2026
This is a short article on the results of running the latest releases of TidesDB v9.3.3 and TideSQL v4.5.4 against InnoDB in MariaDB v11.8.6. Both TidesDB and TideSQL will now ship as part of MariaDB releases, as you can see in this PR #5166. This is exciting news for me, for the company, and, we believe, for the community.
For this analysis I used my consumer desktop with the following specs:
Intel Core i7-11700K (8 cores, 16 threads) @ 4.9GHz48GB DDR4WD Blue 3D NAND 500GB SATA SSDUbuntu 23.04 x86_64 6.2.0-39-genericI compiled with GCC and used jemalloc as my allocator.
I used HammerDB v5.0.0, though I know v6.0.0 is available for testing, I just haven’t updated my OS yet! I will soon, though.
I used my own HammerDB scripts, which you can find here:
./mariadb_engines_runner.sh \ --engines tidesdb,innodb \ --iterations 1 \ --warehouses 100 \ --build-vu 8 \ --run-vu 8 \ --rampup 5 \ --duration 15 \ --settle 90 \ --no-perf \ --no-restart \ --no-drop-cache \ --harness ~/hammer/hammerdb_runner.sh \ --hammerdb-dir ~/HammerDB-5.0 \ --user hammerdb \ --pass hammerdb123 \ --socket /tmp/mariadb.sock \ --mariadb-bin /media/agpmastersystem/c794105c-0cd9-4be9-8369-ee6d6e707d68/home/bench/mariadb/bin/mariadbWhat I’m doing here is orchestrating a run across two engines, TidesDB, of course, and InnoDB, with a decently sized workload that exercises each engine’s buffers/caches and disk I/O. It comes out to about 15GB of data after ingestion.
My my.cnf looks like this:
[mysqld]basedir = /media/agpmastersystem/c794105c-0cd9-4be9-8369-ee6d6e707d68/home/bench/mariadbdatadir = /media/agpmastersystem/c794105c-0cd9-4be9-8369-ee6d6e707d68/home/bench/mariadb/dataport    = 3306socket  = /tmp/mariadb.sockuser    = agpmastersystempid-file = /media/agpmastersystem/c794105c-0cd9-4be9-8369-ee6d6e707d68/home/bench/mariadb/data/mariadb.pidlog-error = /media/agpmastersystem/c794105c-0cd9-4be9-8369-ee6d6e707d68/home/bench/mariadb/data/mariadb.err
bind-address      = 127.0.0.1max_connections   = 1024thread_cache_size = 32table_open_cache  = 2048open_files_limit  = 65536
skip-log-bin
default_storage_engine     = InnoDBdefault_tmp_storage_engine = MyISAMtransaction_isolation      = READ-COMMITTEDcharacter-set-server = utf8mb4collation-server     = utf8mb4_general_ci
slow_query_log      = ONslow_query_log_file = /media/agpmastersystem/c794105c-0cd9-4be9-8369-ee6d6e707d68/home/bench/mariadb/data/slow.loglong_query_time     = 2

innodb_buffer_pool_size        = 2Ginnodb_buffer_pool_instances   = 1
innodb_log_file_size           = 128Minnodb_log_files_in_group      = 2innodb_log_buffer_size         = 68M
innodb_flush_log_at_trx_commit = 0innodb_doublewrite             = OFFinnodb_flush_method            = O_DIRECT_NO_FSYNCinnodb_file_per_table          = ONinnodb_read_io_threads         = 2innodb_write_io_threads        = 2innodb_purge_threads           = 2innodb_thread_concurrency      = 0innodb_io_capacity             = 1000innodb_io_capacity_max         = 4000innodb_use_native_aio          = 1innodb_adaptive_flushing       = 1tmp_table_size                 = 32Mmax_heap_table_size            = 32M
plugin_maturity = gammaplugin_load_add = ha_tidesdb.so
tidesdb_block_cache_size                       = 2G
tidesdb_unified_memtable                       = ONtidesdb_unified_memtable_write_buffer_size     = 128M
tidesdb_unified_memtable_sync_mode             = NONEtidesdb_default_sync_mode                      = NONEtidesdb_default_compression                    = NONE
tidesdb_flush_threads                          = 6tidesdb_compaction_threads                     = 4
tidesdb_max_open_sstables                      = 1024
tidesdb_skip_unique_check = ONtidesdb_default_bloom_fpr = 100
tidesdb_log_level                              = NONEtidesdb_default_l0_queue_stall_threshold       = 20tidesdb_default_l1_file_count_trigger          = 10tidesdb_default_tombstone_density_trigger      = 5000tidesdb_default_tombstone_density_min_entries  = 2048
tidesdb_max_memory_usage = 0
[client]port                  = 3306socket                = /tmp/mariadb.sockdefault-character-set = utf8mb4
[mysqldump]quickmax_allowed_packet = 64M
[mariadb-backup]
[mysqld_safe]malloc-lib=/lib/x86_64-linux-gnu/libjemalloc.so.2
Both engines are configured identically with regard to resource usage, same 2G of cache/buffer, same thread budgets, same flush behavior. Now let’s look at how the two of them ran.
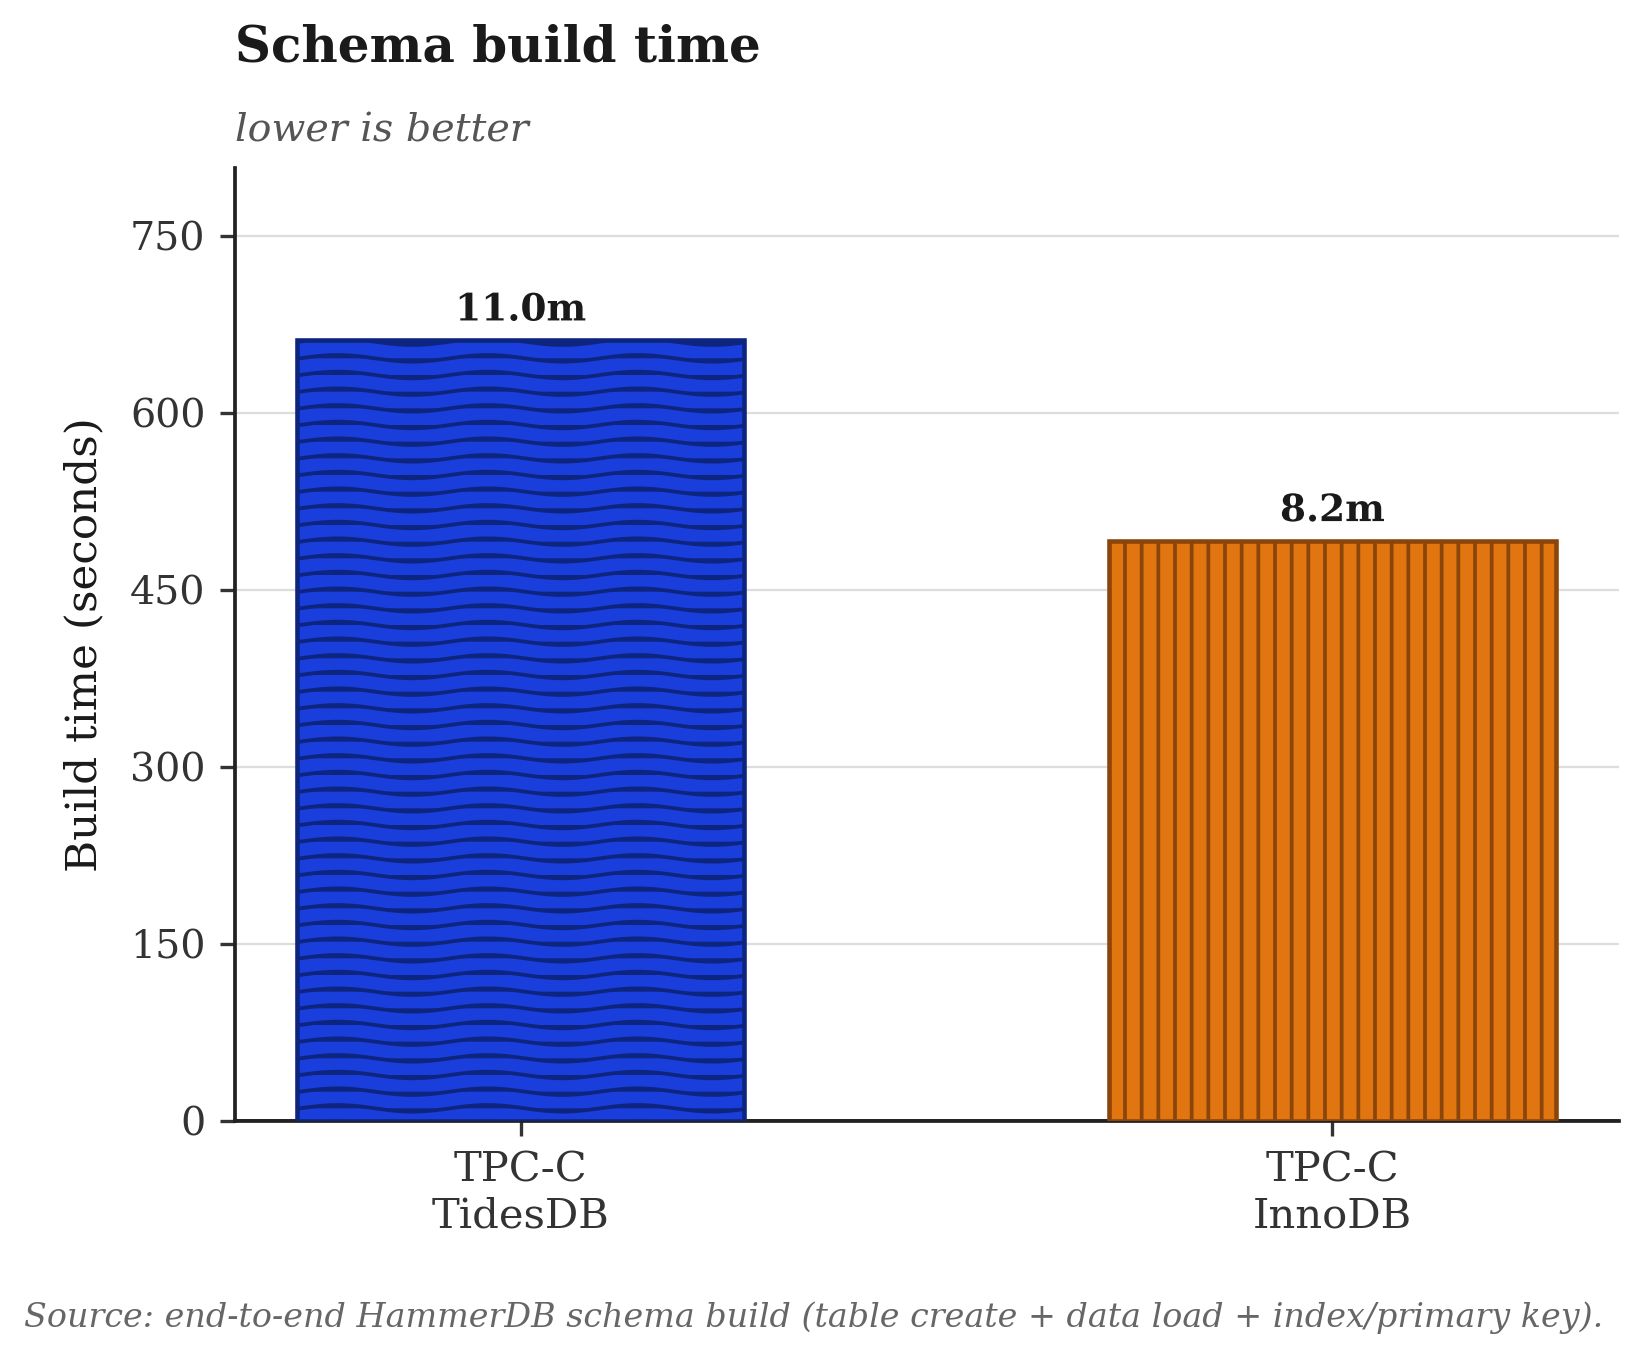
Schema build time
First up is TidesDB. On ingestion it hit its graduated back-pressure a few times during load, and in this configuration and environment it showed a slower schema build time than InnoDB by about 3 minutes (662s vs 492s). This is expected, TidesDB is an LSM engine, so the load phase is where it is busiest absorbing writes into memtables, flushing them out, and kicking off early compaction. It’s also the one phase where InnoDB’s in-place B-tree updates have the advantage, since there’s no flush/compaction machinery to feed.
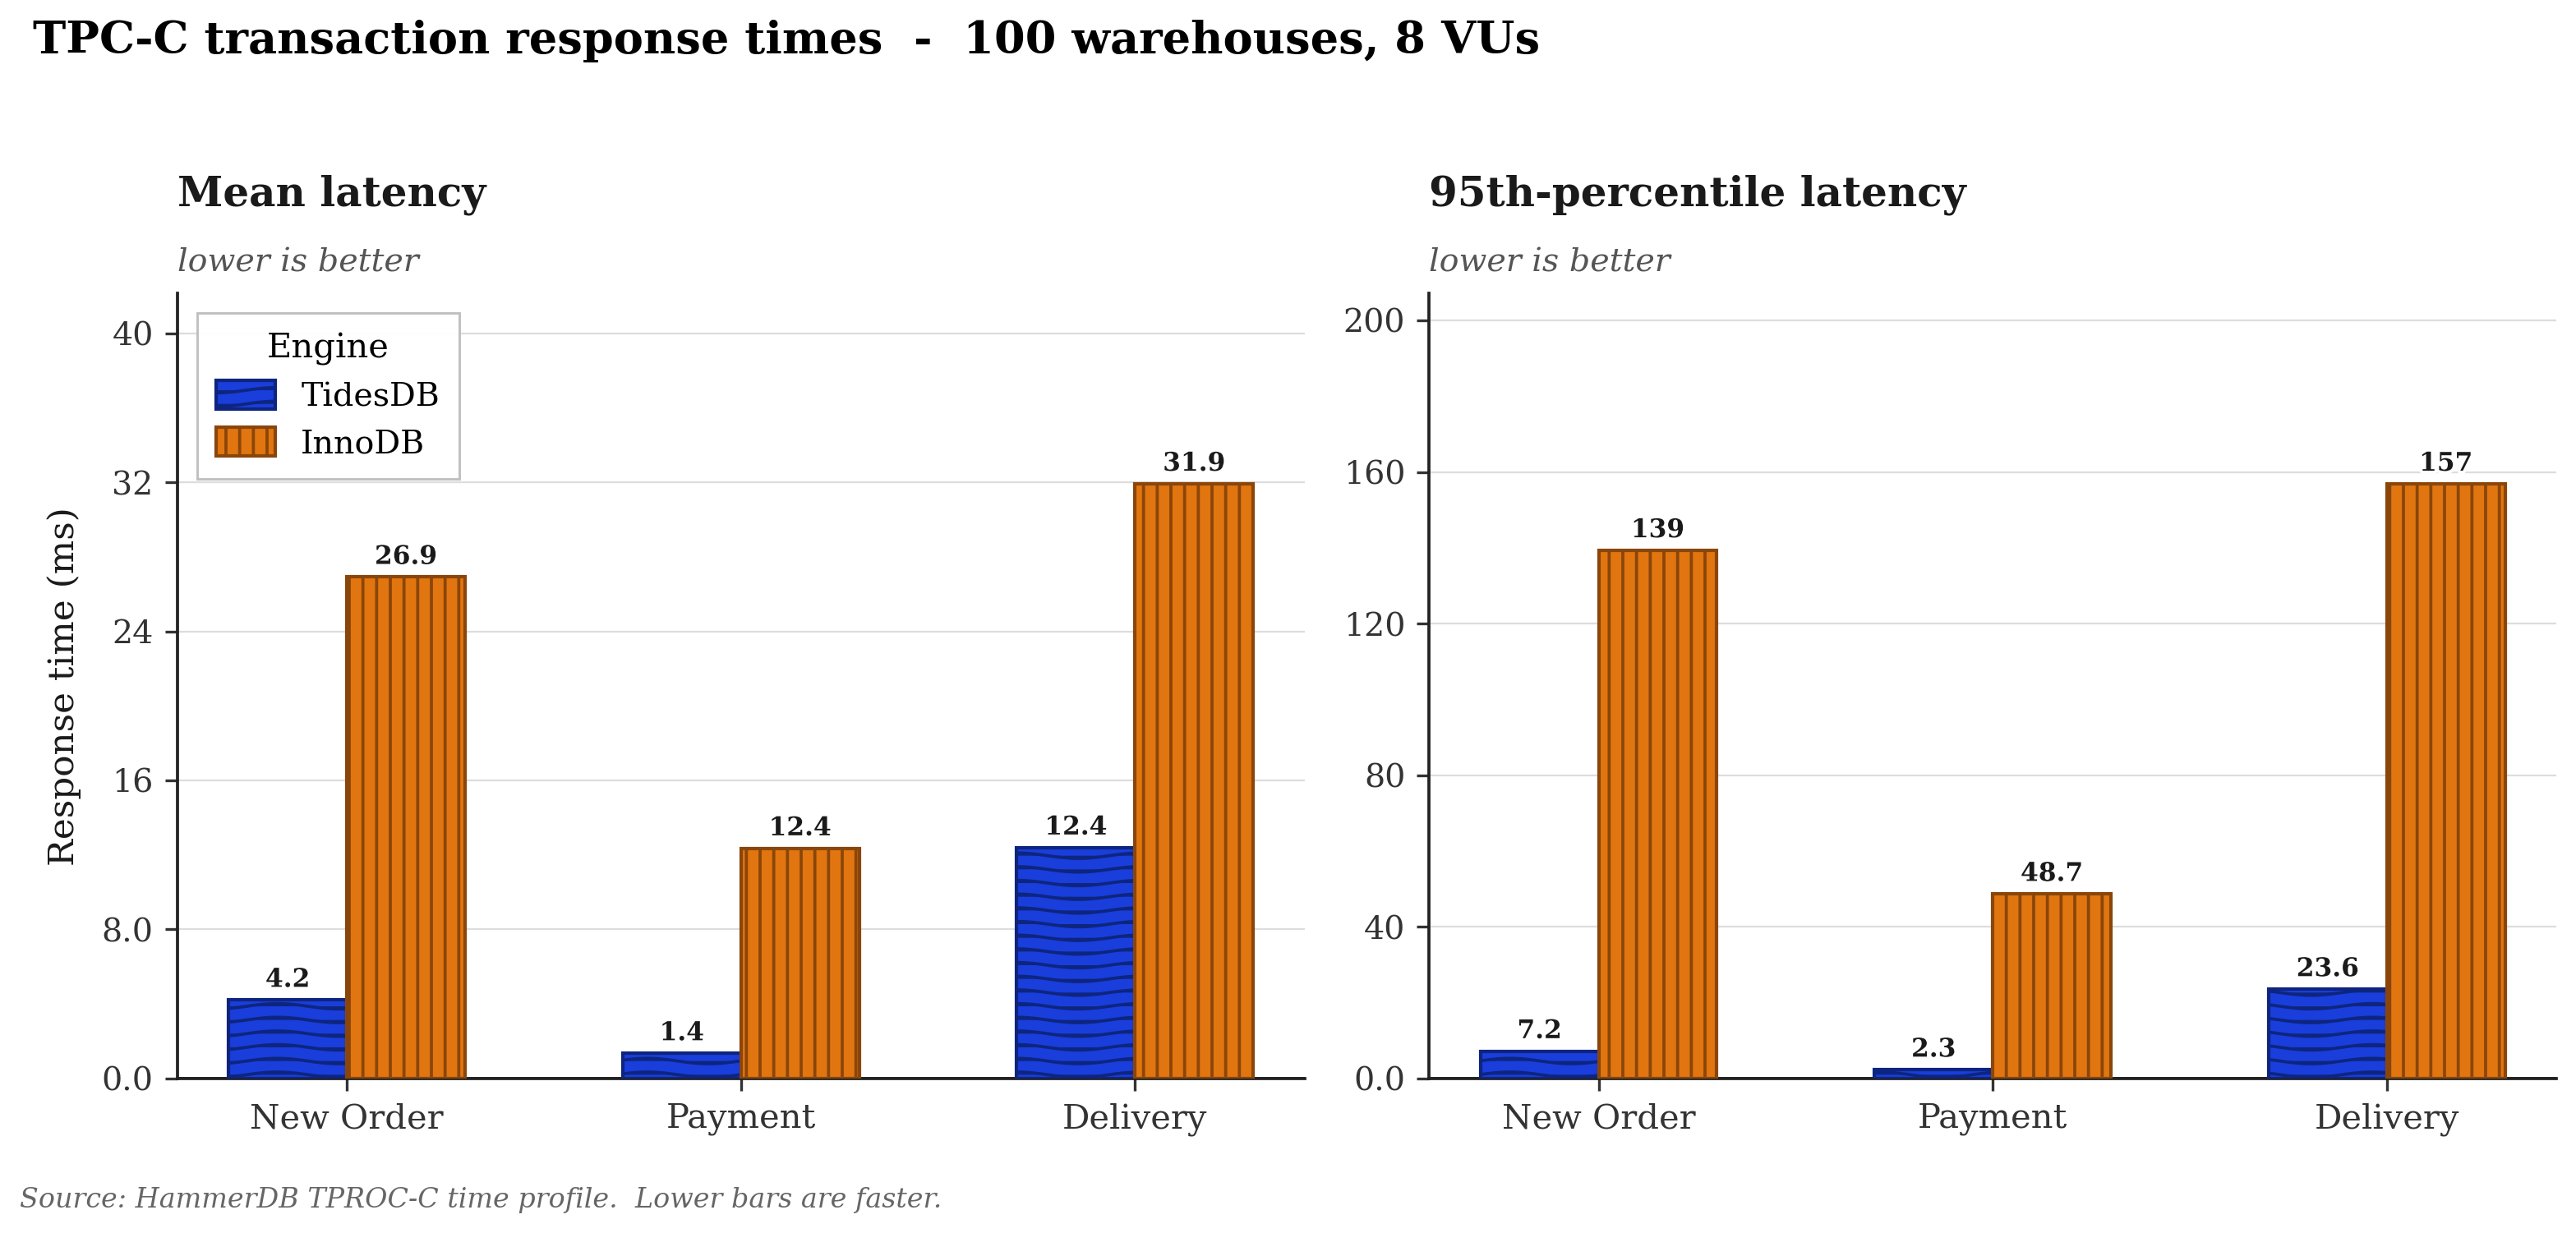
Latency
When it comes to latency, TidesDB was vastly more efficient in its response times and the gap really opens up in the tail, which is the part that actually hurts under load.
Take New Order, the transaction that dominates the TPC-C mix. TidesDB averaged 4.224ms against InnoDB’s 26.927ms, so roughly 6x lower on average. But look at the percentiles TidesDB’s p95 was 7.212ms and its p99 was 10.989ms, while InnoDB sat at 139.367ms p95 and 314.421ms p99. That’s about a 19x gap at p95 and nearly 29x at p99. In other words, InnoDB’s slow requests were much slower, not just slightly.
The same pattern holds across the rest of the mix:
| Transaction | TidesDB avg / p95 / p99 (ms) | InnoDB avg / p95 / p99 (ms) |
|---|---|---|
| New Order | 4.224 / 7.212 / 10.989 | 26.927 / 139.367 / 314.421 |
| Payment | 1.357 / 2.338 / 3.474 | 12.359 / 48.711 / 220.357 |
| Delivery | 12.403 / 23.578 / 33.699 | 31.933 / 156.937 / 328.798 |
| Order Status | 1.951 / 3.718 / 5.057 | 26.899 / 148.570 / 350.191 |
| Stock Level | 2.064 / 3.974 / 8.485 | 3.659 / 4.298 / 77.501 |
Payment is where it gets almost silly, TidesDB held p99 at 3.474ms while InnoDB’s p99 blew out to 220.357ms, over 60x higher. Stock Level is the one place the two engines look close on average (2.064ms vs 3.659ms), but even there InnoDB’s p99 jumps to 77.501ms versus TidesDB’s 8.485ms, so the tail tells the same story. The headline takeaway for me is, really, consistency, TidesDB kept its p99s in the single-digit-to-low-tens of milliseconds across the board, while InnoDB’s tail latency lived in the hundreds.
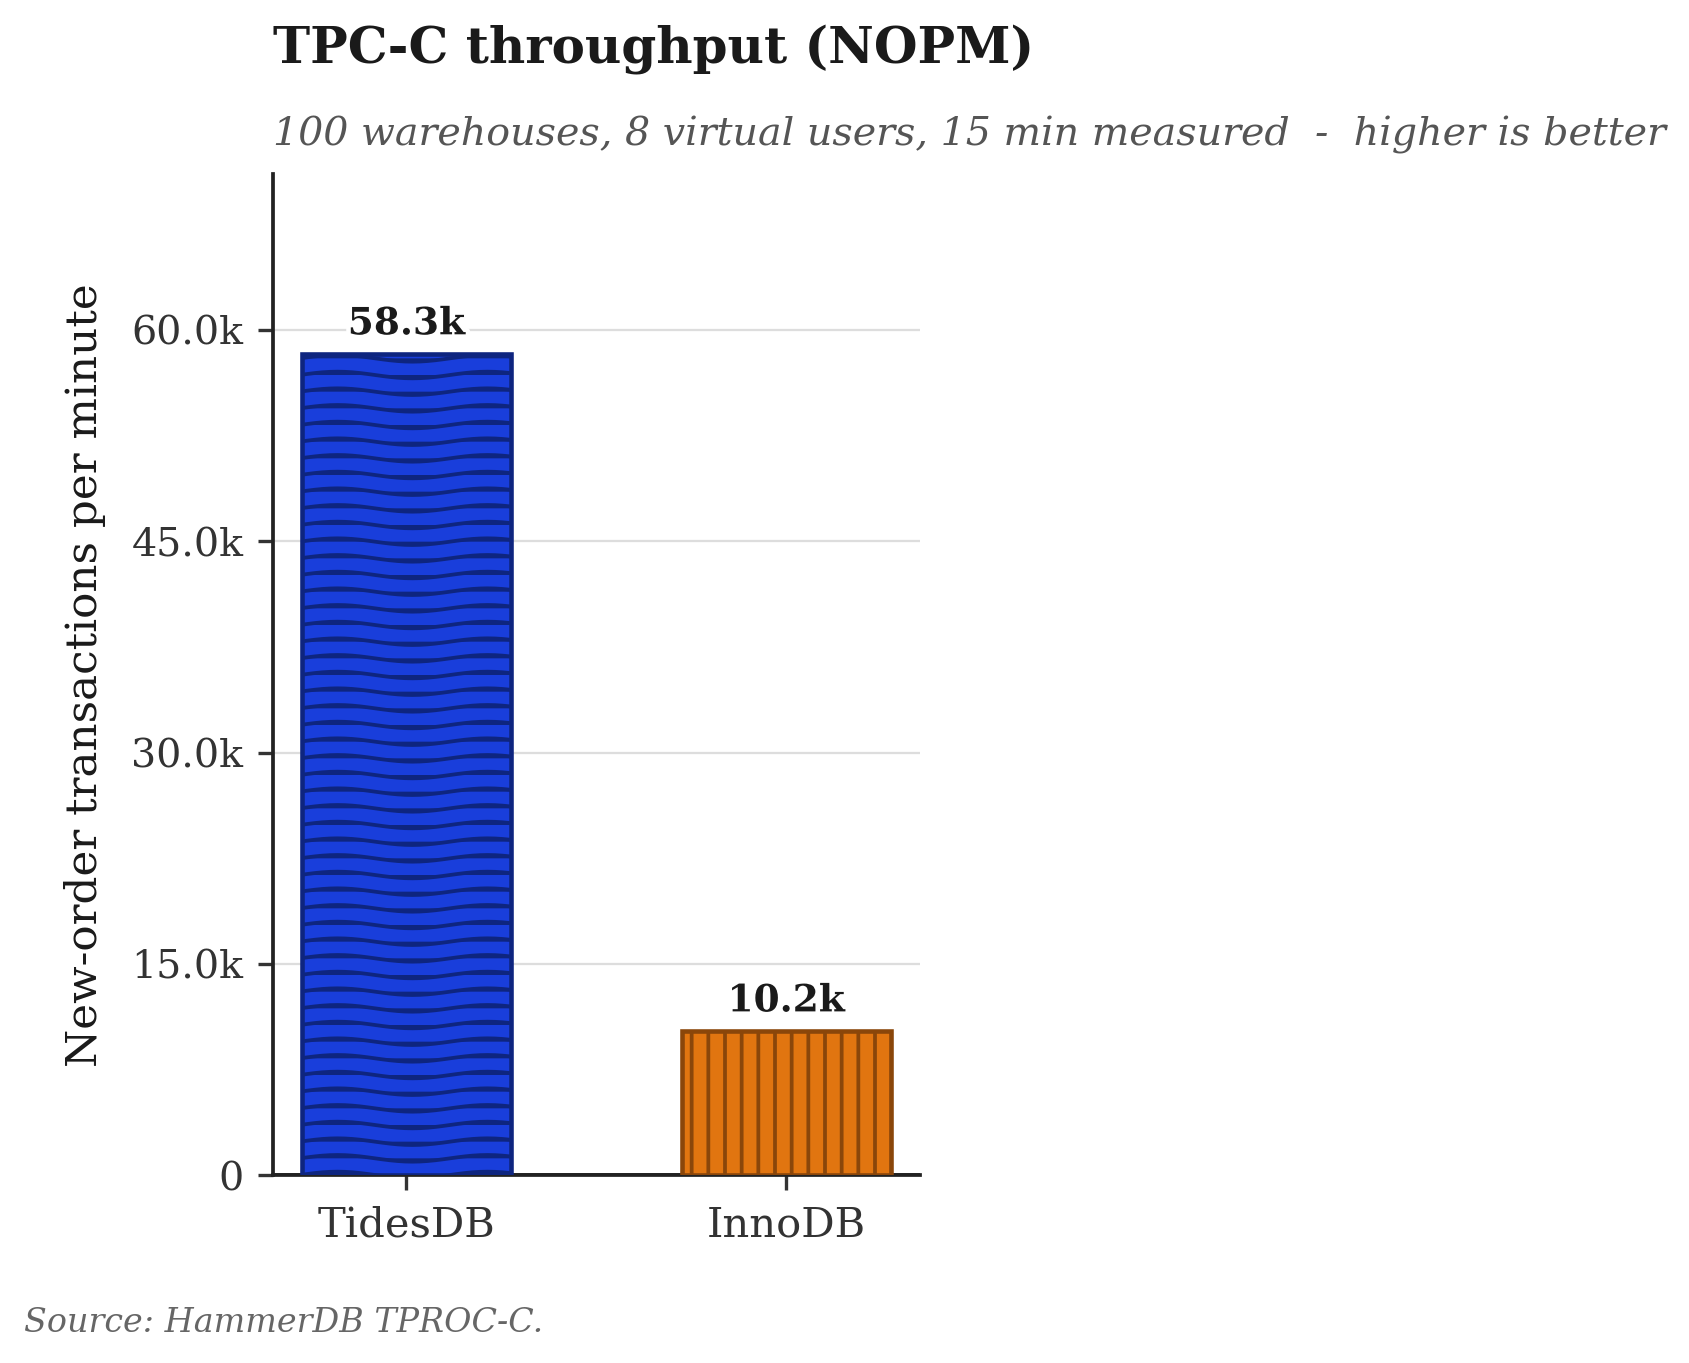
New orders per minute (NOPM)
Now for new orders per minute, TidesDB took it at almost 6x more new orders per minute, 58.3k vs InnoDB’s 10.2k. That throughput advantage shows up in the raw call counts too, over the run TidesDB completed about 2.66M New Order transactions to InnoDB’s 423k, so it wasn’t just faster per request, it pushed a much larger total volume of work through.
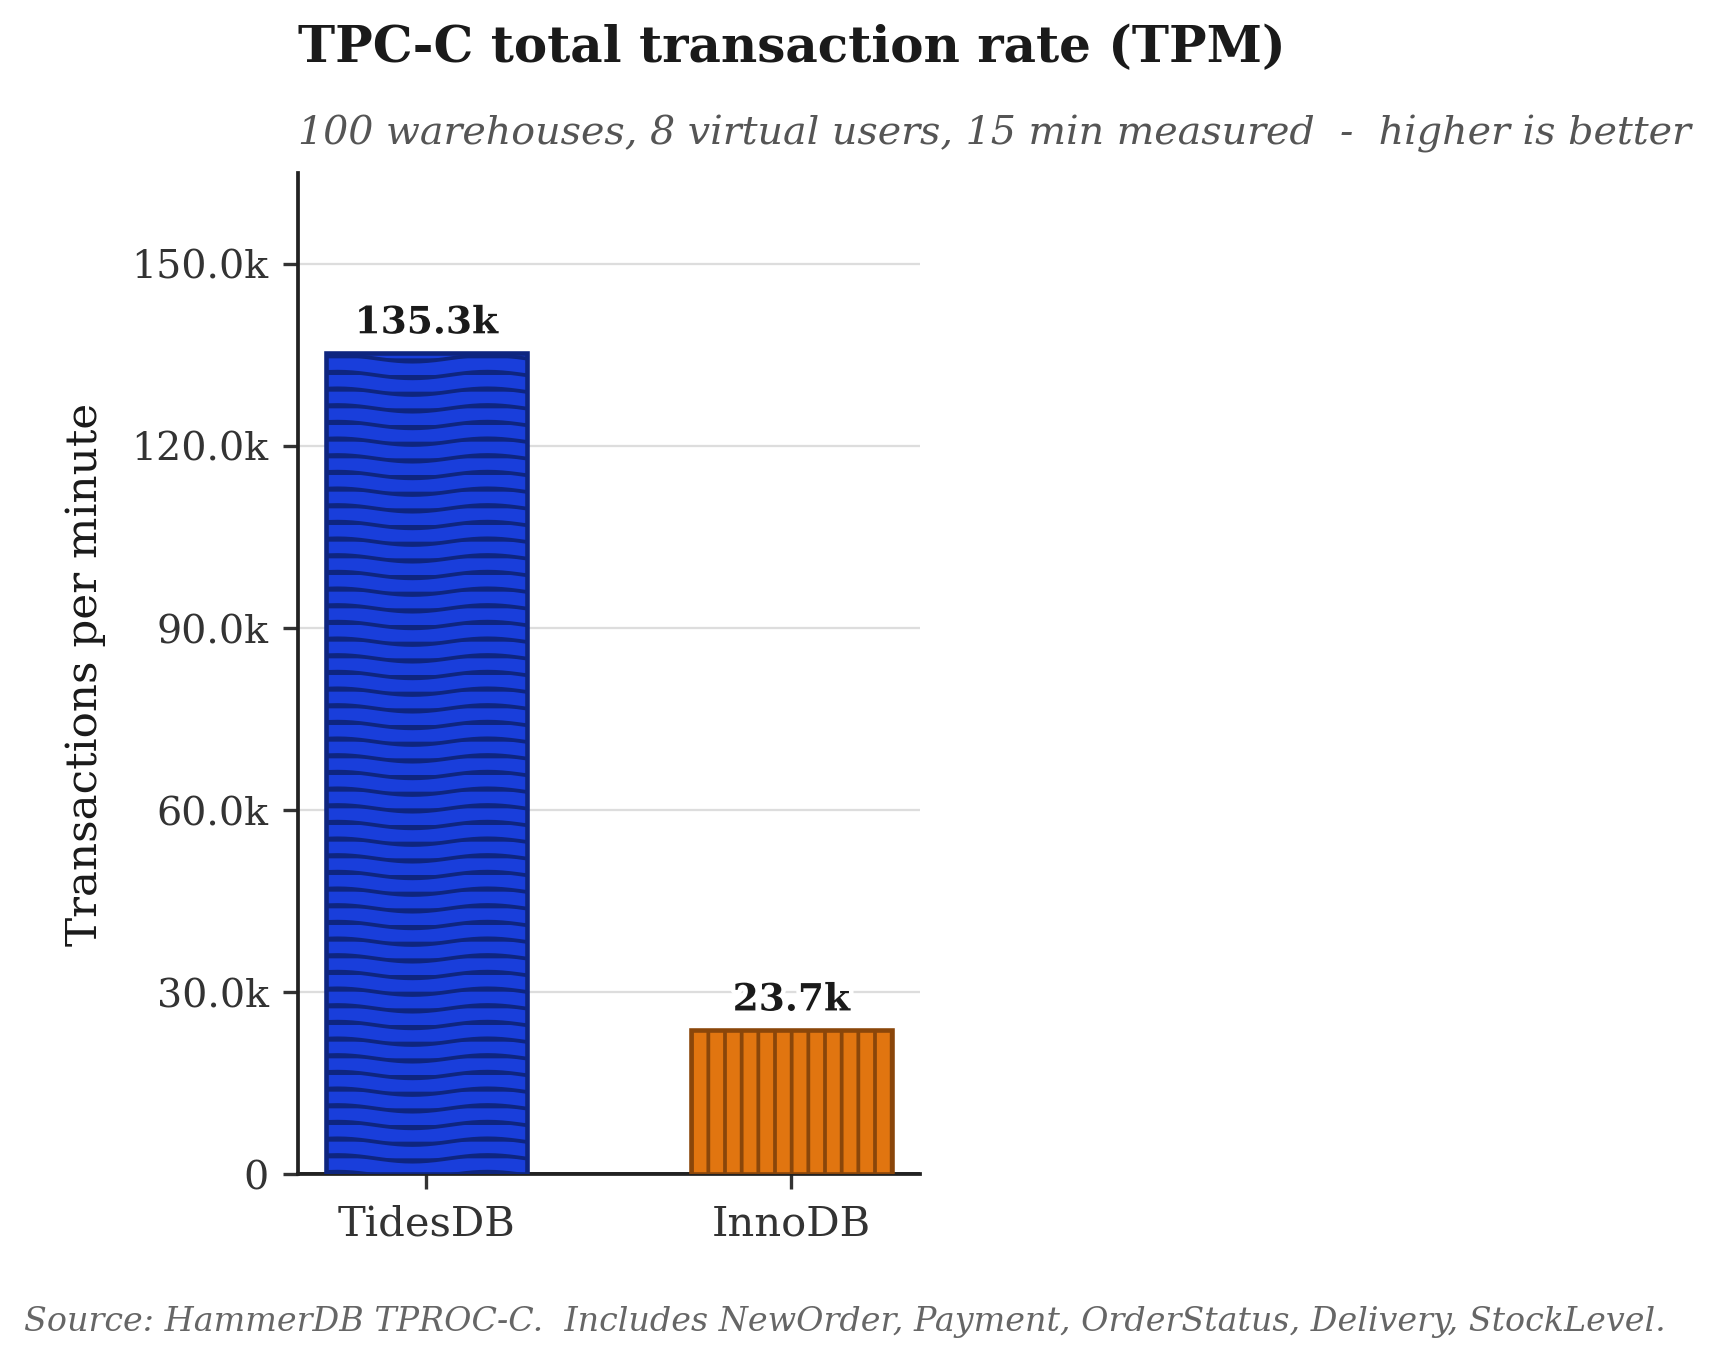
Transactions per minute (TPM)
For total transactions per minute we’re looking at the same kind of gap, about 5.7x, at 135.3k TidesDB vs 23.7k InnoDB. NOPM and TPM track each other closely here, which is what you’d expect since New Order makes up the bulk of the mix, so seeing both land around the ~6x mark is a good consistency check on the numbers.
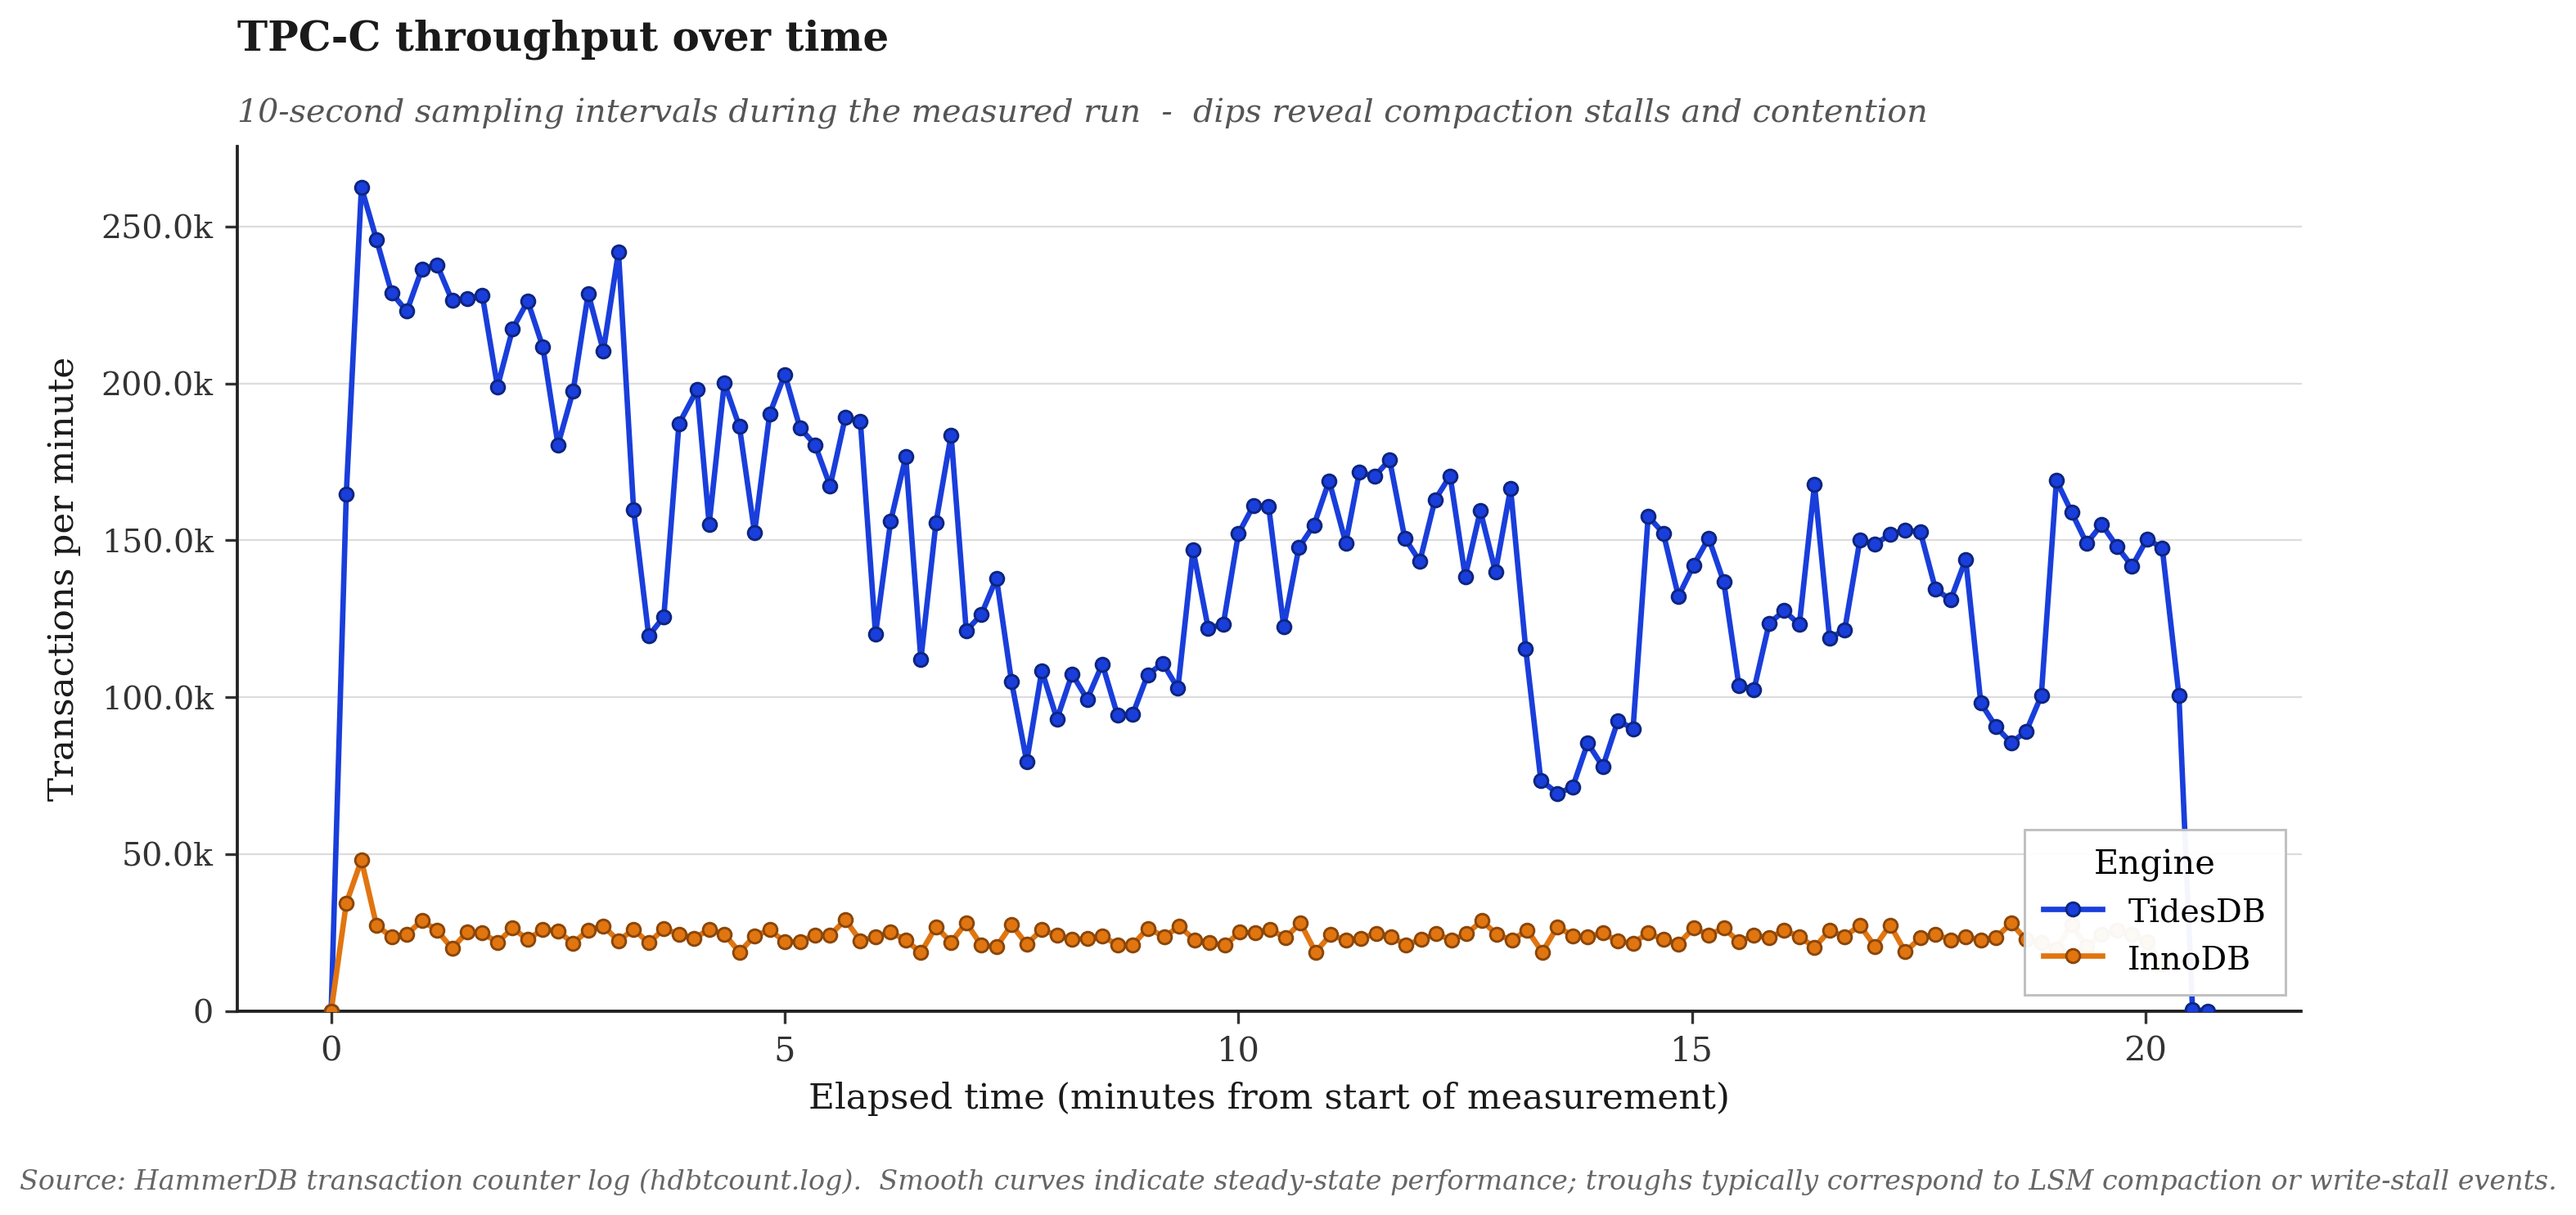
Throughput over time
For throughput over time, TidesDB starts extremely strong and degrades slightly over the course of the run as the flush and compaction queues fill, back-pressure gets applied, and read amplification builds. You can see this in the timeline, it opens up north of 240k TPM, settles into a noisier band through the middle of the run as compaction competes for I/O, and recovers as those queues drain. Compaction over time reduces read amplification, which lets reads become efficient againm thus the dips are the engine doing maintenance, not the engine falling over. If reads are a concern for your workload, you can look into using a B-tree klog, which in some cases can speed up read-heavy workloads.
By comparison, InnoDB’s timeline is flatter and far more stable, holding a fairly steady ~22k–28k TPM throughout, but it’s stable at a level that’s a fraction of where TidesDB spends even its worst moments.
Summary
Putting it all together for this 100-warehouse, 8-virtual-user, 15-minute TPROC-C run on identical resource budgets:
| Metric | TidesDB | InnoDB | Advantage |
|---|---|---|---|
| NOPM | 58,264 | 10,217 | ~5.7x |
| TPM | 135,256 | 23,707 | ~5.7x |
| New Order avg latency | 4.224ms | 26.927ms | ~6x lower |
| New Order p99 latency | 10.989ms | 314.421ms | ~29x lower |
| Schema build time | 662s | 492s | InnoDB ~3 min faster |
The trade-off is rather, and, to be honest, it’s the trade-off you’d expect from an LSM engine versus a B-tree one. InnoDB wins the load/build phase, where there’s no flush and compaction overhead to pay. Once you’re actually serving the transactional workload, though, TidesDB pulls away hard, roughly 6x the throughput and dramatically tighter tail latency, which is the metric that tends to matter most when a system is under real pressure. The throughput does taper as compaction kicks in, but even at its lowest TidesDB is running well above InnoDB’s steady state.
That’s all for now!
—
You can find a zip of the raw data here: results_20260602_233154.zip (sha256: ac7ac52ce6bbbf7feb1bf04bfcb4063f77c2f91f8c1981d2b267ef2f0735334f)