Benchmark Analysis on TidesDB v9.8.0 and RocksDB v11.0.4

published on April 16th, 2026
Well it’s been a while since I’ve posted an article describing results from benchtool analysis, thus here we are with a new write up on analysis between the latest releases of both TidesDB (v9.8.0) and RocksDB (v11.0.4).
I’ve been publishing more TPC-C analysis lately since that’s what puts TidesDB to work through TideSQL for example, but benchtool still gets run every release. It exercises engines across six workload types (write, read, mixed, delete, seek, range) and six key patterns (sequential, random, zipfian, uniform, timestamp, reverse), and reports throughput, full latency distributions (p50/p95/p99), plus write/read/space amplification. That last bit matters, since amplification is where you actually see SSD wear and storage overhead, not just raw ops/sec. So it’s a solid tool for profiling where an engine needs work, and for letting YOU decide which engine fits your workload.
The specs for the environment are
- AMD Ryzen Threadripper 2950X (16 cores 32 threads) @ 3.5GHz
- 128GB DDR4
- Ubuntu 22.04 x86_64
- GCC (glibc)
- XFS raw NVMe(SAMSUNG MZVLB512HAJQ-00000) w/discard, inode64, nodiratime, noatime, logbsize=256k, logbufs=8
Provided by Hetzner. The server is scrubbed every run, made sure to only be running the necessary services for the analysis to avoid any interference with the results. Isolated as much as possible to ensure accurate results.
As stated I ran the TidesDB benchtool program using script tidesdb_rocksdb_old.sh.
Both engines are configured identically regarding block cache, write buffers, and other relevant settings. Both engines have durable writes disabled in tidesdb_rocksdb_old.sh. Keys are 16 bytes, values are 100 bytes unless noted otherwise.
I ran the tidesdb_rocksdb_old.sh script 4 times, which are using a fixed amount of threads (8) across all benchmarks within runners.
So let’s get into it as both engines have been optimized and improved in various ways. Sometimes fixing a bug can cause a performance regression in some areas while improving in others!
So to start let’s look at the 4 iterations of the usual runner on the threadripper.
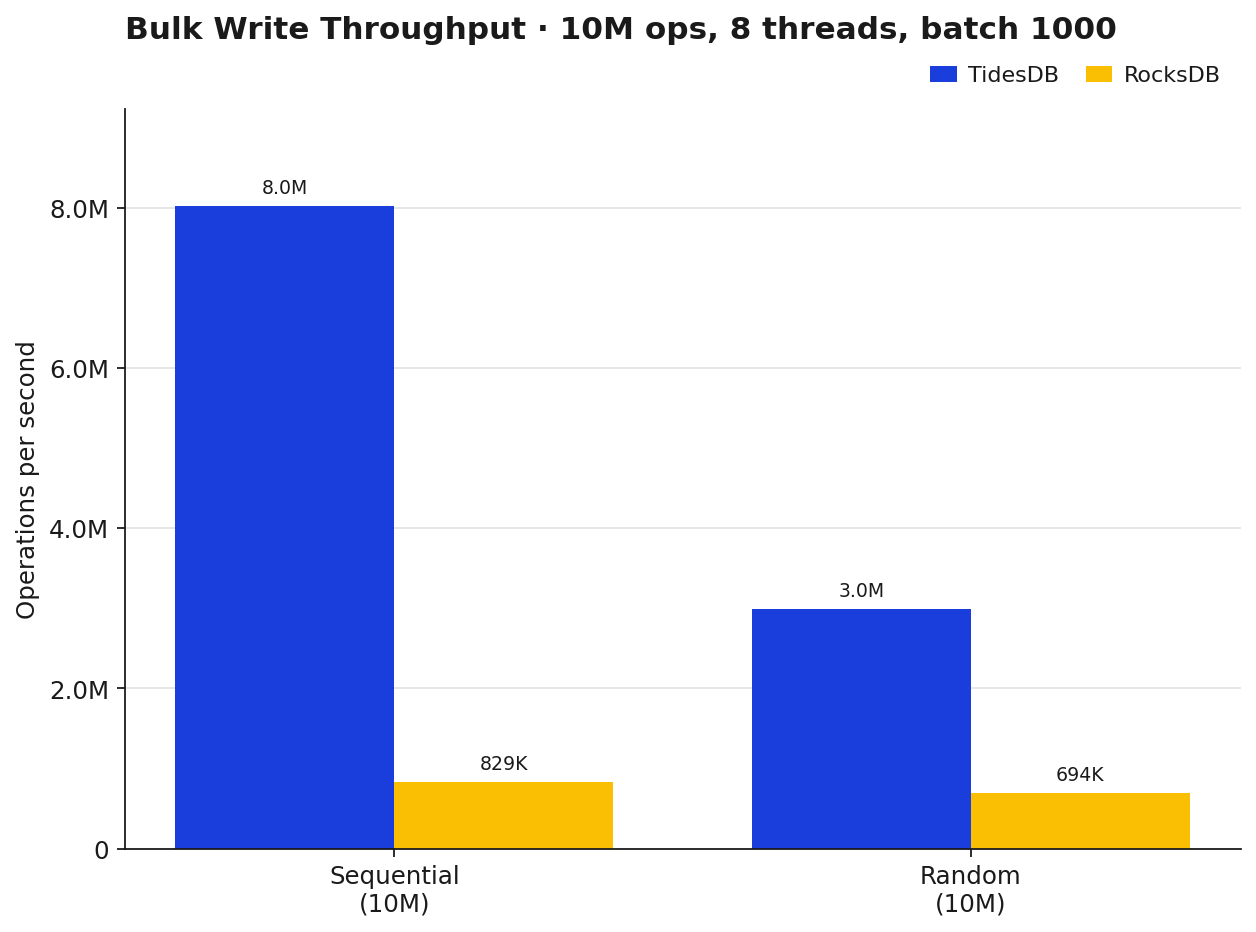
Sequential writes is where TidesDB really pulls ahead, ~8.0M ops/sec against RocksDB’s ~829K, roughly 9.7x. Random writes tighten the gap a bit but TidesDB still holds ~3.0M ops/sec against RocksDB’s ~694K, so still a solid 4.3x. Nothing too surprising here, the sequential path in TidesDB has been aggressive for a while now and 9.8.0 keeps that edge rather sharp.
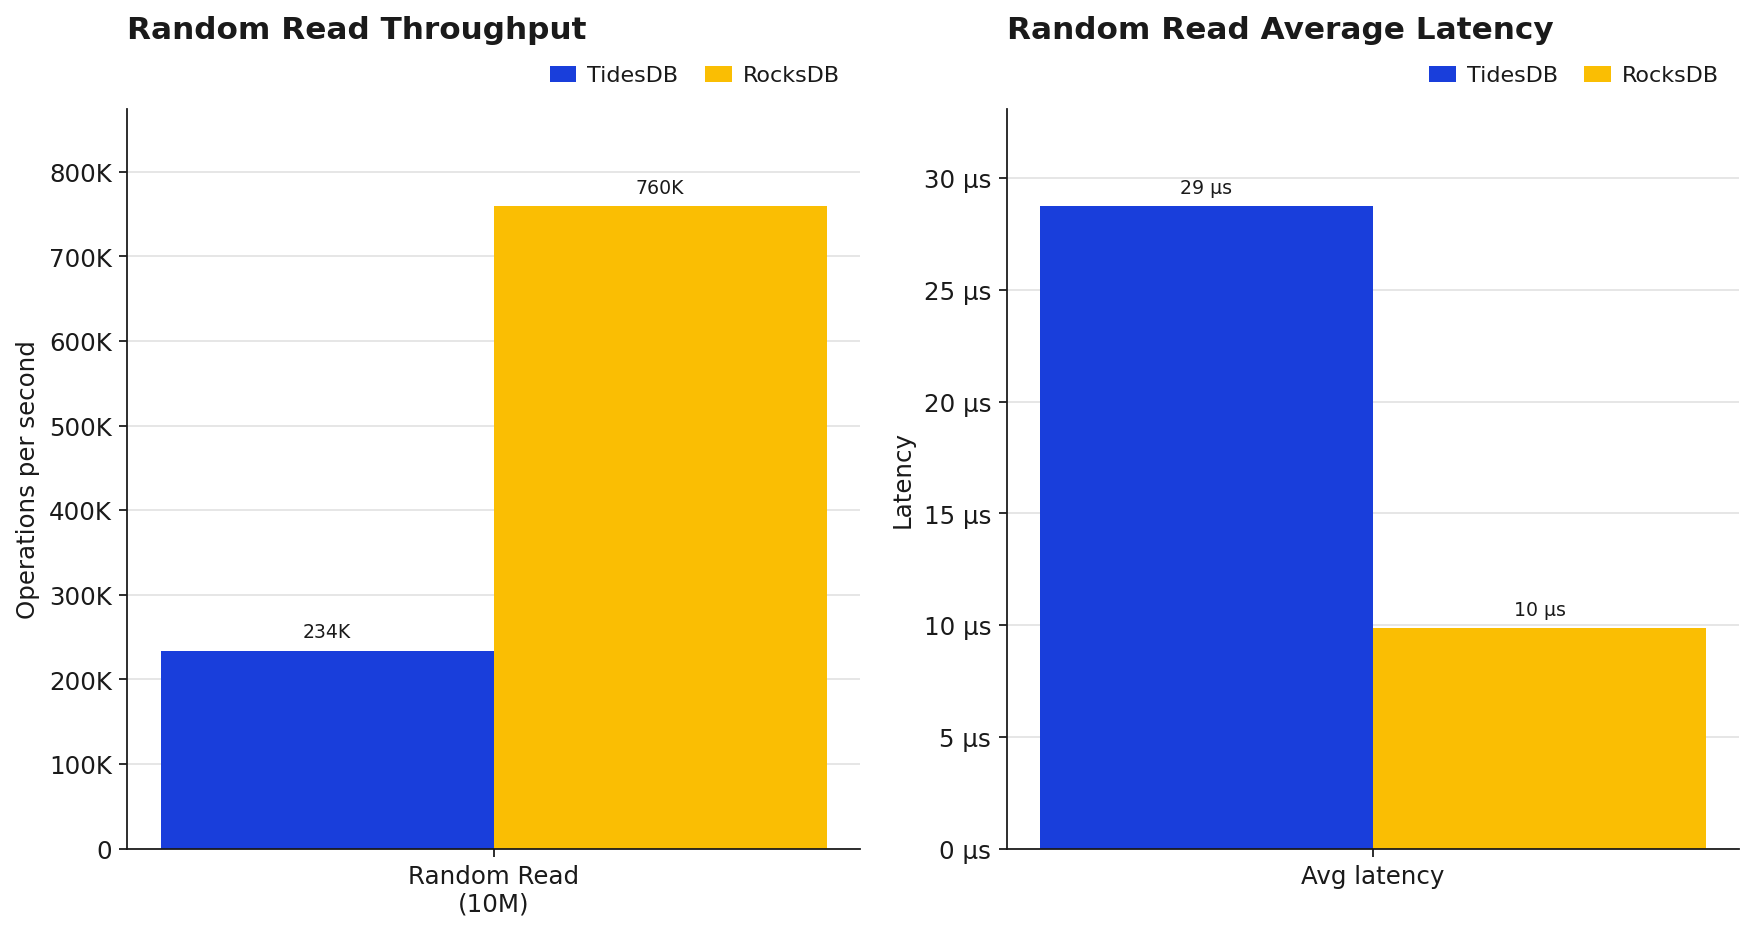
RocksDB lands at ~760K ops/sec with an average GET latency of ~9.9µs while TidesDB sits at ~234K ops/sec at ~28.8µs. TidesDB’s point-read path on some CPU’s and environments may not be as fast, when looking at the history of TidesDB’s benchmarks you’ll see modern CPUs and environments can handle TidesDB’s point-read path better. However, this is a clear area where RocksDB has an advantage in this analysis. There are potential areas to probe such as RocksDB’s hyperclockcache lock contention as opposed to TidesDB’s lock-free clock cache implementation and where TidesDB caches entire 64kb blocks and nodes, something to analyze yourself as well.
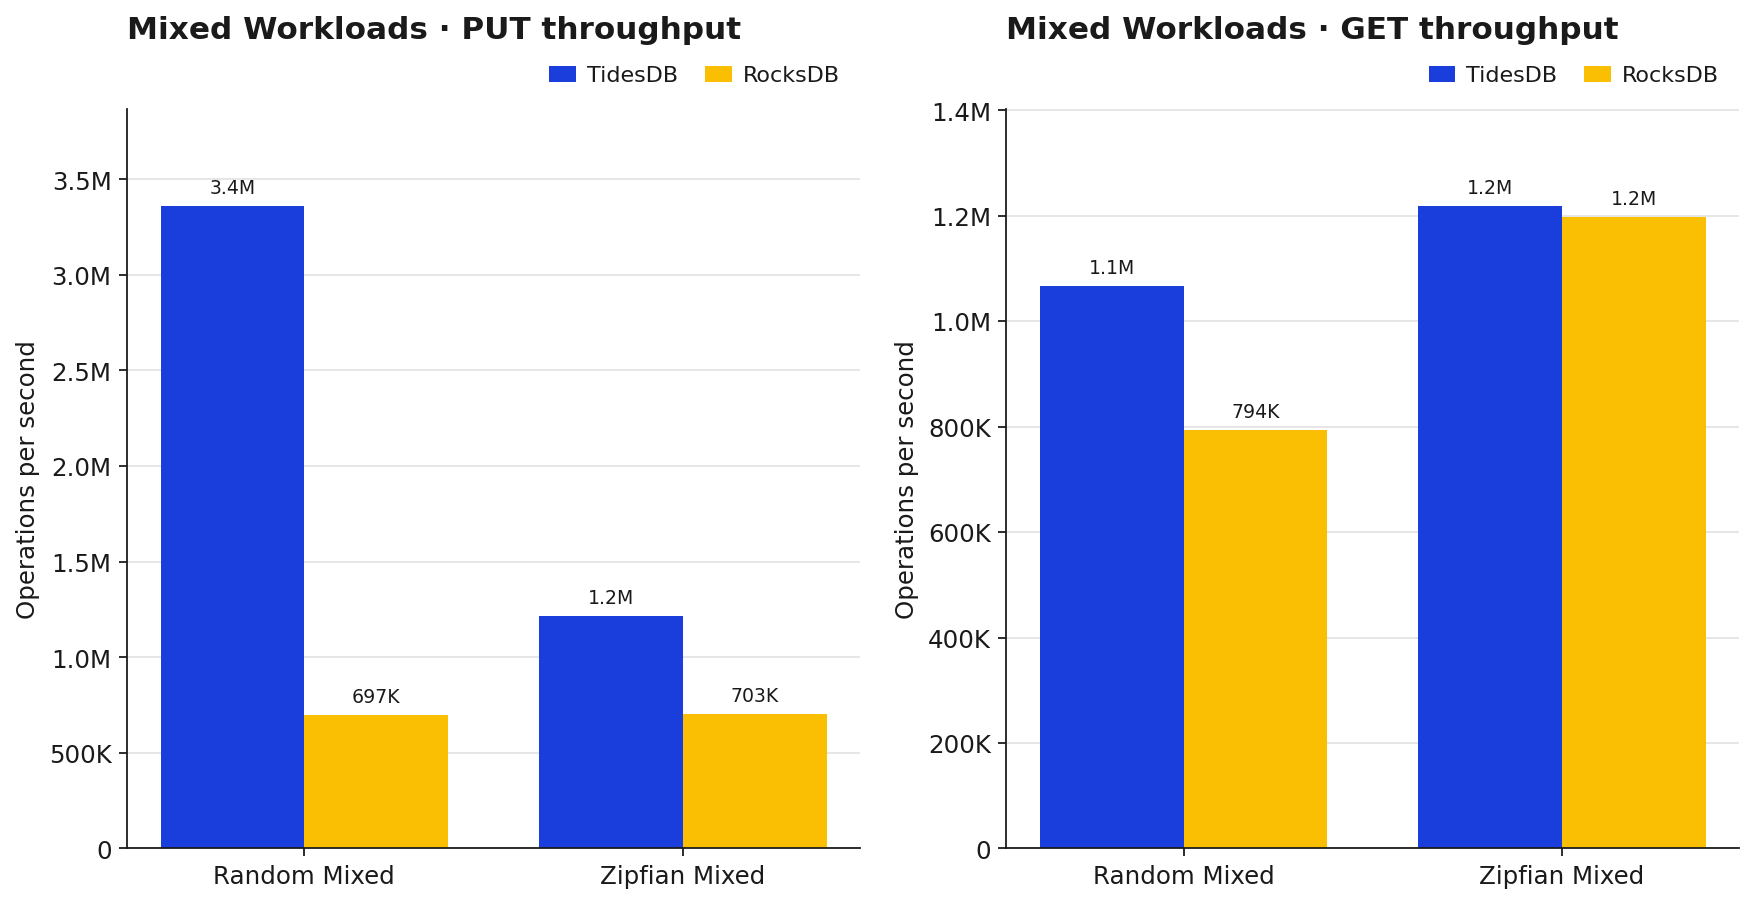
On random mixed TidesDB handles PUTs at ~3.36M/sec vs RocksDB’s ~697K, and GETs at ~1.07M vs ~794K, so TidesDB comes out ahead on both sides. On zipfian mixed the PUT gap tightens to ~1.7x and GET throughput is basically tied (~1.22M vs ~1.20M). Zipfian evens things out because the hot keys stay cached on both engines, which is why the GET lines converge.
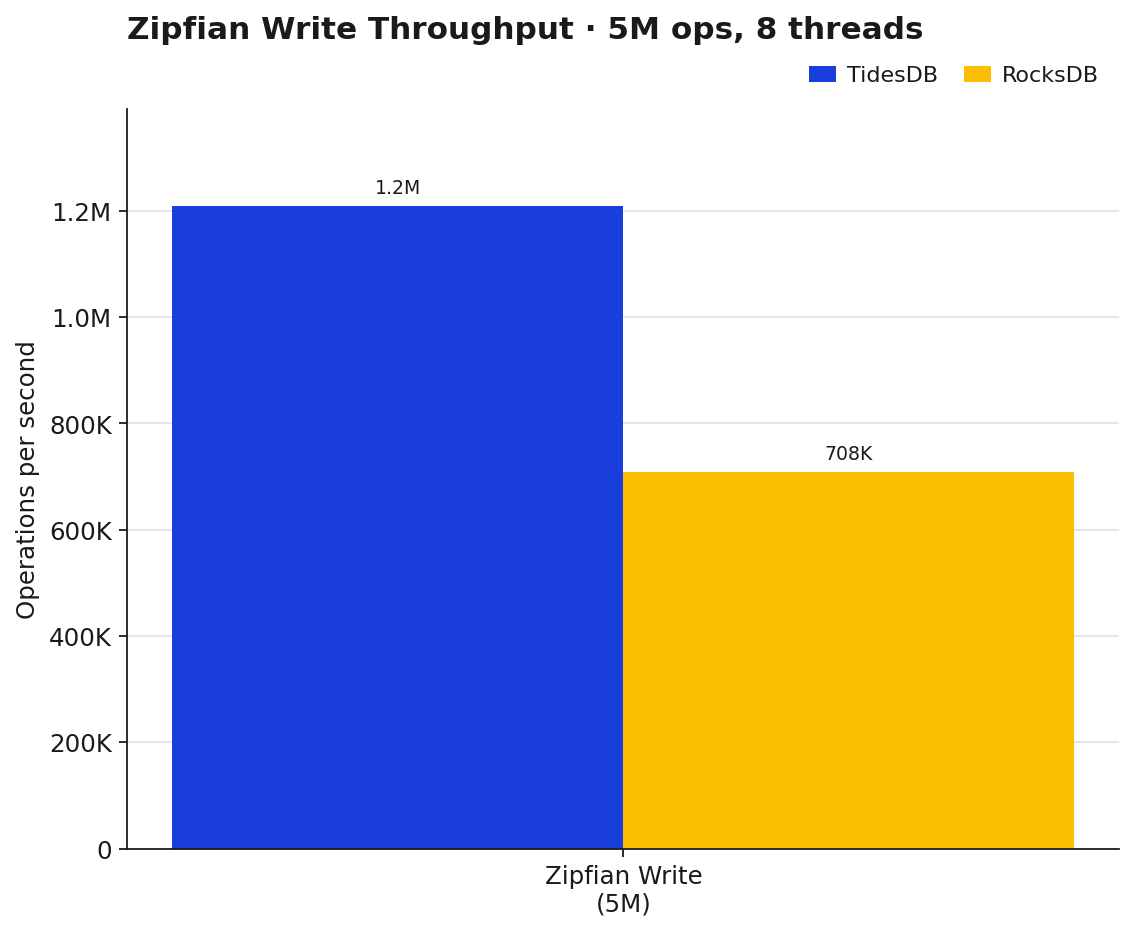
Zipfian writes collapse TidesDB’s usual lead to about 1.71x over RocksDB (~1.21M vs ~708K). Zipfian concentrates writes on a small hot set so most of the work ends up overwriting lots of entries for both engines.
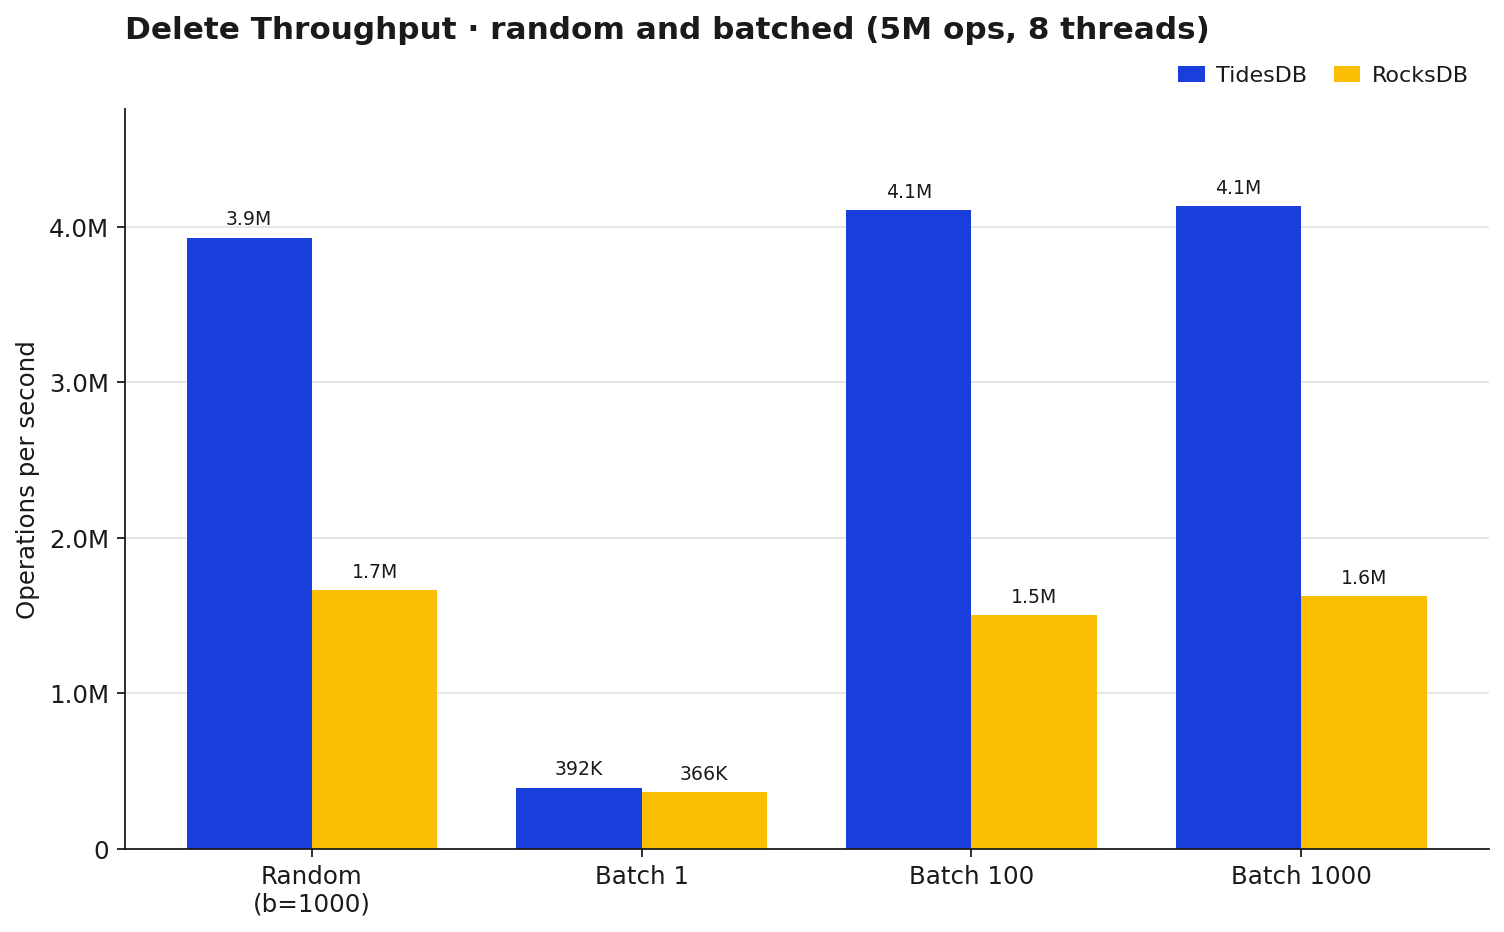
Deletes are another win for TidesDB once you’re batching. Single deletes (batch=1) are basically a wash (~392K vs ~366K, 1.07x). Bump to batch 100 or 1000 and TidesDB settles around 4.1M ops/sec against RocksDB’s 1.5-1.6M, roughly 2.5-2.7x. The random b=1000 delete run lands in the same neighborhood at 2.36x.

Value size matters a lot here. With 4KB values TidesDB hits ~329K ops/sec vs RocksDB’s ~78K, about 4.22x. With 64B values both engines jump way up (~2.66M vs ~747K) but the ratio stays close at 3.56x.
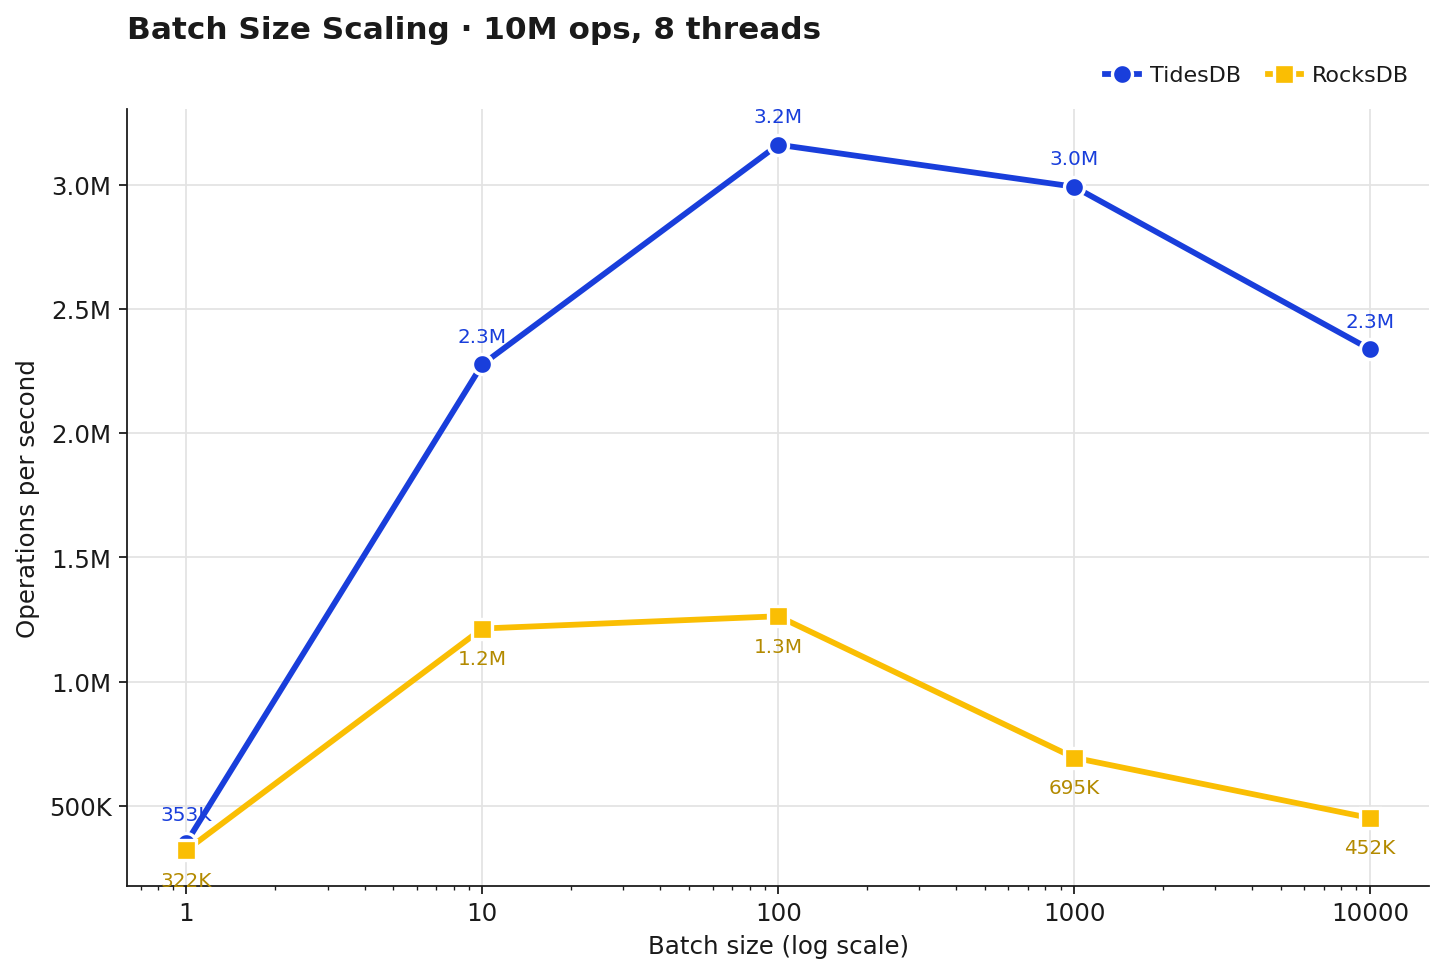
At batch=1 both engines are close (~353K vs ~322K, 1.10x). As the batch grows the gap widens, 1.88x at 10, 2.50x at 100, 4.31x at 1000, and 5.18x at 10000. TidesDB peaks around batch=100 (~3.16M) and slowly drops off, RocksDB peaks at batch=100 too (~1.26M) but falls off harder after that. The sweet spot on this box is batch 100-1000 for both engines.
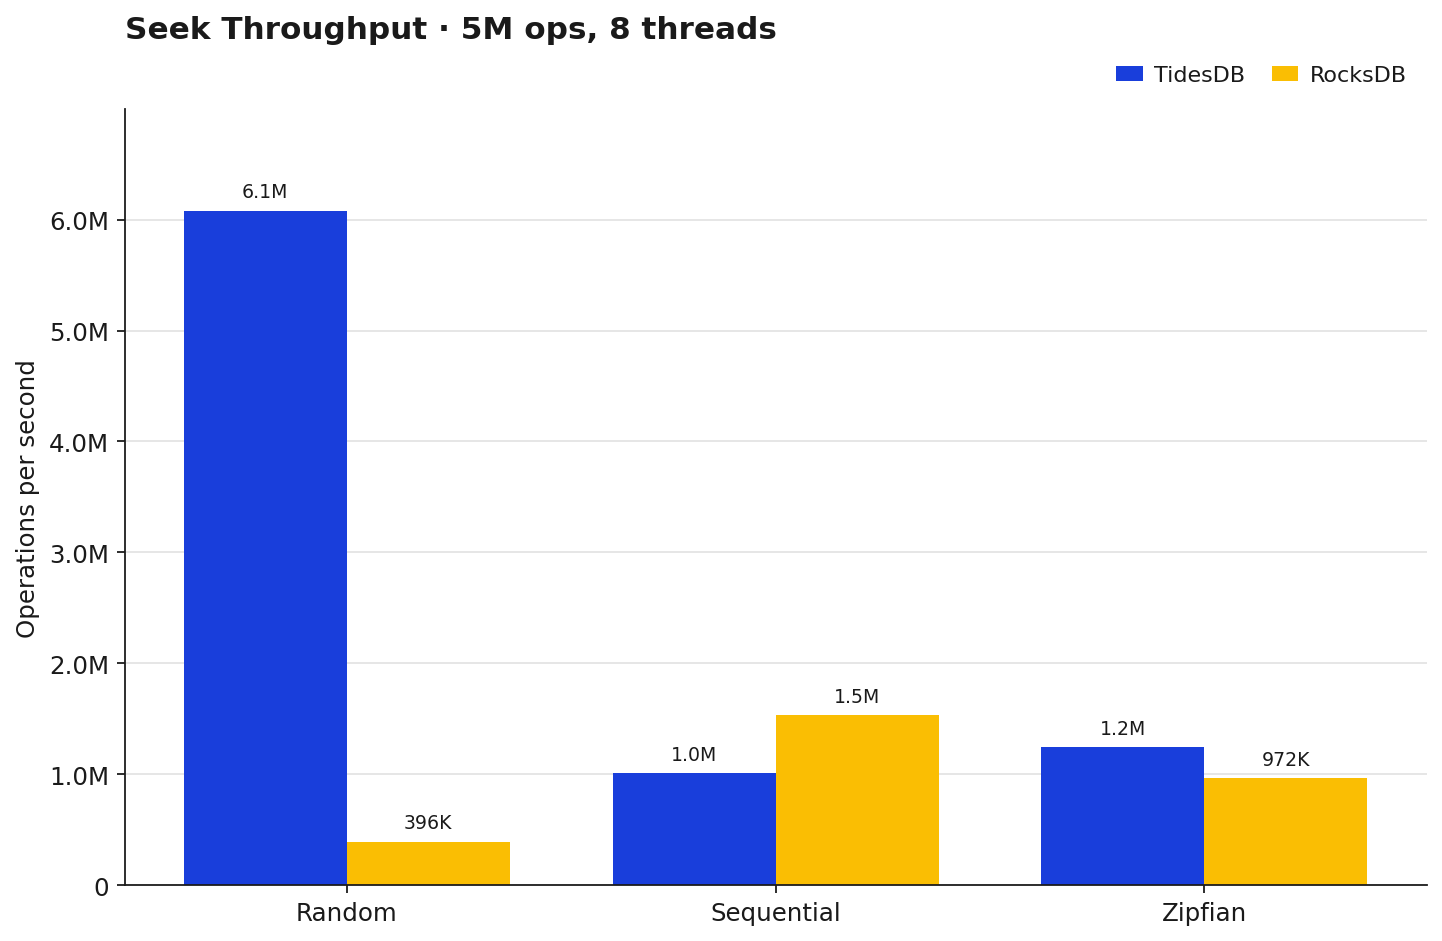
On random seeks TidesDB absolutely runs away with it, ~6.08M ops/sec vs RocksDB’s ~396K. Sequential seeks flip the other way, RocksDB wins at ~1.53M vs TidesDB’s ~1.02M. Zipfian sits between the two with TidesDB back on top (~1.25M vs ~972K). Different access patterns, different winners.
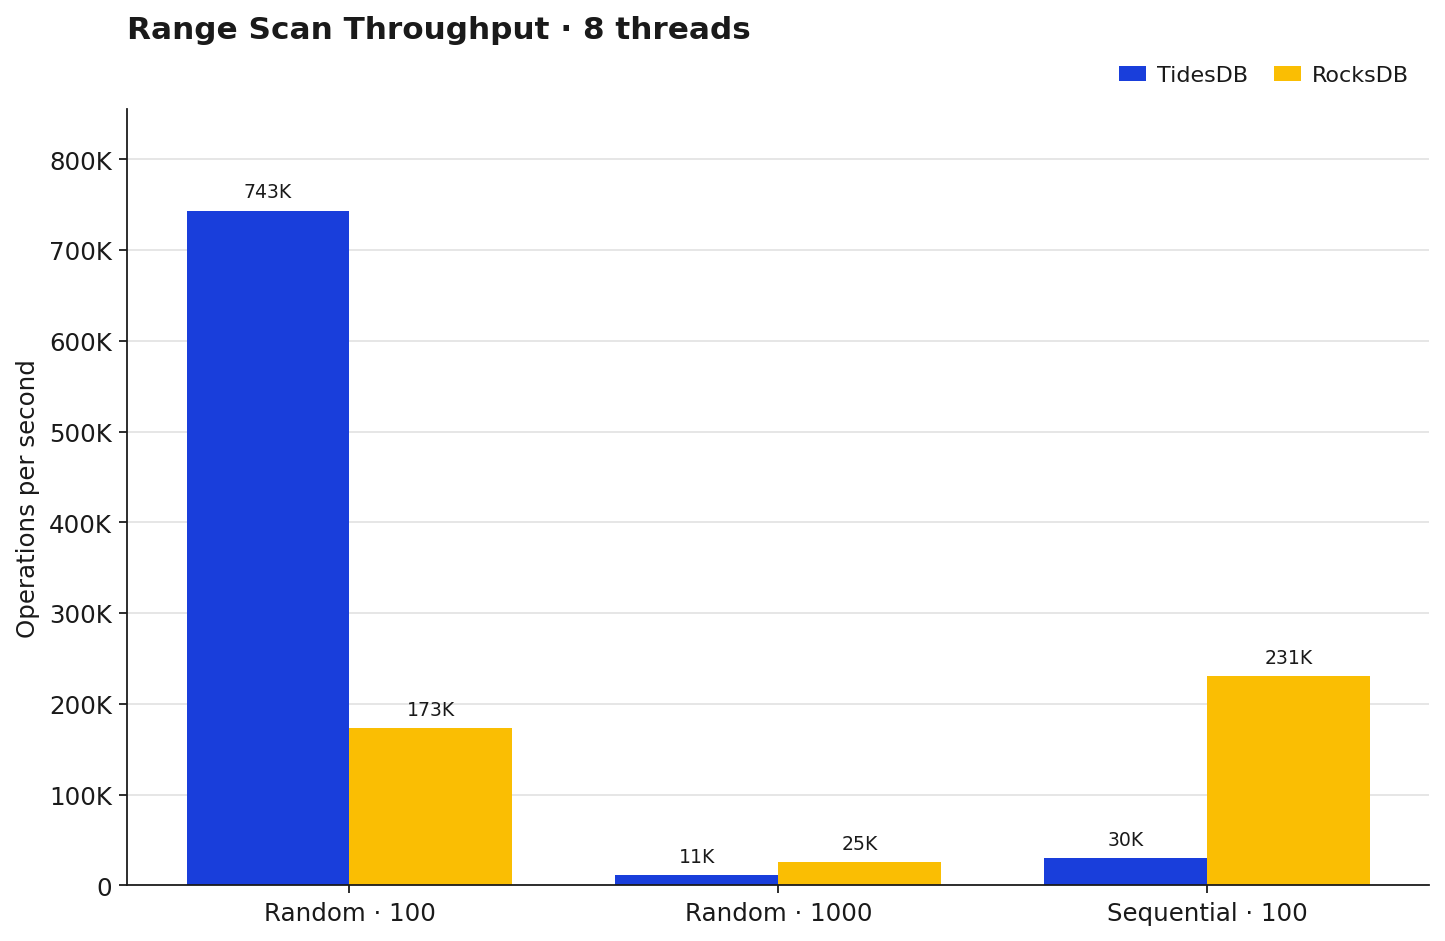
Small random ranges (100 entries) TidesDB wins 4.29x, but push to 1000-entry ranges and RocksDB pulls ahead (~25K vs ~11K), and sequential 100-entry ranges RocksDB wins outright (~231K vs ~30K). That last one is a known pattern within benchtool runs, TidesDB’s sstable layout and block cache warmup still favor random access patterns over long sequential scans. This has been profiled and optimized across patches in 9.
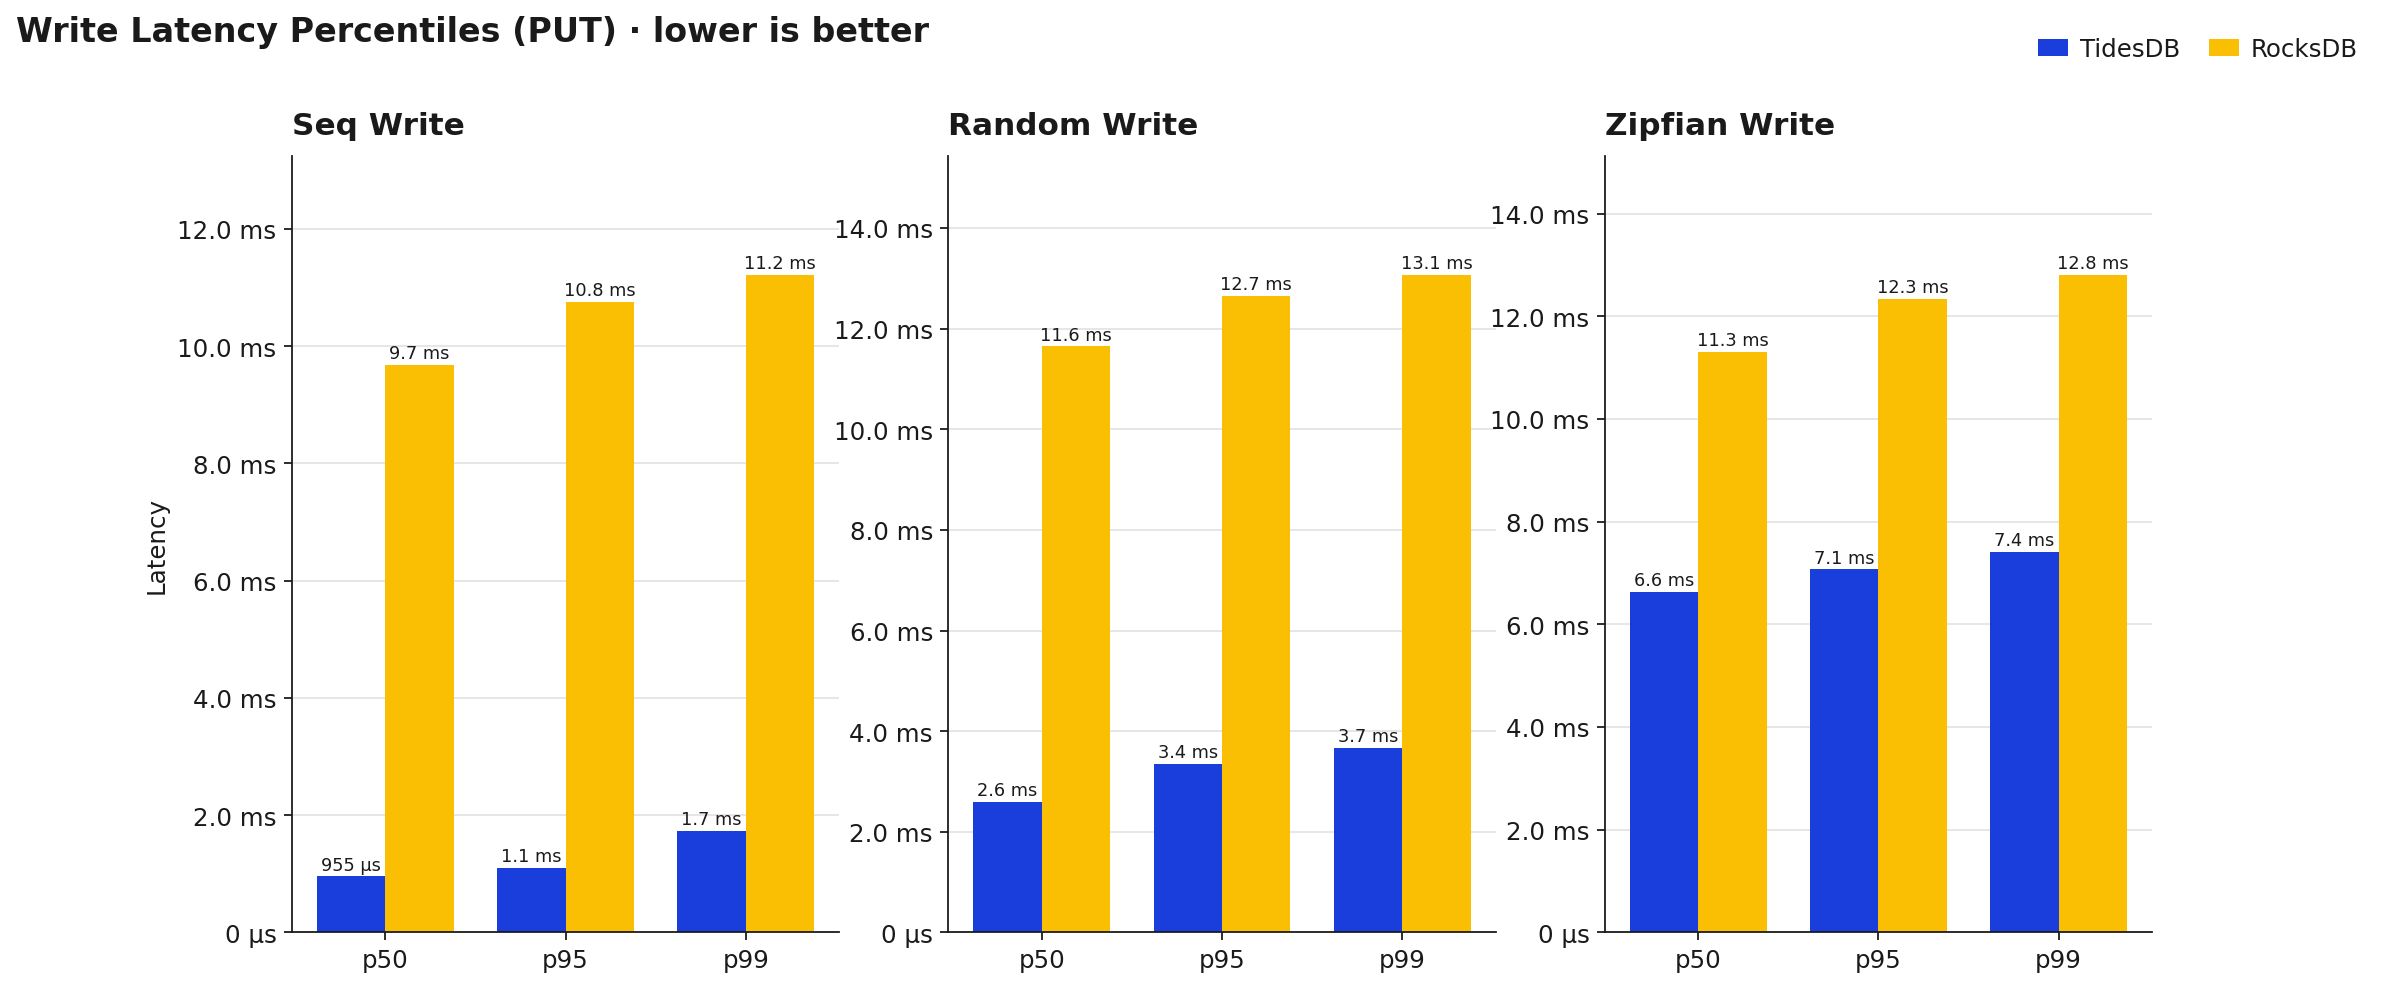
TidesDB’s sequential write p99 sits at ~1.7ms vs RocksDB’s ~11.2ms, so roughly 6.5x lower. Random write p99 is ~3.7ms vs ~13.1ms. Zipfian is the tightest gap but still ~7.4ms vs ~12.8ms. What I like seeing here is how flat TidesDB’s p50-to-p99 spread is, the long tail isn’t blowing up, which is usually the first thing to break under contention. That’s the kind of shape you want.
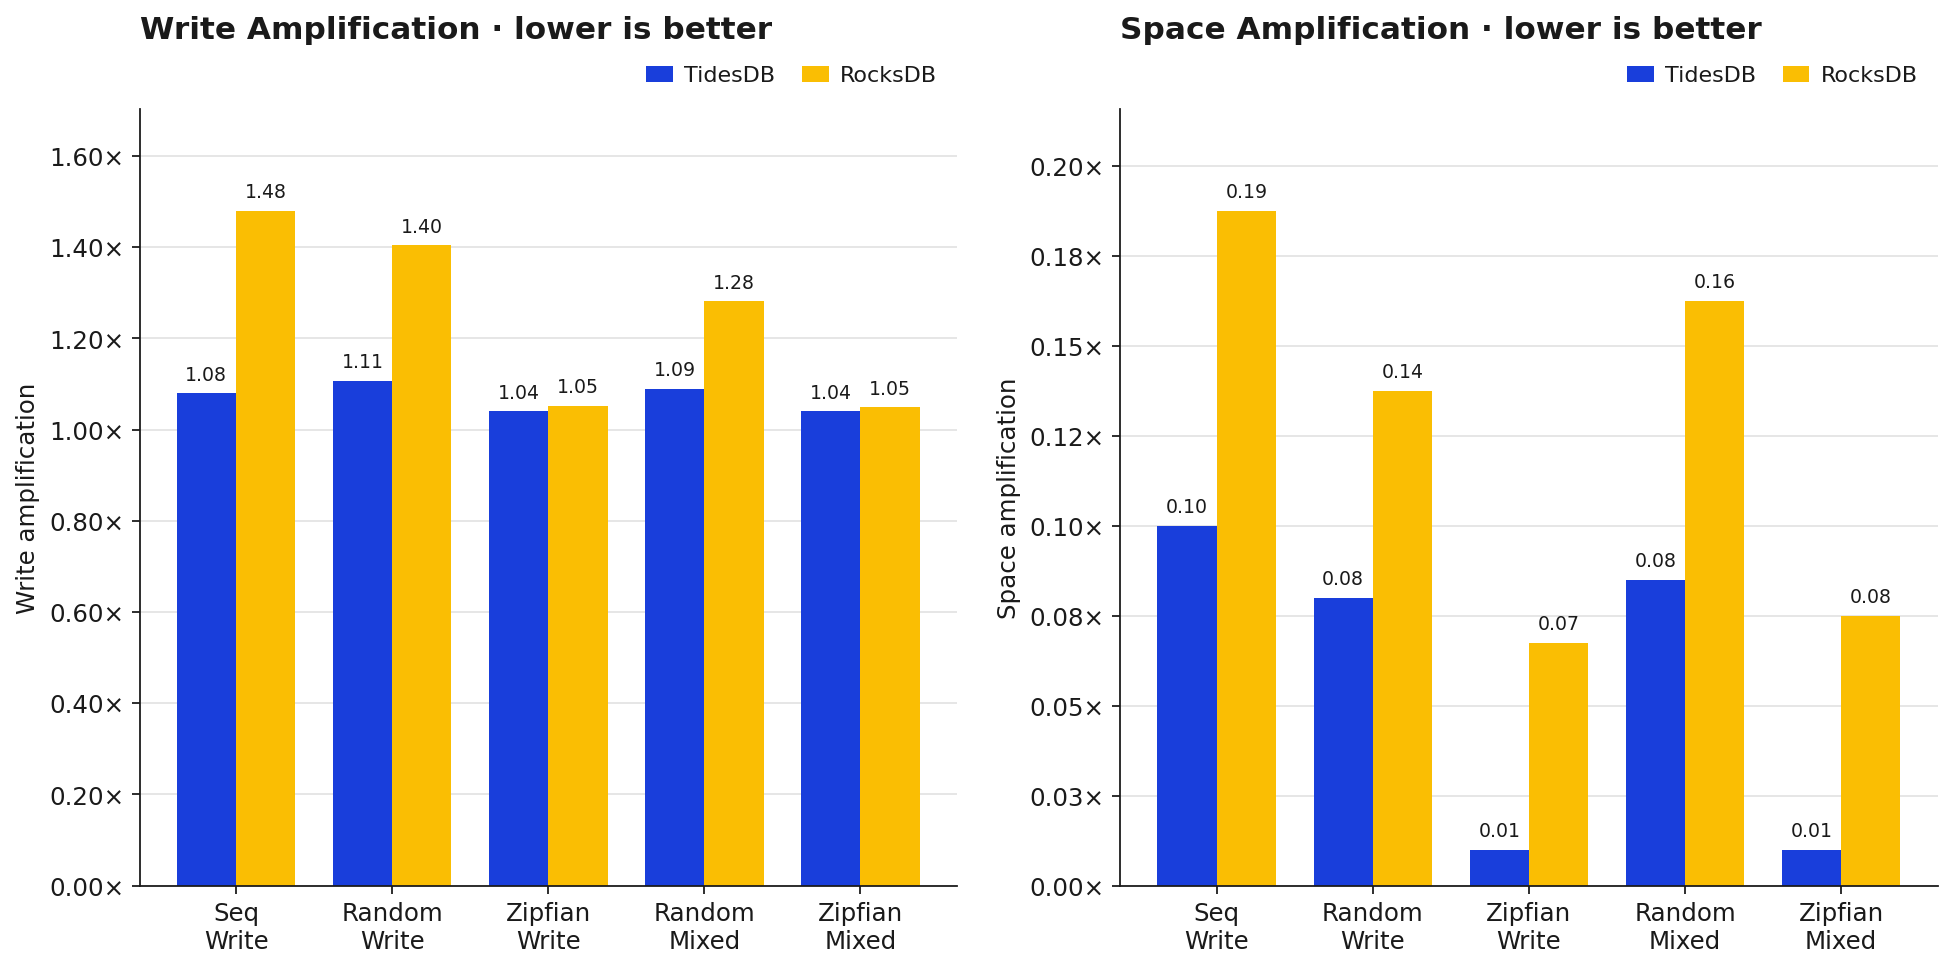
Write amplification is one of those metrics that matters long-term since it directly translates to SSD wear. TidesDB’s write amp on sequential is 1.08x vs RocksDB’s 1.48x, and on random it’s 1.11x vs 1.40x, so in a heavy-write production use case TidesDB is writing noticeably less to disk for the same workload. Zipfian evens out to ~1.05x on both engines since there’s so much memtable overwriting. Space amp is similar, TidesDB keeps it tighter across every workload shown here.
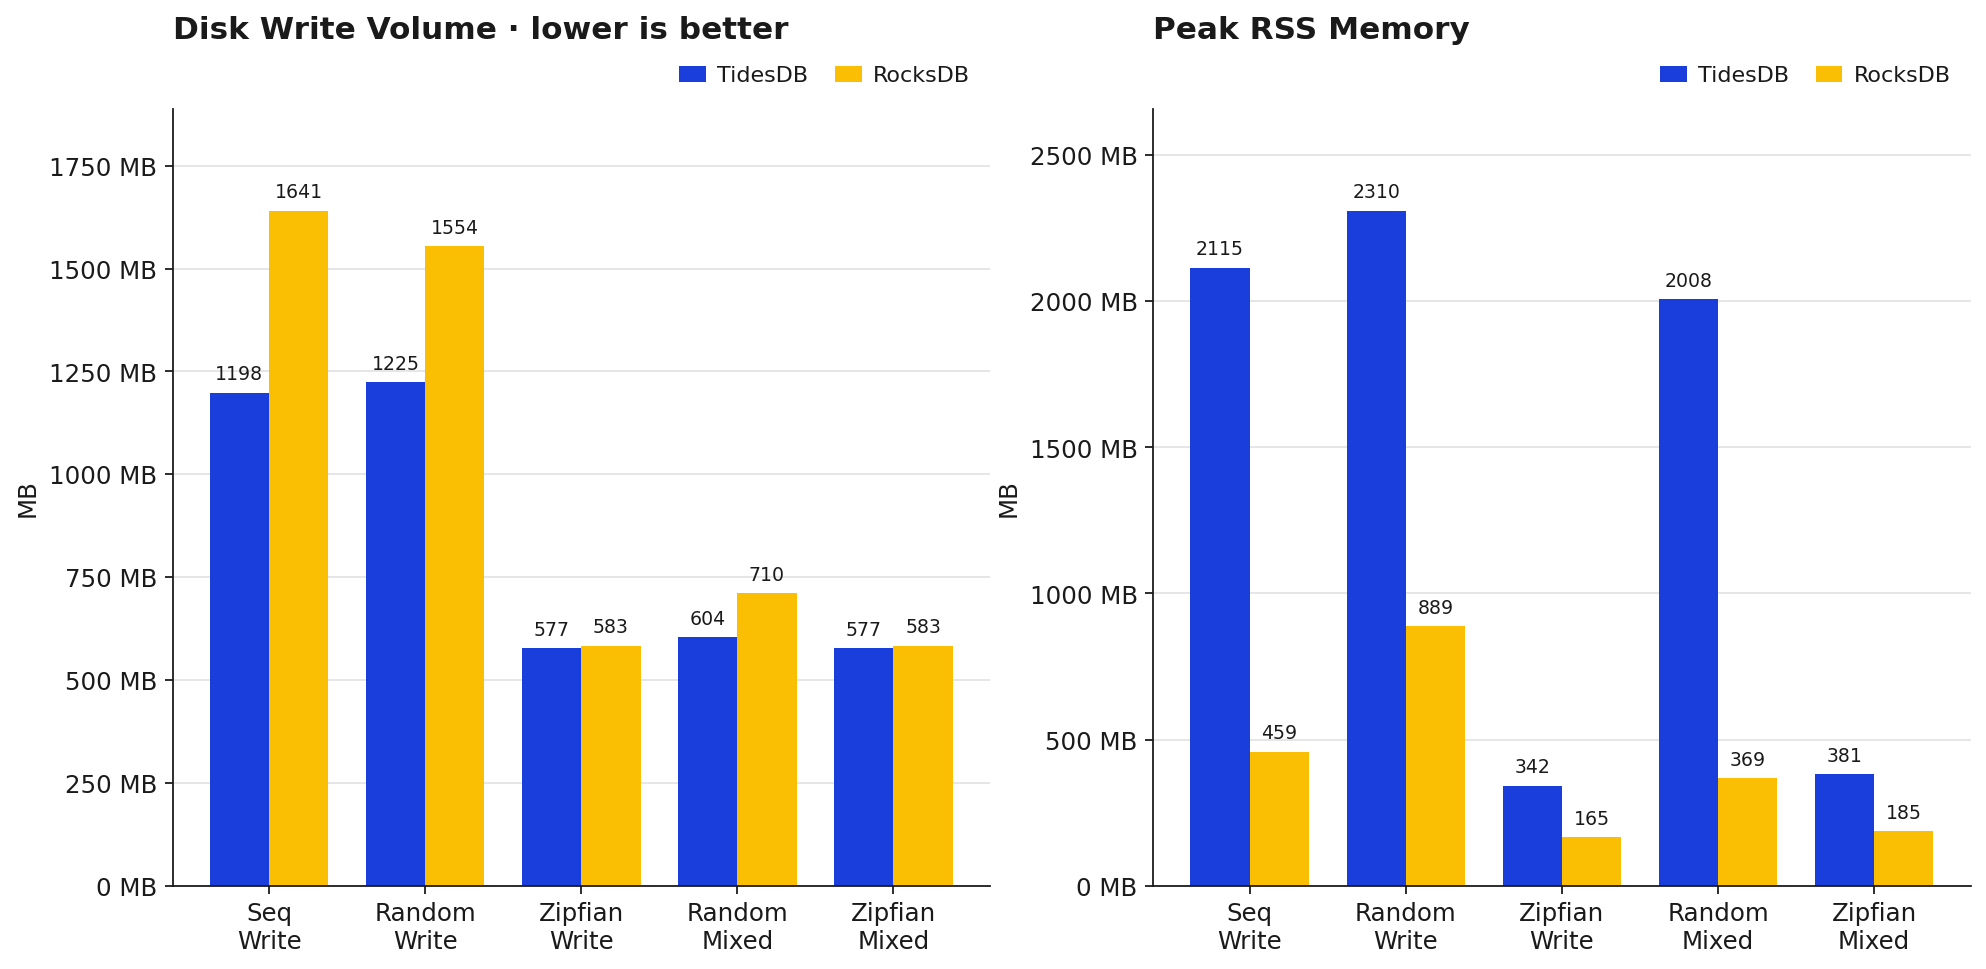
Disk write volume lines up with the amplification numbers, TidesDB writes less to disk on sequential (1198MB vs 1641MB) and random (1225MB vs 1554MB). On zipfian they’re basically tied (~580MB each) because most writes get absorbed by the memtable anyway. Memory is the flip side though, TidesDB’s peak RSS runs noticeably higher than RocksDB’s, 2115MB vs 459MB on sequential writes for example, and 2310MB vs 889MB on random writes. That’s the tradeoff, TidesDB caches more aggressively to hit those throughput and latency numbers. If you’re memory-constrained you can however utilize the btree klog option which trades pays space for memory. TidesDB won’t utilize block indexes the klog will become the block index as a btree.
Wrapping up
So putting it all together. TidesDB wins the bulk write tests by a wide margin (4-9x on raw throughput, roughly 5-6x on p99 tail latency), holds a solid lead on mixed workloads and batched deletes, and keeps write and space amplification lower which will show up as less SSD wear over time. Where it loses on this environment is random point reads (RocksDB is ~3.3x faster there), sequential and large range scans though this can be as stated turned around as it’s highly environment dependent in regards to caching mechanics.
None of this should be read as a clean win or loss for either engine really.
Run your own analysis and make your own decisions in the end.
You can find the raw data below:
| File | SHA256 Checksum |
|---|---|
| tidesdb_rocksdb_benchmark_results_20260416_145116.csv | 78f3ada9e9403b83cde91161053466e560defae6be4c0e247bc59fa53140a5bf |
| tidesdb_rocksdb_benchmark_results_20260416_145116.txt | 22b962c6395b717038b4070facfec54da17325b978a47571152edf86bbe9942f |
| tidesdb_rocksdb_benchmark_results_20260416_150641.csv | cc1d8ad7461cb75647887d8cef982e4ad5b9d5f26be299beb9c9235e6b6c983b |
| tidesdb_rocksdb_benchmark_results_20260416_150641.txt | 070b8744f0354077ad93a93fc30afad168ca9757e1040230b81458a6464f1cf1 |
| tidesdb_rocksdb_benchmark_results_20260416_152149.csv | 2361ef1f09b6bb5c81d01796e3b6326e427ddc41fcf11c866a933c2f71ab0c04 |
| tidesdb_rocksdb_benchmark_results_20260416_152149.txt | e9e291676e581dc122d29b94fca2d9f8d9e3620ce24a4d090f145e9545b00b2e |
| tidesdb_rocksdb_benchmark_results_20260416_153648.csv | 3aaa9996cd92517cc85a7008008284cd0a7c02463bf9a5ddd1c6c62ecb09f9ad |
| tidesdb_rocksdb_benchmark_results_20260416_153648.txt | 92f1ad1b5163f075b2e1d1896e0e851415d052c1564e896a55f39ee575322e8c |
That’s all for now.
Thank you for reading!