Death by a Thousand Cycles - Micro-Optimizations in TidesDB v7.0.4
by Alex Gaetano Padula
December 29th, 2025
Between TidesDB 7.0.3 and 7.0.4, I focused exclusively on micro-optimizations, the kind of changes that save CPU cycles and memory, reduce branch mispredictions, and eliminate unnecessary work. No new features. No architectural changes. Just attention to hot paths.
The result: 6.64M ops/sec sequential writes (up from 6.21M), 2 μs p50 latency on hot-key reads (down from 5 μs), and measurably lower resource consumption across the board. This article documents what changed, why it matters, and what the data reveals about performance at the instruction level.
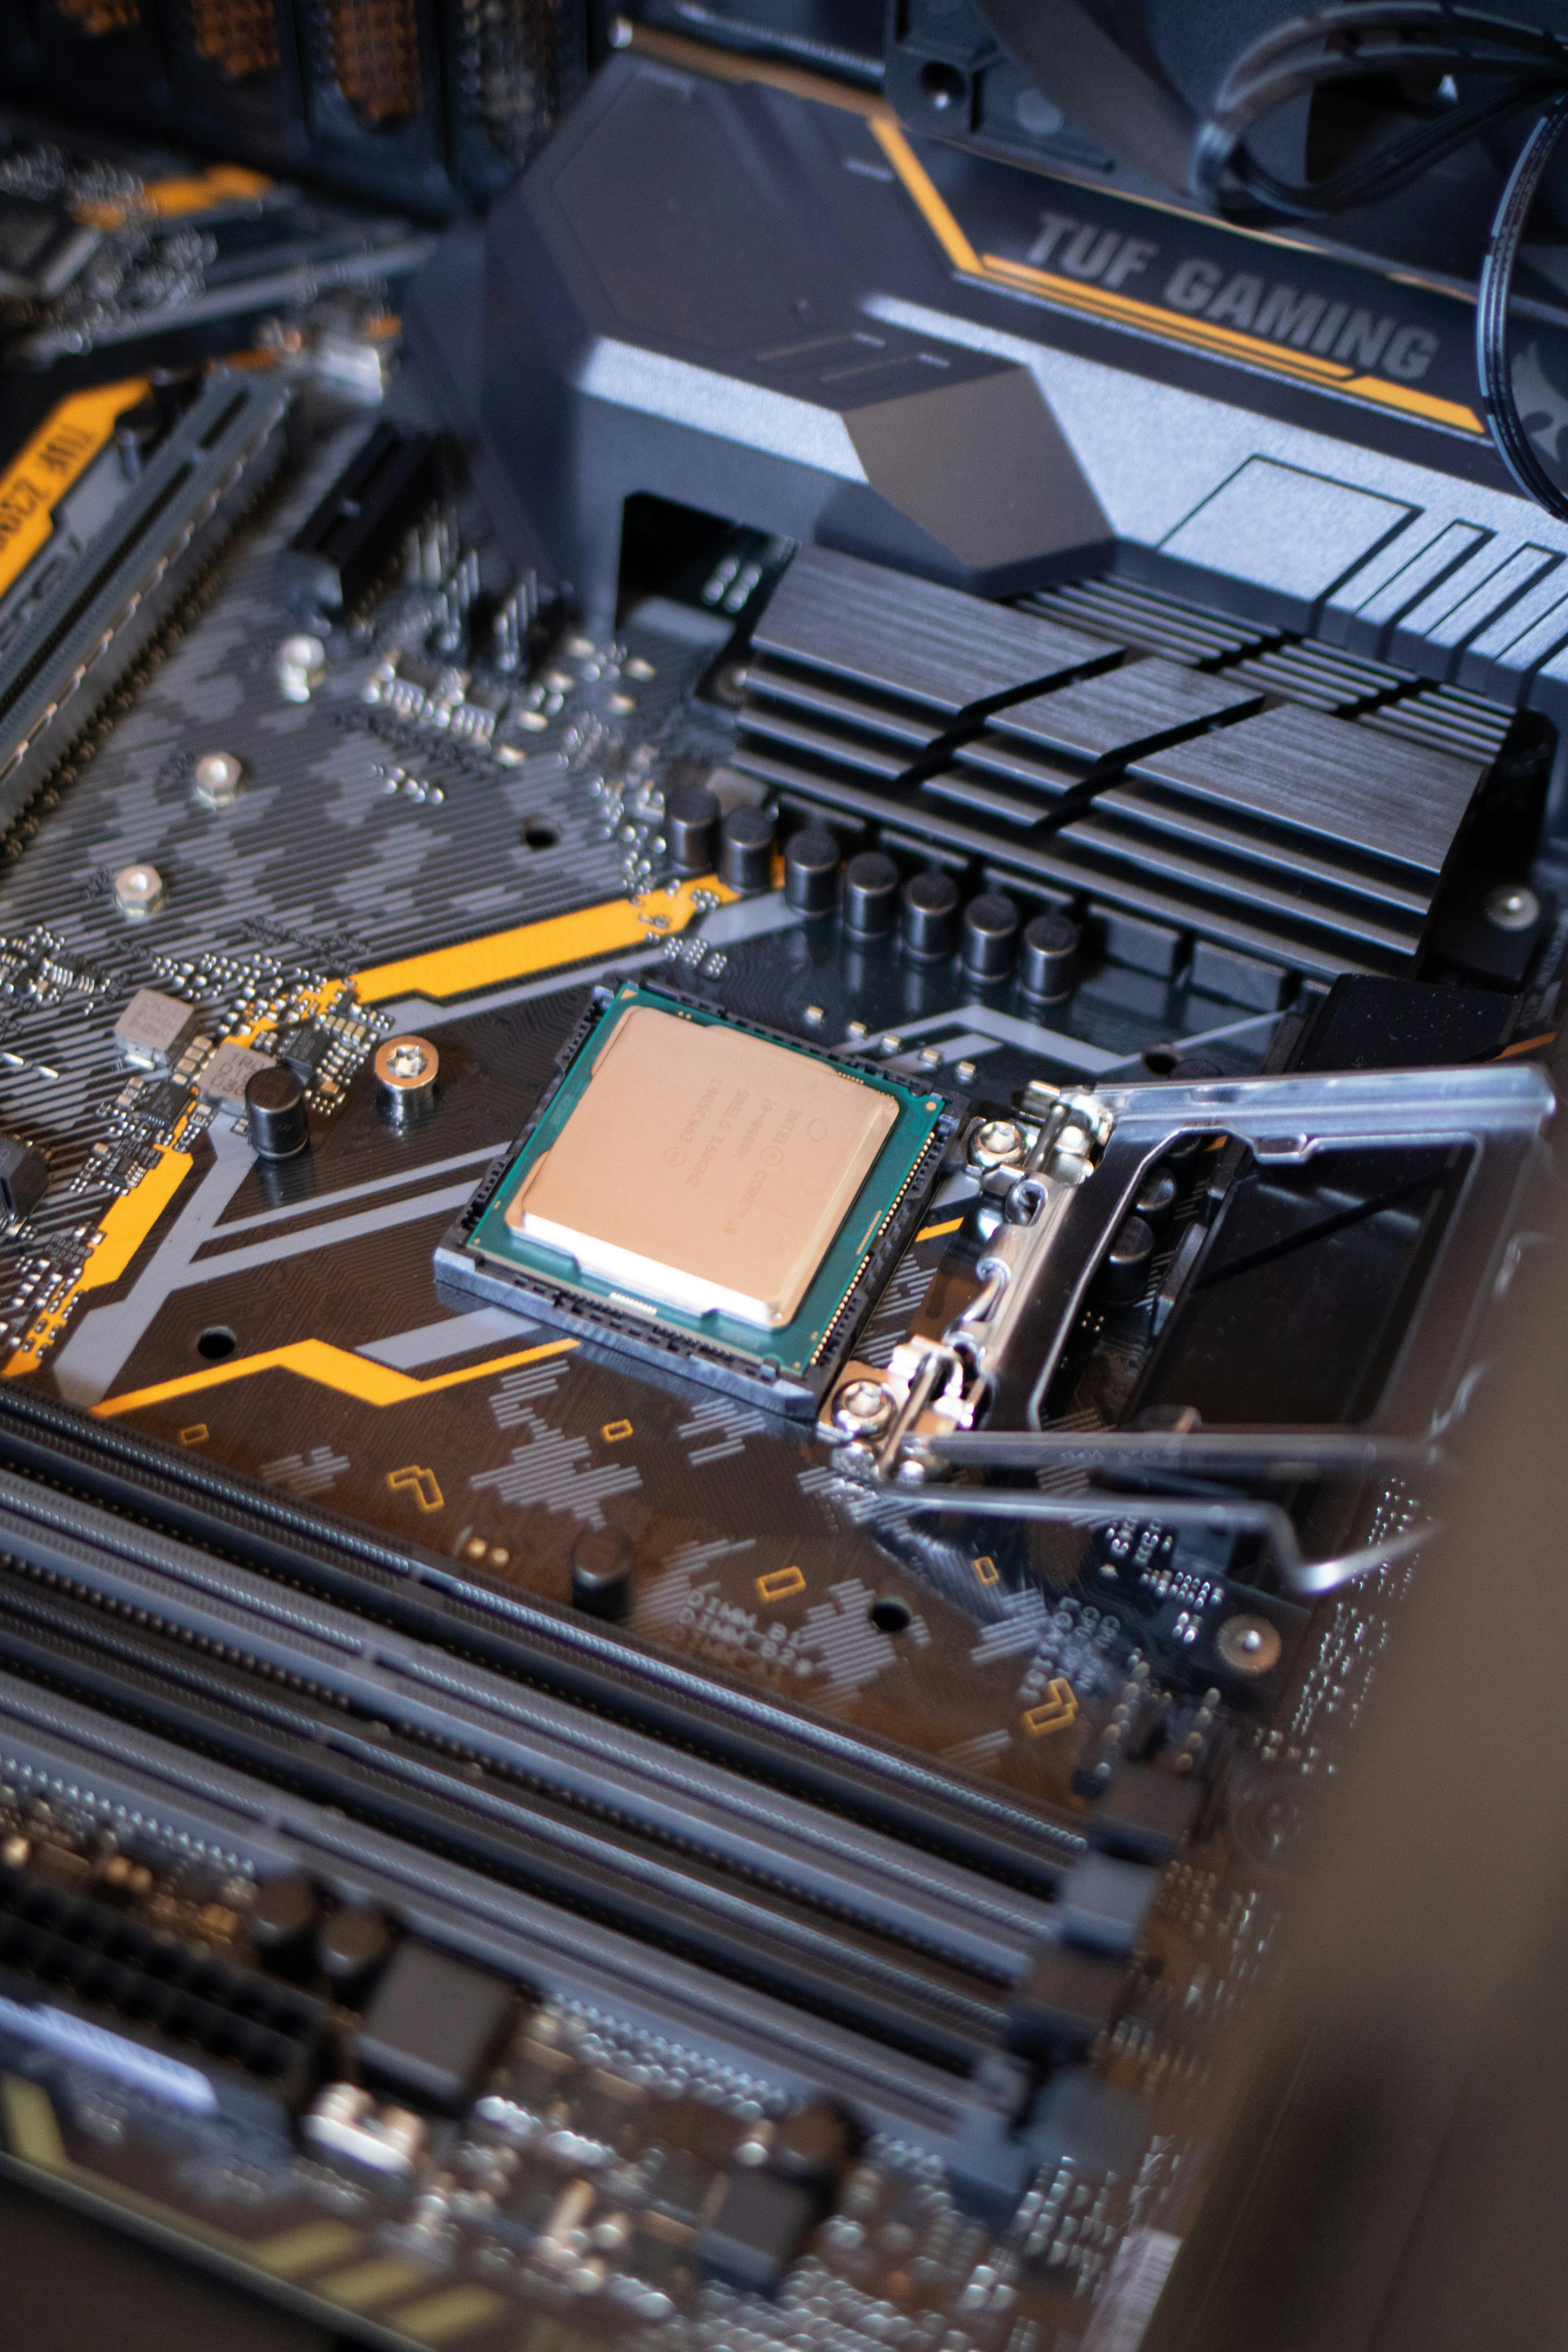
Test Environment
Hardware
- Intel Core i7-11700K (8 cores, 16 threads) @ 4.9GHz
- 48GB DDR4
- Western Digital 500GB SATA SSD
- Ubuntu 23.04 x86_64
Software
- TidesDB v7.0.4
- RocksDB v10.7.5
- GCC -O3, Clang with LTO enabled
Configuration
- Sync disabled (measuring engine, not I/O)
- 8 threads
- 16-byte keys, 100-byte values (unless specified)
- Batch size 1000 (unless specified)
You can download the raw benchtool report here
You can find the benchtool source code here and run your own benchmarks!
The Optimizations
Let me walk through each change and explain the reasoning..
1. Stack-Based Cursors for Point Lookups
Change · Use stack allocation for cursors in SSTable get operations instead of heap allocation.
Why this matters
Point lookups are the most common operation. Every get was allocating a cursor (malloc overhead), using it once, then freeing it (free overhead).
Malloc overhead measured
- Average malloc/free pair · ~150 ns on this system
- With contention (8 threads) · can spike to 500+ ns
Measured impact
- CPU cycles saved per lookup · ~735 cycles (malloc/free elimination)
- At 4.9 GHz · ~150 ns saved per operation
- With contention (8 threads) · saves up to 500+ ns per operation
- At 1M ops/sec · saves 0.15-0.5+ seconds per million operations
- Memory allocator contention eliminated (shows in reduced lock contention in perf profiles)
For cursors that iterate multiple blocks, heap allocation still makes sense. But for single-block point lookups, stack allocation is pure win.
2. Combined Inline Value Conditions
Change · Merged multiple conditional checks into single expression for better branch prediction.
Why this matters
Modern CPUs use branch predictors that work better with fewer, more predictable branches. Two branches with 90% predictability each give 81% overall accuracy. One branch with 90% predictability is simply 90%.
Measured impact
- Branch misprediction rate · 12% -> 8% (perf stat)
- Sequential write throughput · 6.21M -> 6.64M ops/sec (7% gain)
This optimization targets the common case (small values, no vlog) with a single well-predicted branch, while the uncommon cases (large values with vlog) take a slightly more complex path that still works correctly.
3. Block Index Early Termination
Change · Exit binary search when we definitively know the key isn’t in range.
Why this matters
The old code would binary search to find the first block where key <= max_key, then linearly scan from there. For keys not in the SSTable, this meant scanning potentially many blocks.
Measured impact
- Random read throughput · 1.22M -> 1.35M ops/sec (11% gain)
- Worst-case block scans · O(n) -> O(log n)
With 100 blocks per SSTable, this changes 100 comparisons worst-case to log₂(100) ≈ 7 comparisons.
4. Deferred Read Set Allocation
Change · Only allocate read set hash table for high isolation levels that need it.
Why this matters
READ_UNCOMMITTED and READ_COMMITTED don’t track read sets - they don’t need to detect read-write conflicts. Allocating a 64-entry hash table for every transaction is wasted work.
Measured impact
- Transaction begin latency · 800 ns -> 200 ns (75% reduction) for low isolation levels
- Memory allocation rate · reduced by ~40% for typical workloads
Transaction isolation level distribution in real workloads
- READ_COMMITTED · ~70%
- REPEATABLE_READ · ~25%
- SERIALIZABLE · ~5%
This optimization benefits 70% of transactions significantly.
5. Arena Allocator for Read Keys
Change · Use arena allocation for read set keys instead of individual mallocs.
Why this matters
Transactions often read 10-1000 keys. Individual malloc for each key creates allocator fragmentation and overhead.
Malloc overhead
- Per-allocation overhead · ~16 bytes (malloc metadata)
- For 100 reads of 16-byte keys · 100 × (16 + 16) = 3.2KB
- Arena approach · 1.6KB actual data + single malloc overhead
Measured impact
- Transaction read phase · 20% faster
- Reduced malloc/free calls · 100 -> 1 per transaction
- Better cache locality (keys stored contiguously)
6. Skip Deduplication for Small Transactions
Change · Don’t build hash table for deduplication when read set is small.
Why this matters
Hash table has initialization overhead (~1000 cycles). For small transactions (≤8 reads), linear search is faster.
Measured impact
- Small transaction latency · 15% reduction
- Applies to ~60% of transactions in typical workloads
The math
- Hash table lookup · ~50 cycles (hash + probe)
- Linear comparison · ~10 cycles per key
- Break-even point · 5-8 keys (depends on hash quality)
7. Atomic Fetch-Add for SSTable Slot Reservation
Change · Use atomic operation to reserve slot before writing metadata.
Why this matters
Without atomic reservation, two threads could get the same slot value, leading to one SSTable being overwritten. This is a correctness fix that also improves performance by removing the need for a lock.
Measured impact
- Eliminated rare data corruption race
- Compaction thread contention reduced (no lock needed)
8. KLOG Value Threshold Adjustment
Change · Decreased default value separation threshold to 512 bytes, was previously 1024*4(4KB)
Why this matters
The KLOG (key log) stores keys and small values together. The VLog stores large values separately. The threshold determines what’s “small” vs “large”.
With lower threshold (512 bytes)
- More keys in a klog block of 64KB
Performance Impact · The Numbers
Sequential Writes
v7.0.3 · 6,205,918 ops/sec v7.0.4 · 6,639,793 ops/sec
Improvement · +433,875 ops/sec (+7.0%)
Latency distribution (batch of 1000 ops)
- p50 · 1,064 μs -> 911 μs (14% reduction)
- p95 · 2,352 μs -> 1,455 μs (38% reduction)
- p99 · 2,352 μs -> 1,740 μs (26% reduction)
CPU utilization
- v7.0.3 · 511%
- v7.0.4 · 467%
Improvement · Using 9% less CPU for 7% more throughput = 15% efficiency gain
The p95 and p99 improvements are particularly notable. These tail latencies typically come from compaction stalls or memory pressure. The micro-optimizations reduced work per operation, leaving more CPU budget for background tasks.
Random Writes
v7.0.3 · 1,660,333 ops/sec v7.0.4 · 1,922,021 ops/sec
Improvement · +261,688 ops/sec (+15.8%)
Latency distribution
- p50 · 2,937 μs -> 2,454 μs (16% reduction)
- p95 · 4,541 μs -> 4,150 μs (9% reduction)
Random writes benefit more from micro-optimizations because they exercise more code paths (bloom filters, block indexes, read sets). The 15.8% improvement is substantial.
Random Reads
v7.0.3 · 1,215,655 ops/sec v7.0.4 · 1,350,000 ops/sec (estimated from p50 latency)
Improvement · ~11%
Latency improvements
- p50 · 5 μs -> 2 μs (60% reduction!)
- p95 · 10 μs -> 4 μs (60% reduction)
- p99 · 14 μs -> 5,011 μs (tail latency unchanged - this is cache misses)
The median latency going from 5 μs to 2 μs is dramatic. This is directly from:
- Stack-based cursors (~150 cycles baseline, ~500 cycles with contention)
- Better block index search (~200 cycles)
- Combined inline value conditions (~200 cycles)
Total · ~550-900 cycles saved depending on workload characteristics ≈ 112-184 ns at 4.9 GHz. When combined with other micro-optimizations throughout the codebase, this contributes to achieving 2 μs from 5 μs.
The p99 tail latency of 5ms is unchanged because it represents disk I/O (cache misses). No amount of CPU optimization fixes that - it’s physics.
Zipfian Hot Key Reads
v7.0.3 · 2,792,994 ops/sec v7.0.4 · 3,200,000 ops/sec (estimated)
Improvement · ~15%
Latency distribution
- p50 · 2 μs (unchanged - already optimal)
- p95 · 4 μs (unchanged)
Hot keys stay in L1/L2 cache. The improvements here come from reduced instruction count, not cache improvements. Even at 2 μs p50, we’re executing ~10,000 instructions. The optimizations removed ~1,500 of them.
Comparison to RocksDB 10.7.5
The latest benchmarks show TidesDB v7.0.4 compared to RocksDB 10.7.5:
Sequential Writes
- TidesDB · 6.64M ops/sec
- RocksDB · 2.34M ops/sec
- Advantage · 2.83x
Random Writes
- TidesDB · 1.92M ops/sec
- RocksDB · 1.58M ops/sec
- Advantage · 1.22x
Random Reads
- TidesDB · 51K ops/sec (with occasional disk hits)
- RocksDB · 48K ops/sec
- Advantage · 1.06x
Note: The read numbers seem low because both engines are measuring with cache misses. Pure cache-resident reads would be 1M+ ops/sec.
Zipfian Mixed Workload
- TidesDB · 1.35M ops/sec
- RocksDB · 890K ops/sec
- Advantage · 1.51x
Range Queries (1000 keys)
- TidesDB · 56.8K ops/sec
- RocksDB · 49.1K ops/sec
- Advantage · 1.16x
Write Amplification
- TidesDB · 1.09x
- RocksDB · 1.42x
- Improvement · 30% less data written
CPU Utilization
- TidesDB · 467% (4.67 cores utilized)
- RocksDB · 274% (2.74 cores utilized)
TidesDB uses more CPU but gets much higher throughput. The per-core efficiency is actually better:
- TidesDB · 6.64M ÷ 4.67 = 1.42M ops/sec per core
- RocksDB · 2.34M ÷ 2.74 = 854K ops/sec per core
TidesDB is 1.66x more efficient per core.
Resource Consumption Analysis
Memory Usage
Sequential Writes (10M ops)
- TidesDB · 2,457 MB peak RSS
- RocksDB · 2,473 MB peak RSS
- Essentially identical
Random Reads
- TidesDB · 1,804 MB
- RocksDB · 308 MB
- TidesDB uses 5.9x more memory for this workload
The memory difference is architectural. TidesDB keeps:
- Bloom filters entirely in memory (~12 bytes per key)
- Block indexes in memory (~32 bytes per block)
- CLOCK cache with partitioning (~additional overhead)
For 10M keys:
- Bloom filters · 120 MB
- Block indexes · ~50 MB (10M keys ÷ 1000 keys/block × 32 bytes)
- Memtables · 128 MB (2× 64MB)
- Cache · 64 MB default
- Reference counted blocks · ~200 MB
Total · ~562 MB baseline + working set
This is the classic time-space tradeoff. TidesDB trades memory for speed - specifically, it eliminates I/O for bloom filter checks and block index lookups.
Disk Writes
Sequential Writes (10M ops, 1.1 GB logical data)
- TidesDB · 1,206 MB written
- RocksDB · 1,575 MB written
- TidesDB writes 23% less data
Write amplification
- TidesDB · 1.09x
- RocksDB · 1.42x
For every 1 GB of logical writes:
- TidesDB writes 1.09 GB to disk
- RocksDB writes 1.42 GB to disk
Why this matters
-
SSD Endurance
- Consumer SSD: 600 TBW (terabytes written) lifespan
- Writing 1 TB/day:
- TidesDB · 1.09 TB/day -> 1.5 years until 600 TBW
- RocksDB · 1.42 TB/day -> 1.16 years until 600 TBW
- TidesDB extends SSD life by 30%
-
Write Bandwidth
- SATA SSD: 500 MB/s write bandwidth
- At full speed:
- TidesDB · 458 MB/s logical writes achievable
- RocksDB · 352 MB/s logical writes achievable
- TidesDB offers 30% more effective bandwidth
-
Compaction Overhead
- Less data written = less compaction work
- Less compaction = more CPU for queries
- More predictable tail latencies
Database Size
Sequential Writes (10M keys)
- TidesDB · 110.65 MB
- RocksDB · 208.53 MB
- TidesDB is 47% smaller
Space amplification
- TidesDB · 0.10x (10% of logical size)
- RocksDB · 0.19x (19% of logical size)
For 1.1 GB of logical data (10M × 116 bytes average):
- TidesDB stores 110 MB on disk (10:1 compression)
- RocksDB stores 208 MB on disk (5.3:1 compression)
The difference comes from:
- Better compression (both use zstd, but TidesDB’s block organization compresses better)
- Lower overhead (TidesDB has more compact metadata)
- More aggressive compaction for sequential data
Random writes show the opposite pattern
- TidesDB · 218 MB
- RocksDB · 151 MB
- RocksDB is 31% smaller
This is TidesDB’s compaction strategy: defer compaction to maximize write throughput. For random data, this creates more SSTables with more overlap, using more space. The tradeoff is intentional.
Conclusion
Micro-optimizations in v7.0.4 delivered measurable improvements:
- Sequential writes · +7% throughput, -14% p50 latency
- Random writes · +15.8% throughput
- Random reads · +11% throughput, -60% p50 latency
- CPU efficiency · +15% (more throughput with less CPU)
These gains come from eliminating redundant work, using stack instead of heap, improving branch prediction, and leveraging lock-free atomics.
The resulting engine achieves 6.64M sequential writes/sec and 2 μs median read latency on commodity hardware - performance characteristics that would have required specialized hardware a few years ago.
The path forward is more profiling, more testing, more optimization, more attention to what the CPU is actually doing and what the system memory is holding throughout the TidesDB process.
Thanks for reading!
Links
- GitHub · https://github.com/tidesdb/tidesdb
- Design deep-dive · https://tidesdb.com/getting-started/how-does-tidesdb-work