
Keybench Analysis on TidesDB v10.0.0 and RocksDB v11.8.1

published on September 3rd, 2026
Back to engine analysis after a development-heavy stretch. Today I go over data from extensive keybench analysis comparing latest releases TidesDB v10.0.0 with RocksDB v11.8.1 on a small and large server.
Should you be unaware keybench is a scriptable performance tool for sorted key value stores. You write the workload in Lua, it drives the same script against every engine, times each operation, and reports throughput and a latency distribution per operation kind. The harness spawns the worker threads and never holds a lock around an engine call, so a serialized engine reports as serialized. Every result below can be replayed from the config file that ships beside it.
This is a defaults comparison, deliberately. You build and install both libraries, you use them as they come, and this is what you get. Neither engine is tuned, and the one setting that is touched, compression, is turned off on both because the bundled workloads store a repeated byte that LZ4 shrinks by about 58x, which would make a nominally 10 GiB dataset land at 180 MB on disk. Everything else is whatever the library ships with. Where those defaults differ in kind, and the important one is that TidesDB separates large values by default while RocksDB’s BlobDB is off, that difference is part of what is being measured, not a variable to be controlled away.
There is one deliberate exception, run precisely because that difference is the obvious objection. The value size sweep was repeated on the large server with RocksDB’s BlobDB switched on and configured to match TidesDB’s separation threshold, which gives a third arm and its own section below.
tl;dr
Five workloads at 10 GiB each, on two machines, a small server on SATA and a large server on NVMe with isolated CPUs, plus a third arm on one sweep with RocksDB’s BlobDB switched on. TidesDB is ahead almost everywhere. The parts worth reading closely are where the two machines disagree, and where turning BlobDB on does not do what you would expect.
- TidesDB seeds a 10 GiB dataset 2x to 10x faster than RocksDB. That is the largest and cleanest difference in the whole run.
- On the small server TidesDB wins 29 of 30 cells with a median ratio of 3.8x. On the large server it wins 48 of 50 with a median of 1.82x. The gap narrows on the bigger machine, though the two runs differ in more than hardware.
- Write amplification is 2.5x to 5.4x lower for TidesDB. Its compaction is nearly free but its value log appends every version, so the advantage in total bytes written is smaller than the tree sizes suggest.
- Much of the write path advantage is key value separation, which TidesDB does by default and RocksDB, through BlobDB, does not. That is the defaults differing and it is the point of the exercise, not a flaw in it.
- Turning BlobDB on for RocksDB was run as a third arm on the value size sweep. It cuts RocksDB’s write amplification by 1.52x and does not close the throughput gap, helping at 4 KB and 64 KB and hurting at 256 KB. TidesDB stays ahead at every point.
- The largest small server ratios come from RocksDB stalling on its own default L0 triggers. On NVMe it mostly stops stalling and those ratios collapse.
- TidesDB had five wildly variable cells on the small server, the worst spreading 26x across identical repeats. None reproduce on the large server, which is a host tuned to remove variance. That is consistent with the environment causing it and does not prove it, since the two machines differ in more than a dozen ways at once. I do not know the cause.
Before the numbers
Every one of these results is shaped by how the runs were configured, so this comes first, not as a footnote.
Both arms on both machines are the median of three runs. That matters more than it sounds. RocksDB was first measured at one run per cell, and rerunning it with three repeats against the identical binary moved its numbers down in most cells, because the single runs had been slightly lucky. A benchmark that reports one arm more carefully than the other is not comparing engines, it is comparing sample sizes.
The runs are bounded by time, not by work. Each cell runs 60 seconds, so the faster engine performs more operations in that window. That is fine for throughput and it muddies latency. On the small server mixed workload TidesDB issued about twice the puts and twice the deletes RocksDB did and hollowed out the keyspace faster, so its get hit rate fell to 81.6% against RocksDB’s 92.5%. A miss is cheaper than a hit, so its read latencies are flattered by that.
Compression is the only knob touched in the main comparison, and it is off on both. RocksDB v11.8.1 defaults to LZ4 and TidesDB v10.0.0 defaults to none, so leaving both alone would have had one compressing and the other not. Turning it off on both is also what makes 10 GiB on the command line mean 10 GiB on the drive, for the reason given above. The cost is that neither engine’s compression path is measured here. The BlobDB arm on the value size sweep is the one place anything else is set, and it is kept separate from the defaults result for that reason.
The two machines
| small server | large server | |
|---|---|---|
| CPU | i7-11700K, 16 cores | i9-13900, 24 cores, 8 P plus 16 E, SMT off |
| cores the run could use | all 16 | 8, the isolated P-cores |
| RAM | 46.8 GiB DDR4 | 125.5 GiB DDR5, no ECC |
| storage | SATA SSD, ext4, shared with the OS | NVMe Micron 7450, xfs, separate from the OS disk |
| threads swept | 1, 16, 64 | 1, 2, 4, 8, 16 |
| CPU placement | left to the scheduler | 8 P-cores, isolated and pinned |
| seeding | seed once, reused across cells | reseeded for every cell |
| seed threads | 16 | 8 |
| compiler | gcc 12.3.0 | gcc 13.3.0 |
| allocator | jemalloc, linked ahead of both engines | same |
Read that core row carefully, because the headline counts point the wrong way. The large server has more cores but the benchmark was confined to eight of them, the isolated P-cores, while the small server had all sixteen of its own. So the larger machine ran the sweep on half the cores. That matters at 16 threads, which fits inside the small server’s cores and oversubscribes the large server’s two to one.
The large server’s benchmark disk is worth a note of its own, since storage is where most of the difference between these two machines lives. It is a single Micron 7450 with no RAID of any kind, hardware or software, so nothing sits between the engine and the device. It is not the OS disk, which is a separate Samsung drive, so background system IO does not land on the drive being measured. It runs xfs mounted noatime and nodiratime with the IO scheduler set to none, and it was formatted to 4096 byte sectors, which the drive reports as its best performing LBA format and which matches the page size both engines write in. The link negotiated PCIe Gen4 x4 at full width. Health at run time was 1% used, no media errors, no thermal throttle events, at 35 C.
Measured with fio and O_DIRECT before the run, that device does 6230 MB/s sequential read, 321,267 random 4K read IOPS at QD64 across four jobs, and 7,467 4K write plus fsync IOPS at QD1 with 135 us fsync latency. The small server’s SATA SSD is roughly an order of magnitude behind on every one of those, and it also holds the operating system.
The workloads, the dataset sizes and the engine configuration are identical on both. Same 2621440 items for mixed, scan and batch, same 556570 users for cart, same 40960 items for valsize, compression off on both engines and nothing else touched. Both are the median of three runs of 60 seconds.
What differs is more than the hardware. The thread sweeps overlap only at 1 and 16. The large server pins workers and the small one does not. The small server seeds once per engine and reuses that store across the whole sweep, so every cell after the first runs against a store the earlier ones churned, while the large server rebuilds the dataset for every cell and measures a fresh store each time. The small server seeded with 16 threads and the large with 8. So when the numbers below differ between machines, the storage is one candidate among five and I try to say which.
The placement difference is not cosmetic. The large server boots with
isolcpus=0-15, so those CPUs sit outside scheduler load balancing. Hand several
of them to a process with taskset and every thread stays on whichever CPU the
parent landed on, so the run quietly uses one core no matter how many threads you
asked for, with no error and no warning. Throughput goes flat across the thread
sweep and latency rises in proportion to thread count, which reads exactly like an
engine that does not scale. Measured on keybench’s reference skiplist, scan at 8
threads gave 565 wu/s unpinned against 4500 pinned. The large server runs
therefore pin worker t to the t-th CPU of the set the process inherited. Anyone
benchmarking on an isolated CPU host should check for this before believing a
scaling curve. cat /sys/devices/system/cpu/isolated answers it, and an empty
result means pinning is optional, not mandatory.
One caveat carries into the results. --pin places keybench’s own worker and seed
threads, and it does not place the engines’ internal flush and compaction threads,
which inherit the mask and therefore pile onto a single isolated CPU. At 8 threads
that was observed as six unpinned engine threads sharing one core while each worker
had a core to itself. It applies to both engines equally so it should not bias the
comparison, but it is a plausible contributor to the throughput regression both
engines show at 16 threads, and it has not been isolated.
The workloads
Five workloads, 10 GiB of user data each, 4096 byte values unless stated. Every cell on both engines is the median of three runs of 60 seconds.
- mixed ⚬ a uniform random blend of 50% get, 30% put, 10% delete and 10% short range scan of 100 keys. A plain baseline with no business logic in it.
- cart ⚬ an Amazon style shopping cart. One key per line item under a per user prefix, so viewing a cart is a single range scan. Traffic skews toward hot users, which is the point, since it is the only workload here with locality.
- scan ⚬ the streaming range read. Each unit scans 1000 rows through a callback and builds no intermediate structure.
- batch ⚬ multi key get and put sweeping 1, 64 and 256 keys per call. The amortization curve, and the workload that stresses write admission hardest.
- valsize ⚬ the mixed blend across a value size sweep of 256 B, 4 KB, 64 KB and
256 KB.
itemsis fixed across a sweep, so only the 256 KB point is a 10 GiB dataset. 64 KB is 2.5 GiB, 4 KB is 160 MB and 256 B is 10 MB. Read the small points as memory resident.
How seeding works, and why it is worth reporting
Before any cell is timed the store has to be filled, and keybench treats that as a
first class phase, not as setup to be hidden. A workload’s load function
runs on every worker thread at once, each thread filling the slice of the keyspace
it owns, grouping writes into batches so a large seed commits as one engine write
rather than one write per key. The seed is sampled once a second like the timed
phase, so the ingest rate below is the average of those samples and not a total
divided by a duration. The difference matters because the curve is not a straight
line, as the figure shows.
The two machines chose differently here. The small server seeds once per engine and reuses that store across the whole sweep, which trades a fresh dataset per cell for a great deal of wall clock. The large server reseeds for every cell, so it built the dataset 15 times for mixed and 45 times for batch. Both are fair across engines since both engines get the same treatment, but they measure different things. The small server measures a store that earlier cells churned and the large server measures a fresh one.
Seeding turns out to be where the two engines differ most.
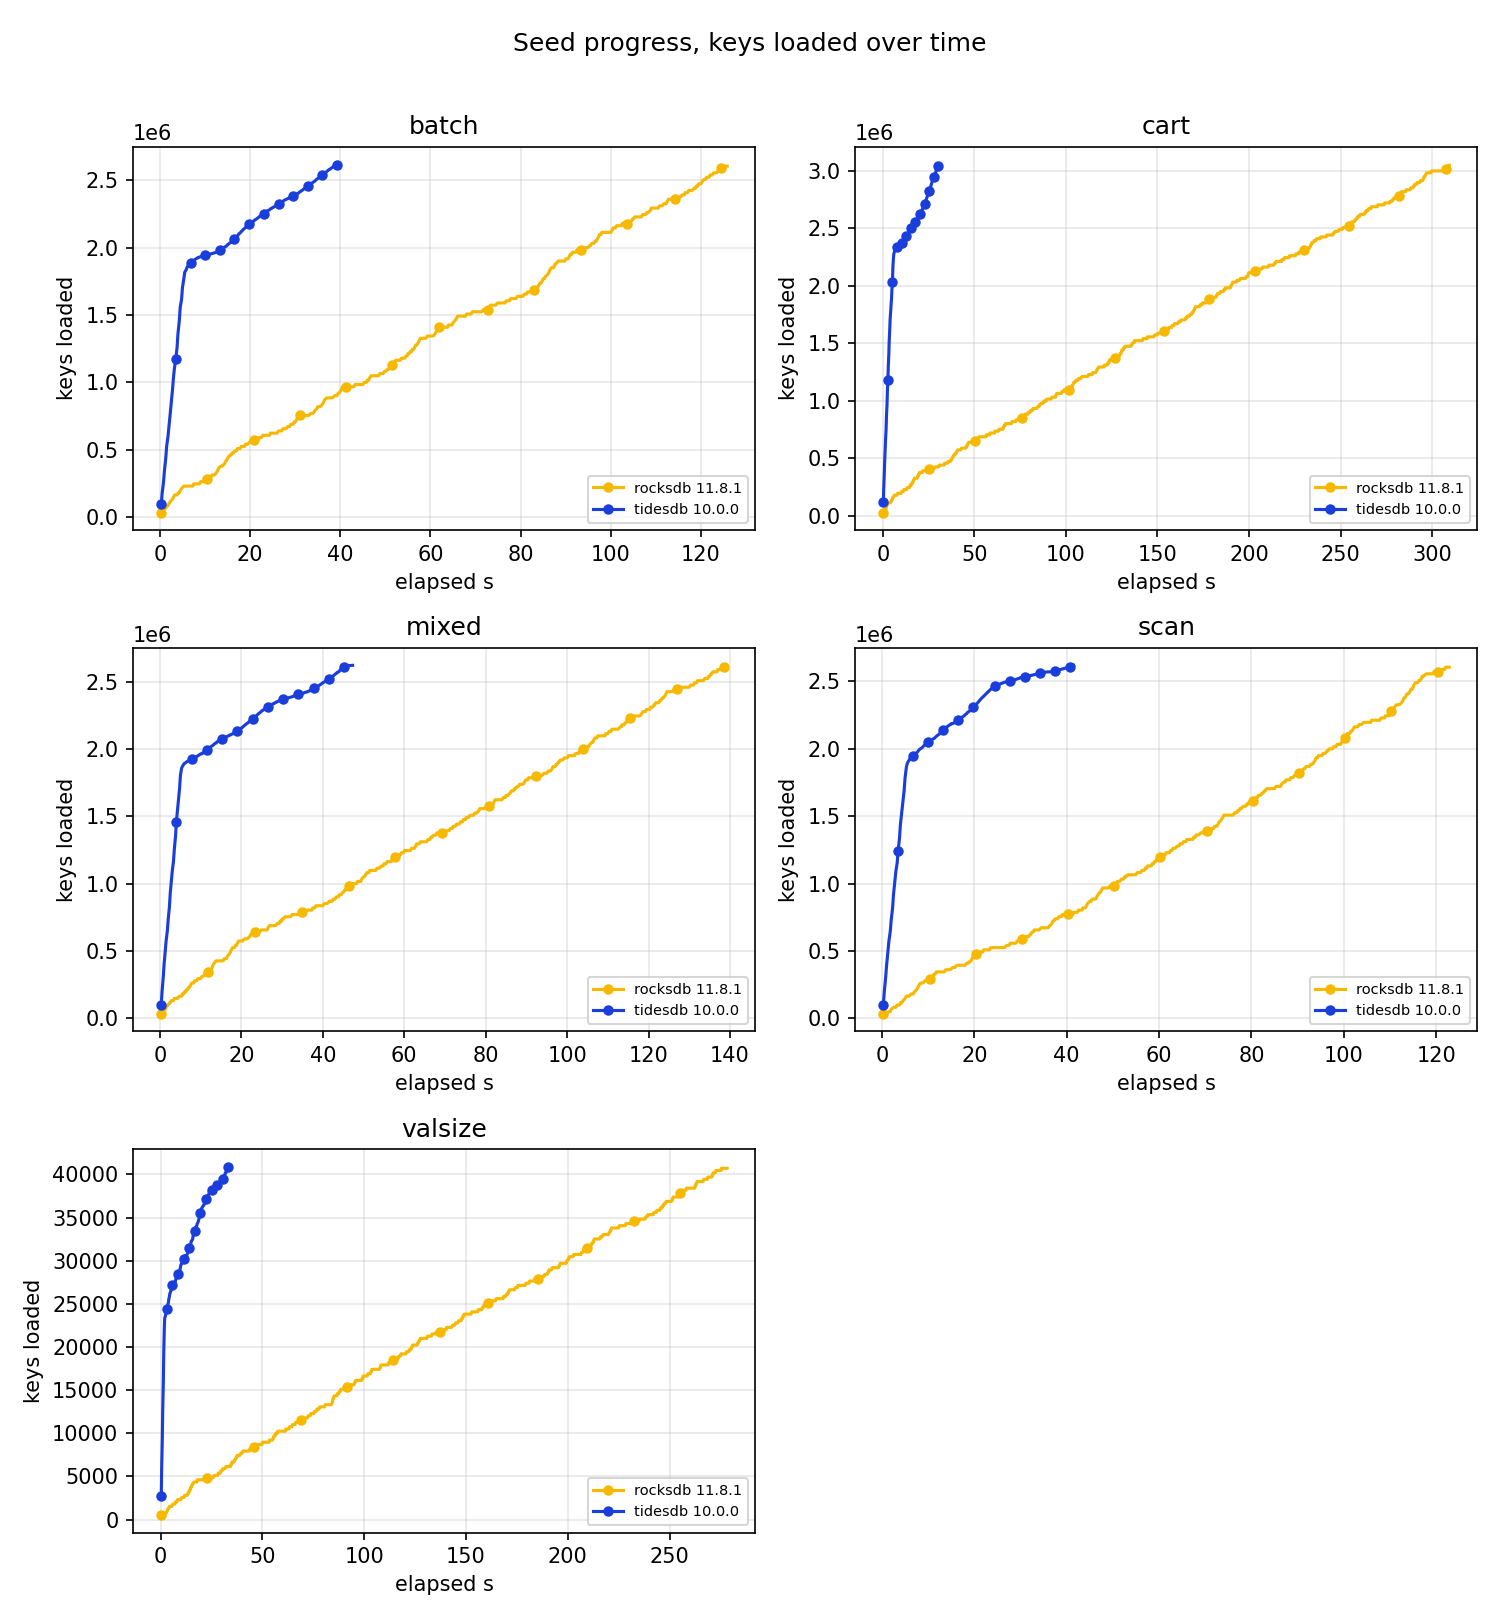
The shapes differ as much as the totals. TidesDB rises almost vertically for the first few seconds, taking roughly 1.9 million of the 2.6 million keys before the curve bends, then finishes at a steadier rate. RocksDB is close to linear from start to end. Note the x axes, which are not shared. RocksDB needs 300 seconds for cart where TidesDB needs 30.
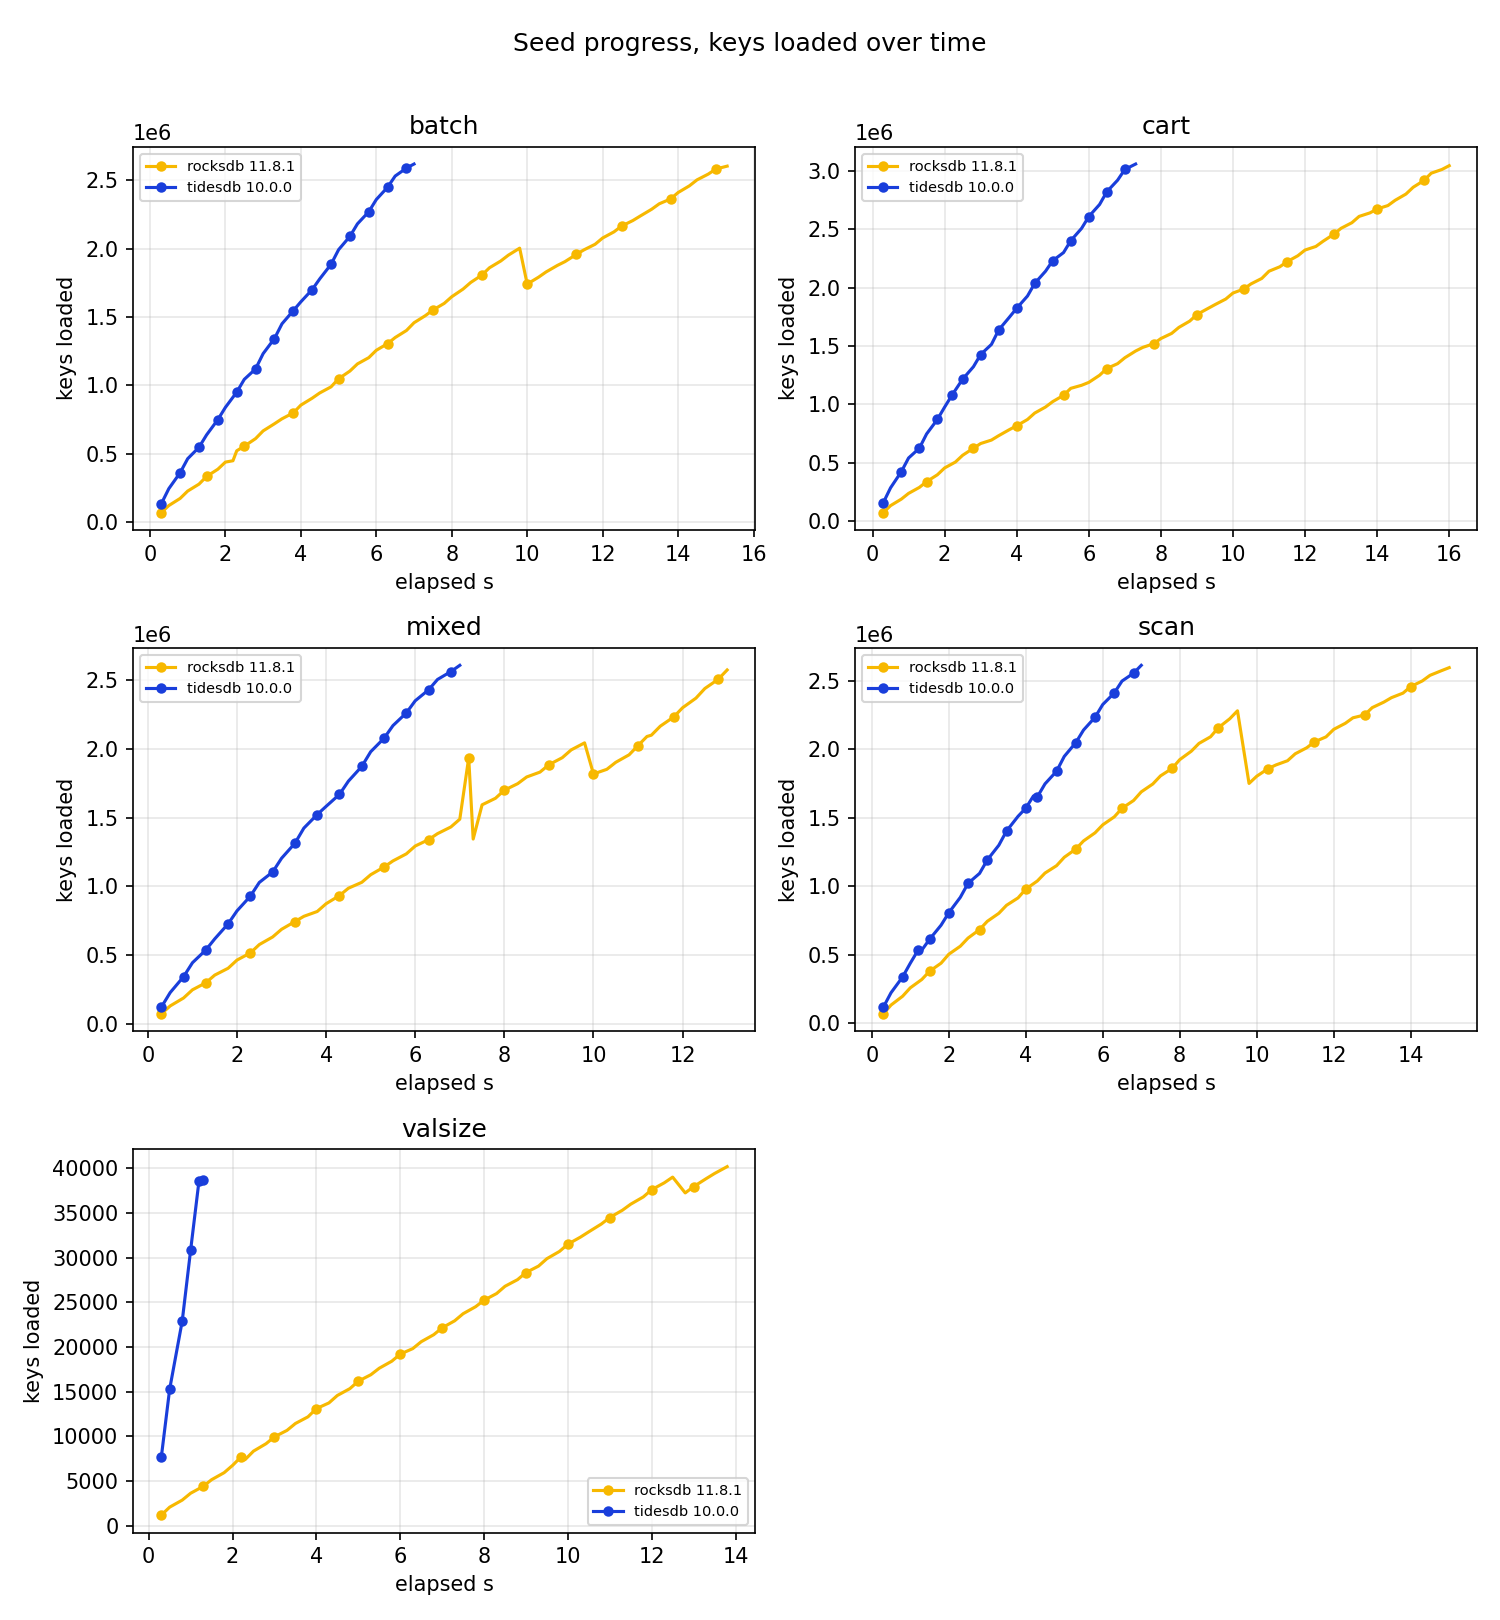
On the large server both curves compress into a few seconds and the shapes converge, which is the same story the totals tell.
| machine | workload | RocksDB | TidesDB | TidesDB faster by |
|---|---|---|---|---|
| small | mixed | 139 s | 47 s | 3.0x |
| small | cart | 309 s | 31 s | 10.0x |
| small | scan | 123 s | 42 s | 2.9x |
| large | mixed | 15 s | 7 s | 2.1x |
| large | cart | 16 s | 7 s | 2.3x |
| large | scan | 15 s | 7 s | 2.1x |
On the small server, filling the cart dataset took RocksDB five minutes and TidesDB half a minute. In ingest terms that is 39 MB/s against 386 MB/s. On the large server both engines are far quicker and the ratio narrows to about 2x, with TidesDB sustaining roughly 1460 MB/s against 700 MB/s.
Bulk load is not the same thing as steady state throughput and I would not present it as such. It earns its own row because loading data is a real operation that people wait on, and because a 10x difference on one machine and a 2x difference on another says a good deal about how much of the small server result is the device.
Throughput
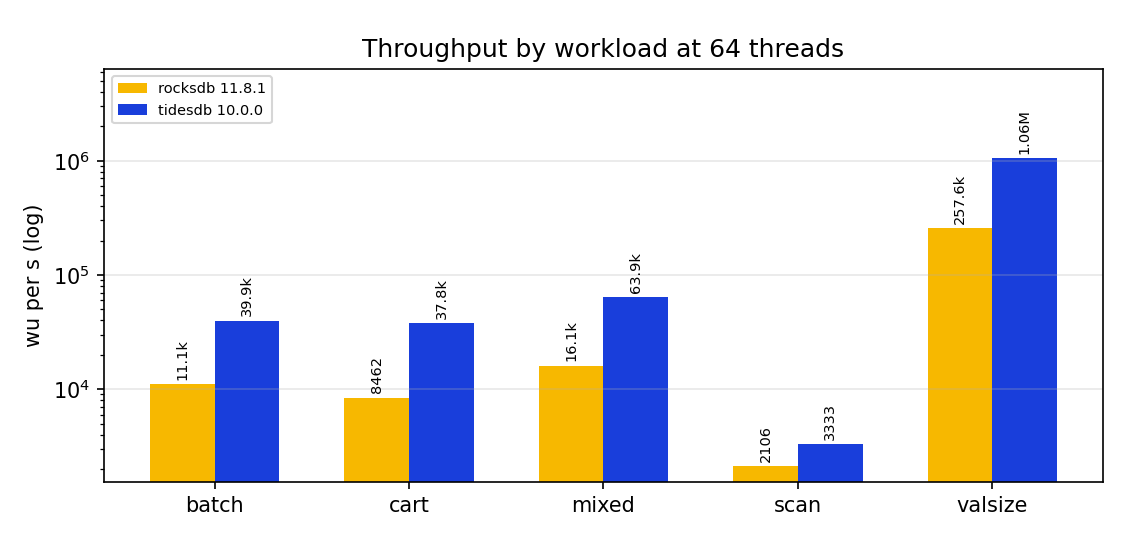
Note the log scale. Workload units are not comparable across workloads, since a scan unit reads a thousand rows while a valsize unit at 256 B touches one small value, so read the gap between the two bars within each workload rather than the height of one workload against another.
Small server at 64 threads.
| workload | RocksDB | TidesDB | ratio |
|---|---|---|---|
| mixed | 16,129 | 63,858 | 3.96x |
| cart | 8,462 | 37,799 | 4.47x |
| scan | 2,106 | 3,333 | 1.58x |
| batch, 1 key calls | 11,079 | 39,938 | 3.60x |
| valsize, 256 B | 257,556 | 1,055,330 | 4.10x |
Across all 30 small server cells the median ratio is 3.8x, the minimum 1.24x on scan at one thread and the maximum 77x on batch.
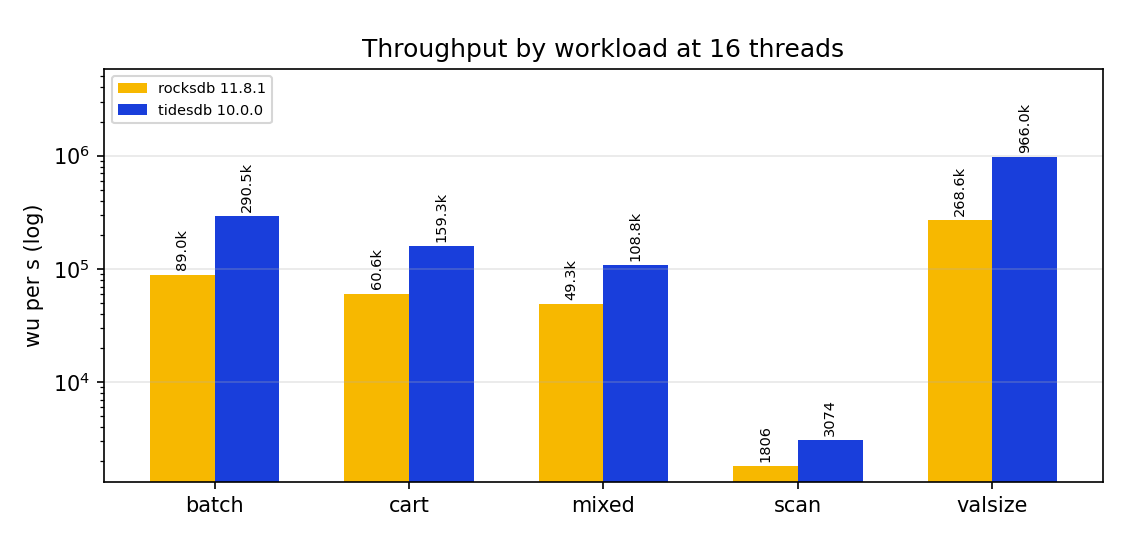
The large server is a narrower result. TidesDB wins 48 of 50 cells with a median of 1.82x and a range of 0.91x to 3.60x. The two it does not win are cart at one and two threads.
Those two medians are not directly comparable, since they are taken over different thread counts. Restricting both to the 20 cells the machines actually share, at 1 and 16 threads, gives 3.13x on the small server against 1.77x on the large one. The narrowing is real and survives the control, so the summary holds. What I cannot do is attribute it cleanly to the storage, because the large server also pins its workers and reseeds every cell.
Throughput over time
A median hides shape, so keybench samples throughput once a second. These are those samples at the top of each thread sweep, and the two machines look nothing alike.
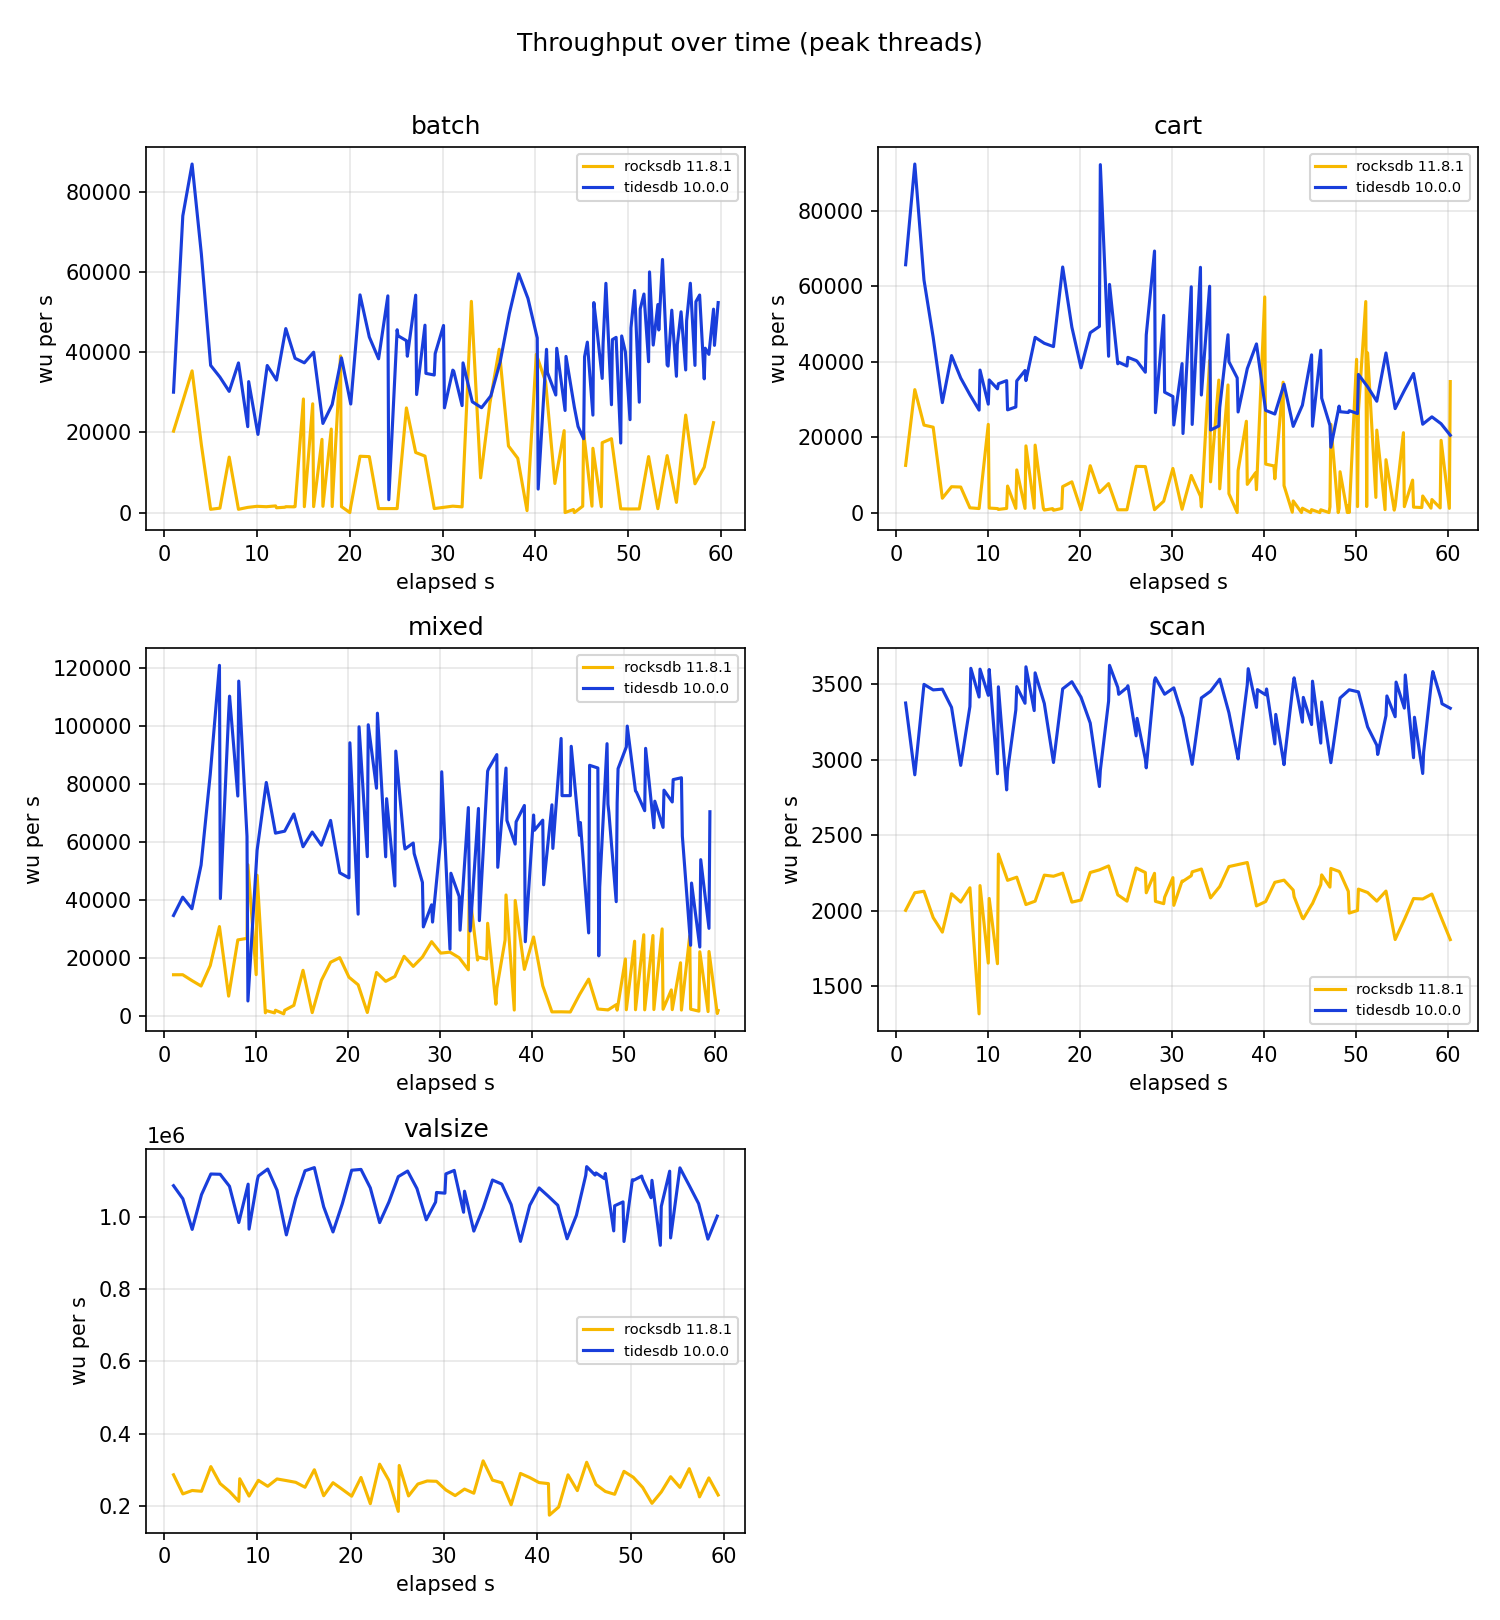
On the small server the RocksDB line falls to zero and stays there for seconds at a stretch, repeatedly, on batch, cart and mixed. Those flat sections at zero are the write stall from the previous section, seen from the outside as throughput instead of from RocksDB’s own counters. Its scan and valsize lines, which are read heavy, stay level. TidesDB is noisy on the write heavy workloads too but does not floor out.
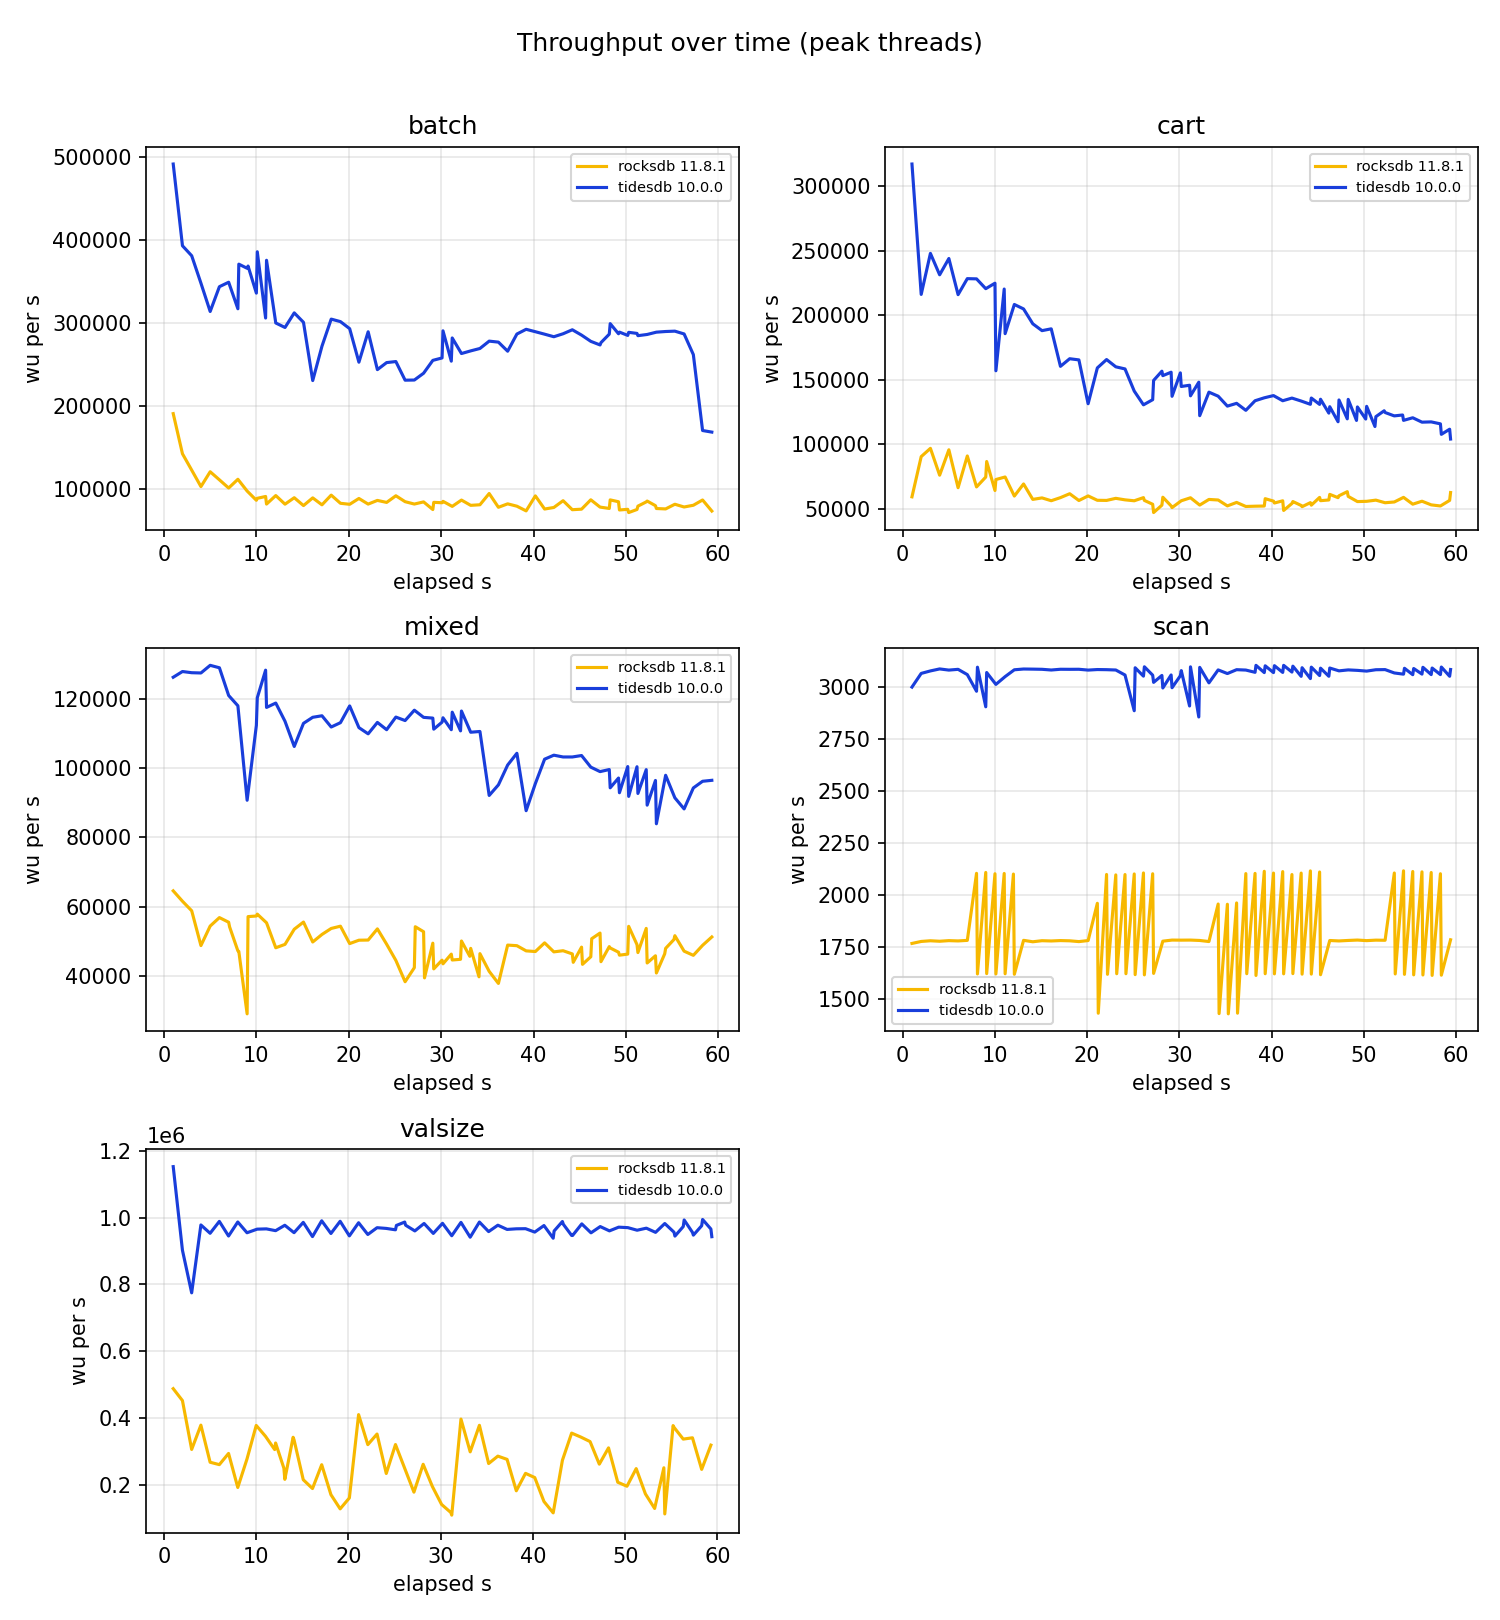
On the large server nothing floors out on either engine. Both start high and decay as the store fills and compaction begins, which is expected. The texture is what is left to read. TidesDB holds close to flat lines on scan and valsize, around 3050 wu/s and 0.96M wu/s, while RocksDB sawtooths on both, oscillating between 1750 and 2100 on scan and between 0.1M and 0.4M on valsize. That is compaction interfering with the foreground path.
On batch TidesDB decays from 490k to about 290k over the first thirty seconds and then holds, while RocksDB falls to about 80k early and stays there. On mixed both decay across the minute, TidesDB from 130k to 95k and RocksDB from 65k to 50k.
Neither machine reaches a true steady state in 60 seconds. A longer run would tell a different and probably less flattering story for both engines, and that is a gap in this article, not a property of the engines.
Scaling
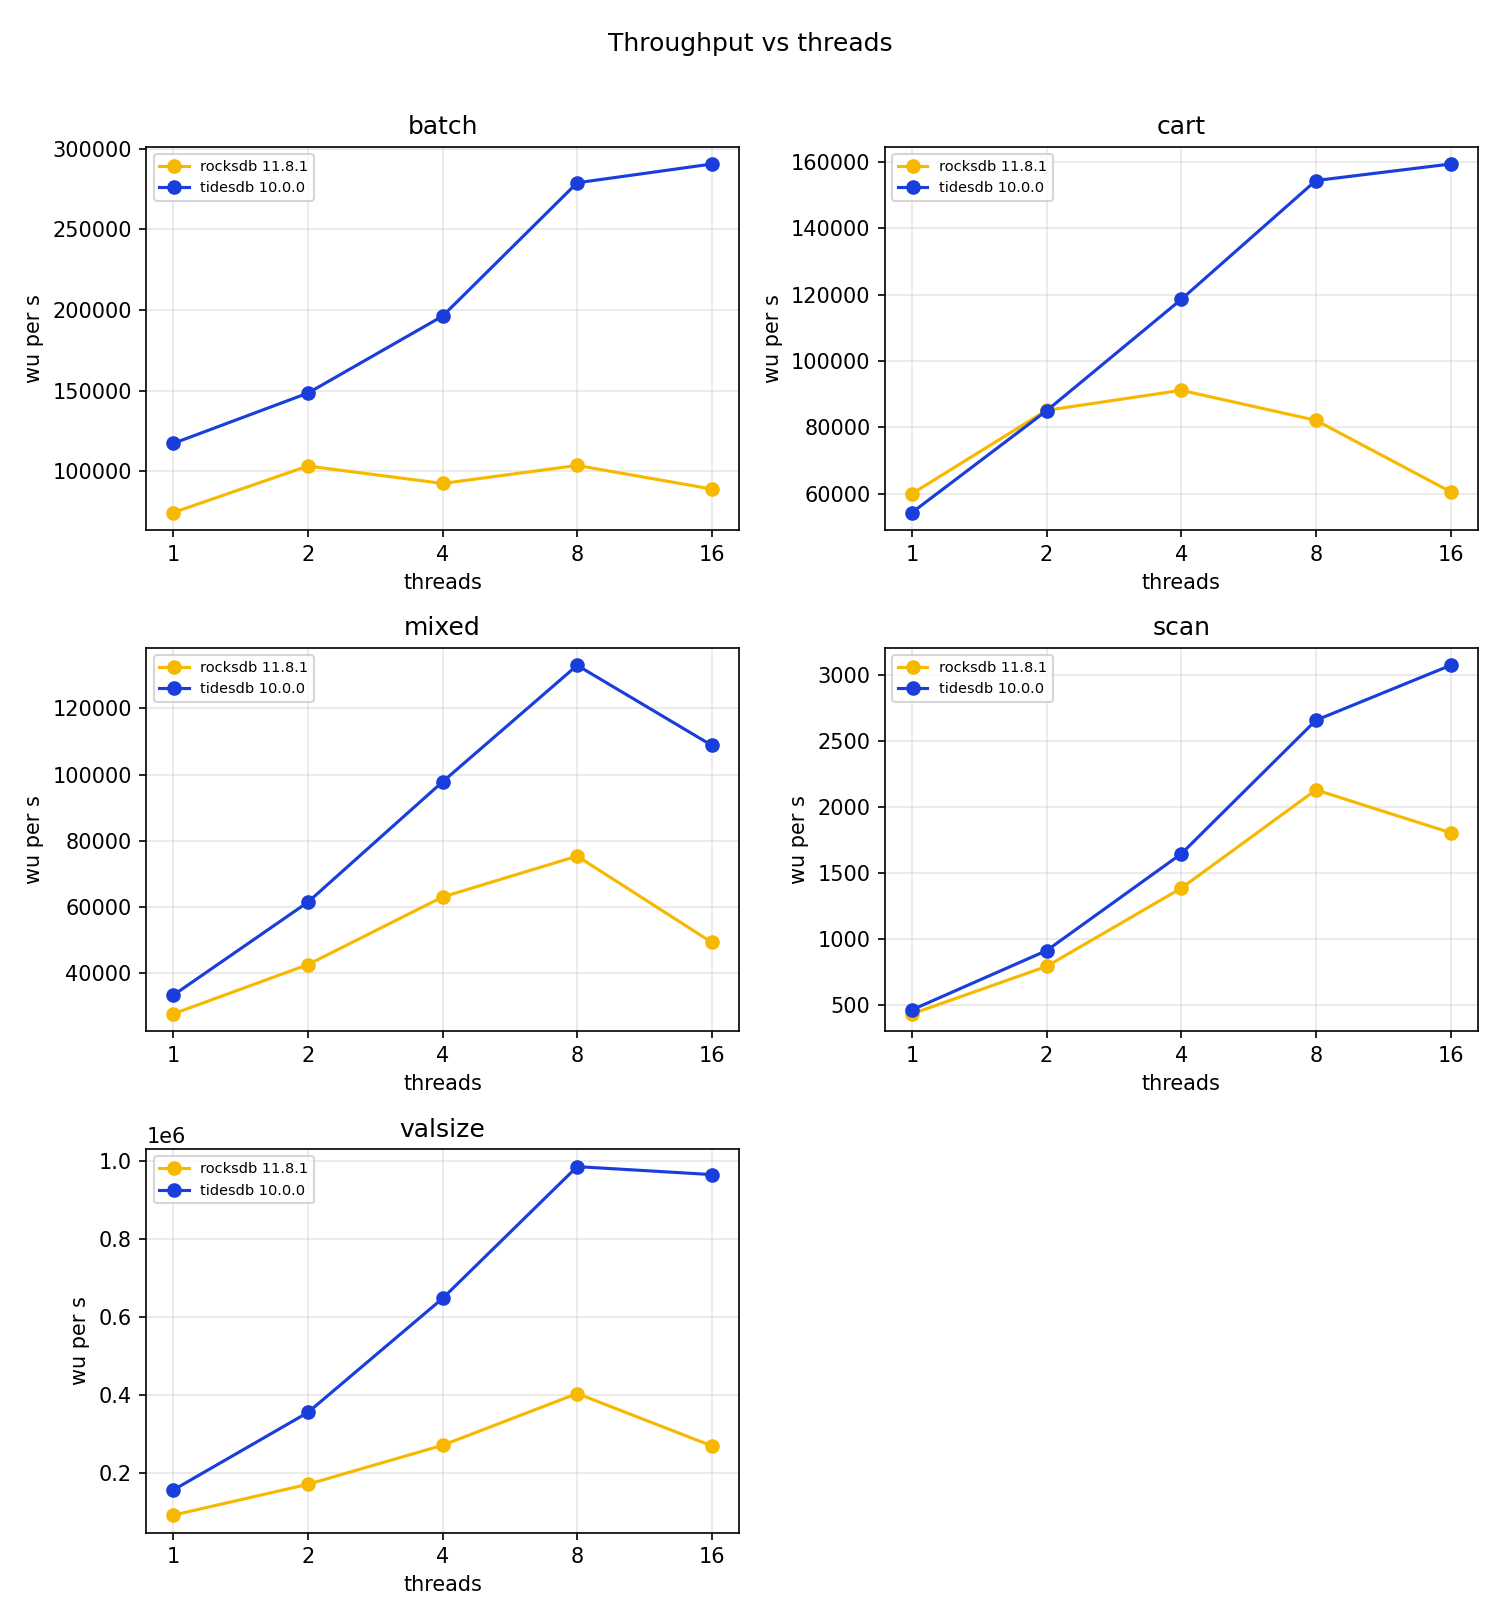
On the small server neither engine scales well on write heavy work. From 1 to 64 threads mixed improves 2.01x for TidesDB and 1.03x for RocksDB, and cart gets worse for both, 0.63x and 0.83x. Cart is the workload with hot user skew, so that is contention on hot keys and not an I/O limit.
The large server, with isolated pinned cores, is healthier. Cart runs 59,992 to 82,088 wu/s on RocksDB and 54,296 to 154,351 on TidesDB from 1 to 8 threads. Both fall back at 16 threads, which is what you expect when the run is confined to eight isolated cores and 16 threads oversubscribes them two to one. The unpinned engine background threads noted earlier are a second candidate there and the two have not been separated.
Why RocksDB stalls on batch
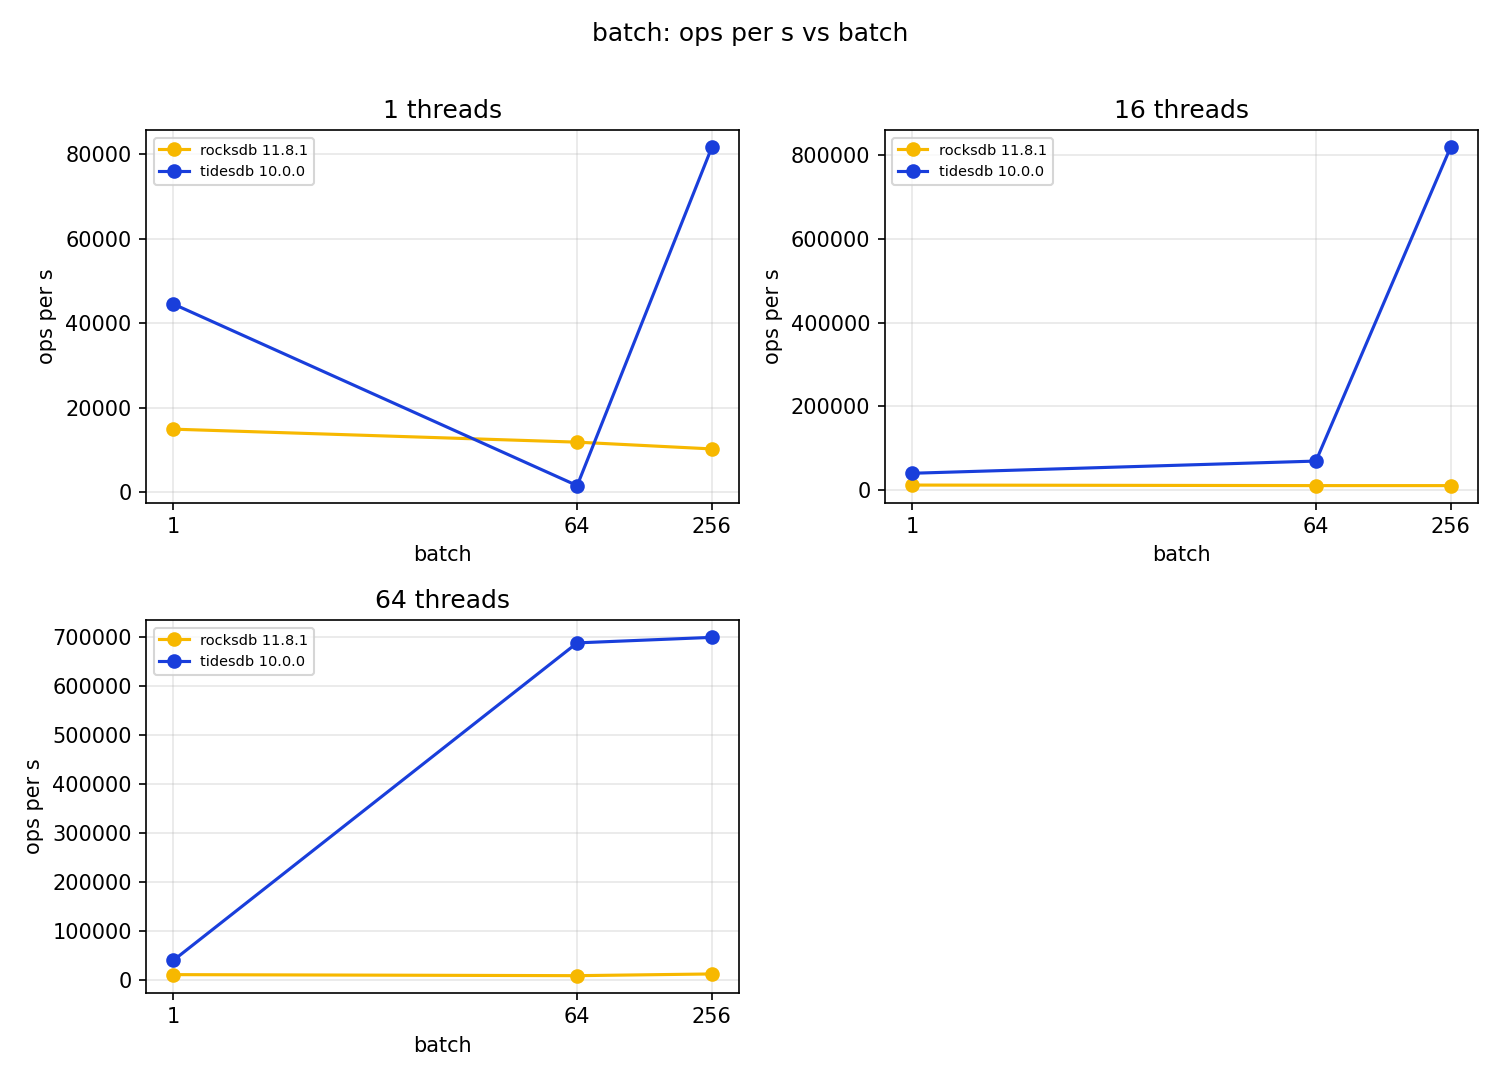
The small server batch ratios reach 77x, which is the largest number in this article and the one most worth understanding before quoting. It is a real RocksDB behaviour with a mechanism you can follow from the workload down.
The batch workload calls kv.mput with 64 or 256 key value pairs per call. Values
are 4096 bytes and keys are 14, so a 256 key call hands the engine about 1.05 MB in
one shot, and keybench’s RocksDB backend maps that onto a single rocksdb_write of
a write batch, not onto 256 separate puts. The mapping is correct, and it means
the engine sees a small number of very large atomic writes instead of a
stream of small ones.
RocksDB’s defaults are not sized for that, and its defaults are the subject here.
A 64 MB write_buffer_size fills after about 61 of those calls,
max_write_buffer_number is 2, so only one memtable may
be flushing while another fills. Flushed memtables land in L0, and
level0_slowdown_writes_trigger is 20 files while level0_stop_writes_trigger is
36. Once L0 grows past those, RocksDB first throttles the writers and then stops
them outright until compaction drains L0 into L1.
Keybench samples RocksDB’s own properties once a second, so this is not inference.
| during the batch run | small server | large server |
|---|---|---|
| samples with writes fully stopped | 393 of 1668, 24% | 0 of 2663 |
| samples with writes throttled | 898 of 1668, 54% | 357 of 2663, 13% |
| immutable memtables, max | 2 | 1 |
| pending compaction bytes, max | 30.23 GB | 32.53 GB |
On the small server RocksDB reported is-write-stopped for roughly a quarter of
the run and a non-zero delayed write rate for more than half of it, with the
memtable pipeline saturated at its limit of two. On the large server it never
stopped once.
Both machines built about the same compaction backlog, near 30 GB. The difference is that NVMe drains it and SATA does not. So the stall is real, it is what a user running default RocksDB against large batched writes on a slow device will get, and it is not an artifact of the harness. What it is not is a general statement about the engine, which is why the same workload gives 0.14x to 77x on one machine and 1.57x to 2.74x on the other.
| batch, 64 key calls | small server | large server |
|---|---|---|
| RocksDB | 140 to 186 wu/s, falling with threads | 1,250 to 1,661 wu/s |
| TidesDB | 25 to 10,736 wu/s | 2,218 to 4,357 wu/s |
| ratio | 0.14x to 77x | 1.57x to 2.74x |
TidesDB does not hit this wall here, and it is worth being precise about why, since
it is not that TidesDB lacks admission control. It has three limits that pace
writers, the queue of sealed memtables awaiting flush governed by
memtable_l0_queue_stall_threshold, the write-ahead log’s staging ring, and the
depth of overlapping runs in L1. It simply did not reach them on this workload.
The reason it did not comes from where a separated value is written. A value is separated at commit rather than at flush, with the committing transaction appending the bytes to the value log and the write-ahead log record carrying only an id of a few bytes. A large value therefore reaches the device once, rather than once in the log and again in the sstable a flush builds. The docs put the difference on a 4 KiB value workload at a write amplification of 2.10 inline against 1.06 separated. The flush that follows carries the same id forward, so what lands in L0 is a key log rather than a copy of the values, and the level fills far more slowly for the same ingest.
Value size
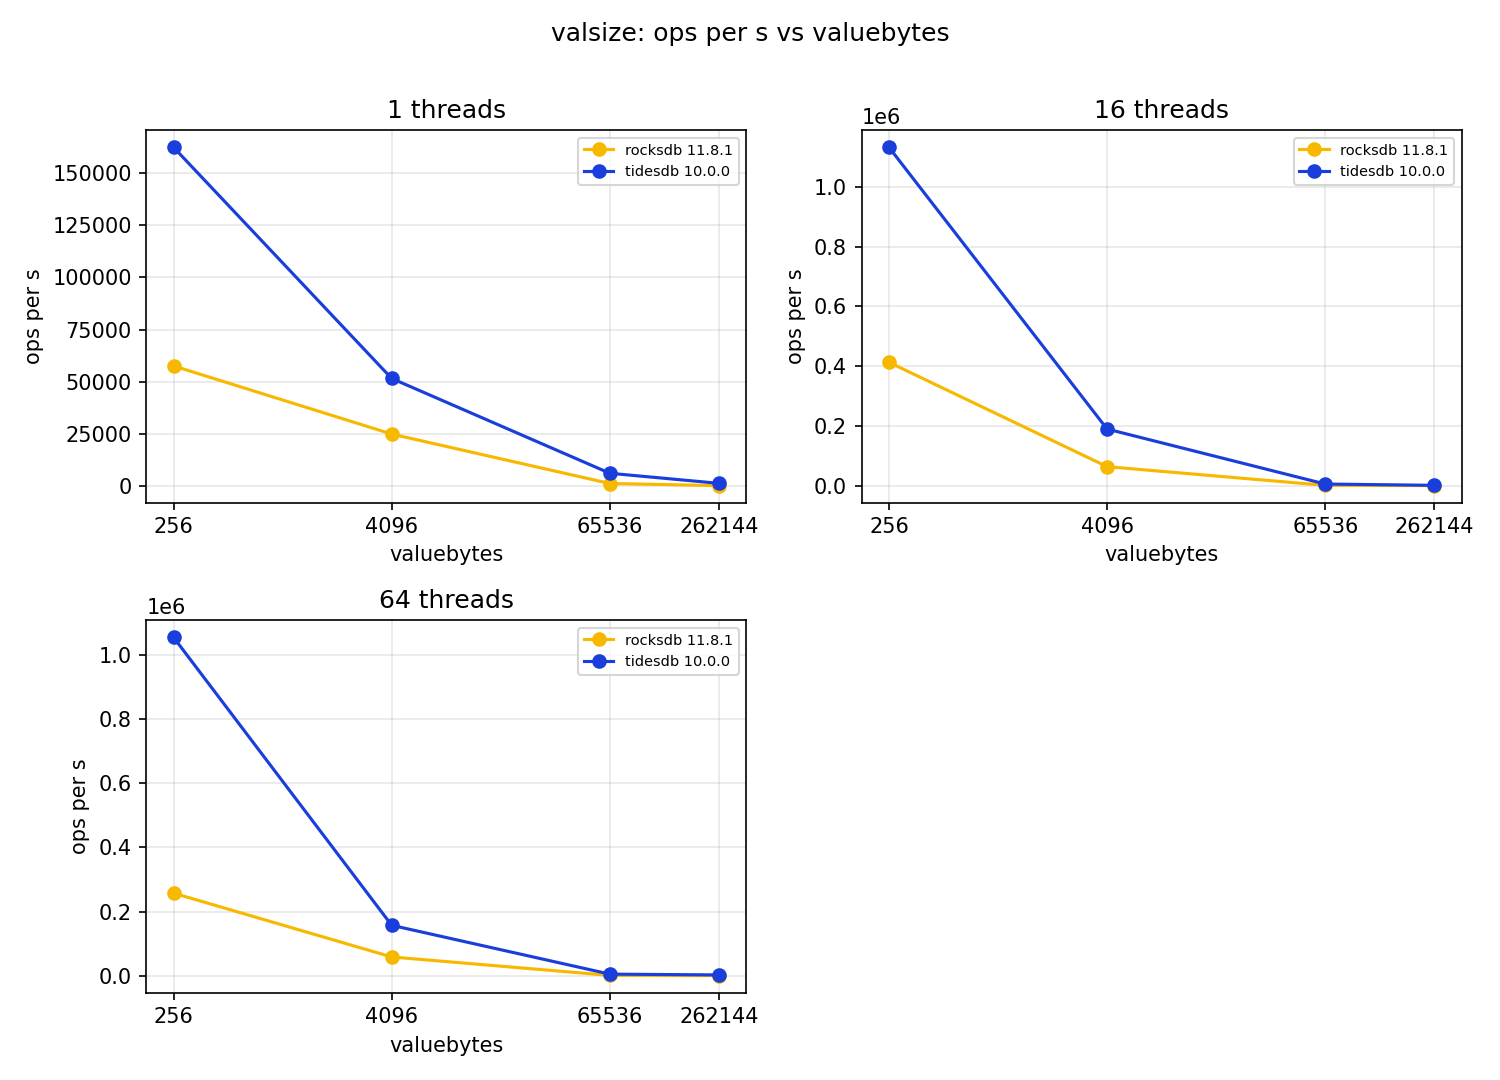
The advantage is not monotonic in value size. At one thread on the small server it runs 2.82x at 256 B, 2.07x at 4 KB, 4.76x at 64 KB and 4.69x at 256 KB.
The dip at 4 KB is the interesting part, and it is not noise. It is the minimum at every thread count on both machines, five out of five on the large server and both points on the small one. 4 KB sits just past TidesDB’s 1024 byte separation threshold, so a value pays the value log indirection without being large enough for the saving to dominate. Every other workload in this article uses 4 KB values, which means the headline numbers are measured at TidesDB’s least favourable value size.
Turning BlobDB on
The value size sweep was run a third time on the large server with RocksDB configured to separate values the same way TidesDB does. Same grid, same three repeats, same dataset.
[rocksdb]compression = kNoCompressionenable_blob_files = truemin_blob_size = 1024enable_blob_garbage_collection = truemin_blob_size matches TidesDB’s 1024 byte threshold so both engines separate the
same values, and garbage collection is on because TidesDB reclaims its value log by
default and an arm that never collects is not doing comparable work.
blob_file_size already defaults to 256 MB, which is TidesDB’s vlog_segment_size
exactly, so segment granularity matched without being set. Blobs were used, 184
blob files holding 12.23 GB.
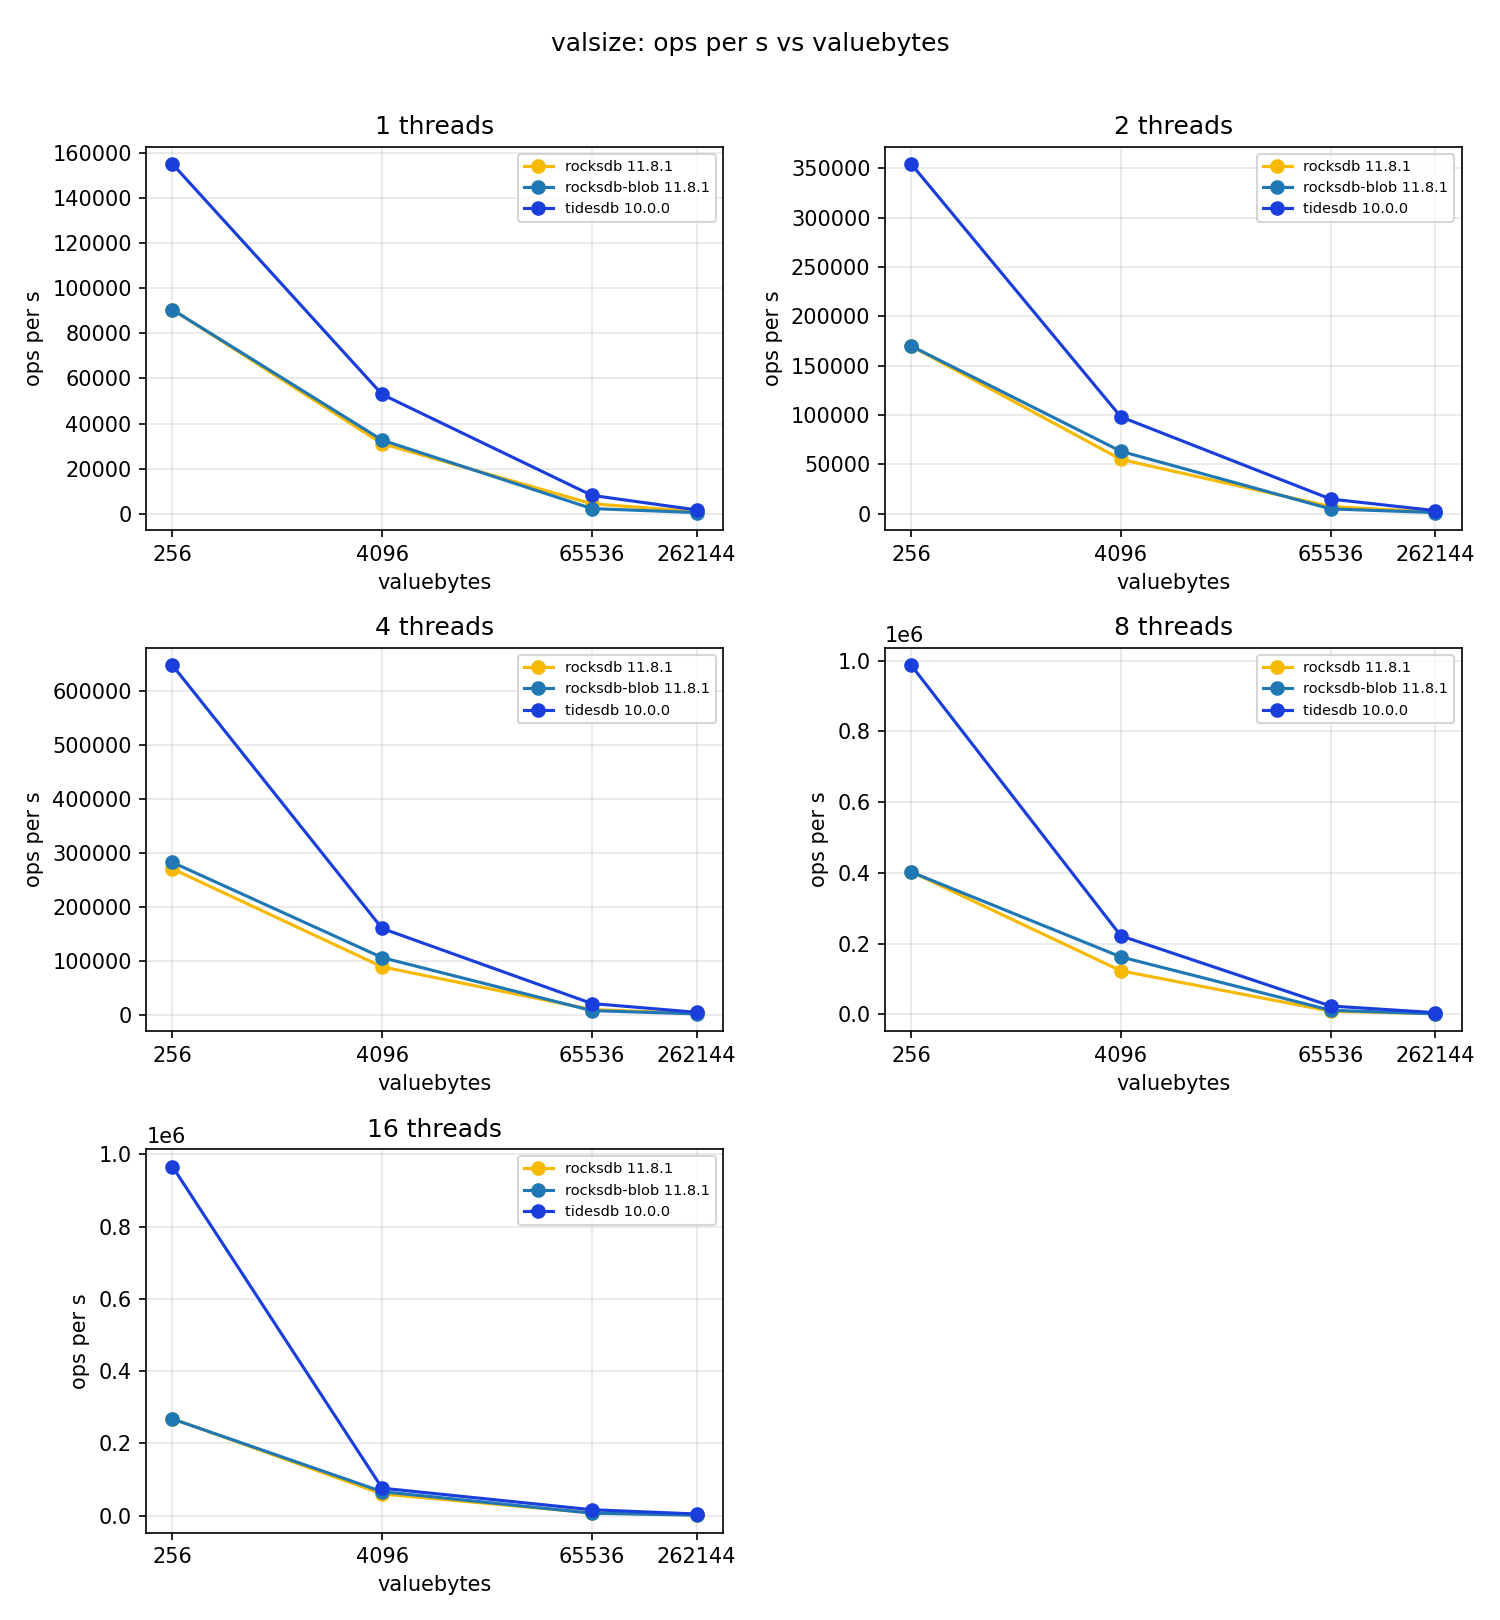
The two RocksDB lines sit almost on top of each other.
| valuebytes | RocksDB default | RocksDB blob | TidesDB | blob vs default |
|---|---|---|---|---|
| 256 B | 403,181 | 402,343 | 986,421 | 1.00x |
| 4 KB | 123,259 | 162,583 | 222,110 | 1.32x |
| 64 KB | 9,294 | 11,907 | 23,883 | 1.28x |
| 256 KB | 2,101 | 1,704 | 5,089 | 0.81x |
Those are 8 thread numbers, and the pattern holds across the sweep. At 256 B nothing changes, which is expected since values below the threshold stay inline either way. At 4 KB and 64 KB BlobDB helps, by 1.11x to 1.32x depending on thread count. At 256 KB it hurts at every thread count, between 0.54x and 0.81x, and it also hurts at 64 KB below 8 threads.
So enabling BlobDB does not close the gap. TidesDB still leads the blob arm by 1.14x to 3.61x, and where BlobDB helps most, 4 KB at 8 threads, TidesDB is still 1.37x ahead of it.
Write amplification is where BlobDB does clearly pay.
| arm | device writes | user bytes | WA |
|---|---|---|---|
| RocksDB default | 2320.9 GB | 330.9 GB | 7.01x |
| RocksDB blob | 1371.6 GB | 297.4 GB | 4.61x |
| TidesDB | 904.4 GB | 692.9 GB | 1.31x |
BlobDB cuts RocksDB’s write amplification by 1.52x, which is the feature working as described. TidesDB is still 3.53x below that, and note the user bytes column, since TidesDB wrote more than twice the user data in the same wall clock while sending fewer bytes to the device.
The latency shape is worth a look too. At 256 KB and 8 threads, turning BlobDB on takes RocksDB’s get p50 from 1.45 ms to 240.64 us, a large read win from not dragging values through the LSM. Its put p99 goes the other way, 87.56 ms to 152.04 ms, and its delete p99 from 61.60 ms to 114.82 ms. TidesDB’s figures in that cell are 107.01 us, 193.54 us and 26.24 us.
Two things follow. The first is that key value separation is not the whole story
here. It is a real part of RocksDB’s write amplification gap and it does not account
for the throughput gap, since closing the configuration difference leaves TidesDB
ahead everywhere in this sweep. The second is that the mirror experiment, TidesDB
with keep_values_inline=1, is not worth running. Holding 4 KB values inline in a
4 KB btree node collapses the fanout unless btree_klog_block_size is raised to
match, so it is two coupled changes and not one flag, it is not a configuration
anybody is advised to run, and this arm already answers the question from the other
side.
Write amplification
Write amplification here is bytes written to the block device, taken from
/proc/self/io, divided by bytes of user data written. User bytes are the seeded
dataset plus every put in the timed phase, counting a delete as a tombstone rather
than a full record. Both engines seed the identical dataset.
| machine | workload | RocksDB | TidesDB | TidesDB lower by |
|---|---|---|---|---|
| small | mixed | 3.56x | 1.43x | 2.5x |
| small | cart | 3.85x | 1.21x | 3.2x |
| large | mixed | 11.96x | 3.20x | 3.7x |
| large | cart | 10.60x | 2.83x | 3.8x |
| large | valsize | 7.01x | 1.31x | 5.4x |
The valsize row is the one the BlobDB section revisits. Turning blob files on takes RocksDB from 7.01x to 4.61x there, so separation accounts for part of that gap and not all of it.
Both engines amplify far more on the large server, because in 60 seconds on NVMe they both do a great deal more work against the same dataset and compaction has correspondingly more to do. TidesDB’s relative advantage grows a little rather than shrinking, which makes this the one measure where the faster machine is kinder to TidesDB.
For TidesDB this can be checked instead of taken on trust. On the small server
mixed run the engine reports 52.23 GB across its write-ahead log, value log,
flushes and compactions against 52.28 GB counted by the kernel, agreeing to 0.1%.
RocksDB exposes no equivalent counter, so /proc/self/io is the only common basis,
but at least on one side that basis is corroborated.
I give no figure for batch. That workload drives roughly 162 overwrites per key, so most writes are superseded in the memtable and never reach storage, and TidesDB computes to 0.11x there. That is arithmetically correct and tells you about the workload rather than the engine.
One note on why user bytes belong in the denominator and operations do not. Divide by operations and the shared 10 GiB seed is charged against the timed operations alone, and since RocksDB performs about 6.5x fewer of those it absorbs that fixed cost far more heavily. The ratio then reads about twice as favourable to TidesDB as it should.
Where the bytes go
Keybench asks each engine for its own internal counters once a second and plots
every one of them, which for TidesDB is around sixty panels covering level sizes,
sstable and key counts per level, btree shape, cache hit rate, value log occupancy
and reclamation, write stalls and transaction memory. That figure is in the archive
as engine_stats_tidesdb_mixed.png and it is too dense to read at article size, so
the numbers that matter are pulled out here instead.
At the same 10 GiB mixed dataset.
| TidesDB | RocksDB | |
|---|---|---|
| bytes in the LSM | 63 MB | 13.85 GB |
| bytes in a separate value log | 11.3 GB live on average | 0, BlobDB is off |
| bytes per key in the LSM | 17.6 | about 4110 |
| klog btree | 50,007 nodes, height 3, 76 keys per node | not applicable |
| point lookup read amp | 5 | not applicable |
TidesDB is an LSM whose sstable is a btree key log that borrows from a shared value log. With the default 1024 byte separation threshold every 4 KB value goes to that log, and the klog entry references it by an opaque logical id rather than by a physical location, which measures out at 17.6 bytes per key here. RocksDB stores key and value inline at about 4110 bytes per entry, so its tree is roughly 230x larger per key and compaction rewrites those values every time data moves down a level.
The write breakdown is more interesting than the ratio. Of the 52.3 GB TidesDB wrote during the small server mixed run, the value log took 51.32 GB, the write-ahead log 0.53 GB, compaction 0.27 GB and memtable flush 0.11 GB. Compaction and flush together are 0.38 GB. The LSM does almost no writing, which is what a 63 MB tree over 3.8 million keys implies, and that is the structural result worth taking away. But the value log appends a fresh copy on every overwrite and accounts for 98% of everything the engine writes. The compaction win is large and real and it does not carry all the way through to total bytes written. A factor of two to four, not a factor of eight.
RocksDB has the same idea in BlobDB
and ships it off. Its wiki describes it as key value separation from the WiscKey
paper, storing large values in dedicated blob files with only small pointers in the
LSM tree, so that RocksDB avoids “copying the values over and over again during
compaction”. Same objective as TidesDB’s value log, reached by a different route, and min_blob_size plays the part value_separation_threshold
plays here. One difference in kind is that BlobDB is enabled per column family
while TidesDB’s threshold is database level, since its value log is a single shared
structure.
The relevant fact is that enable_blob_files defaults to false, while TidesDB
separates at 1024 bytes with nothing set. So a large share of the write path result
is key value separation on against off.
That is the intended comparison, not a confound in it. The question being answered is what you get from the two libraries as they install, and one of them separates large values without being asked.
It does raise an obvious follow up, which is what happens with separation turned on for RocksDB too, so that one was run. It gets its own section below.
Space amplification
The value log is the cost side of separation and it should be reported. Sampled
through the small server mixed run, db_vlog_bytes ranges from 10.34 GB to 43.32
GB with a mean of 23.94 GB, while the bytes live sstables can still reach hold at a
mean of 11.31 GB. Dead bytes stay low at a mean of 0.19 GB, so reclamation is
working and not falling behind, and the log grows, retires segments and falls
back. The store holds roughly twice its live data on average and peaks higher.
If you are sizing a disk for TidesDB, size it for the peak and not for the dataset.
Latency
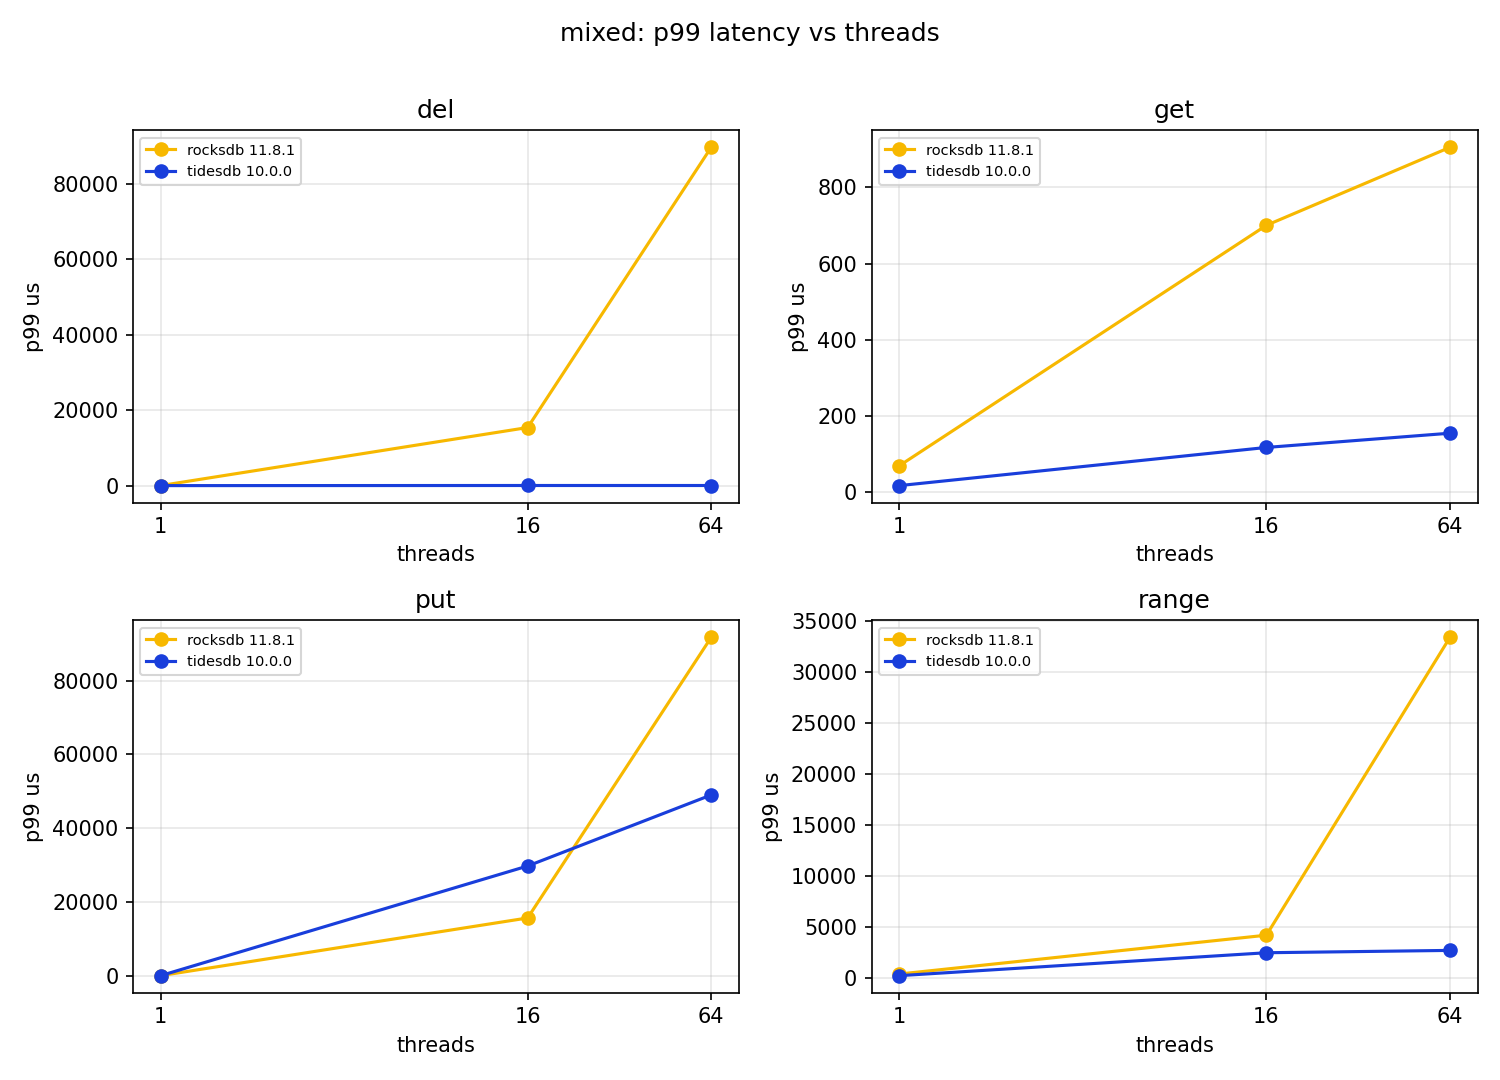
Small server, mixed, 16 threads.
| op | RocksDB p50 | TidesDB p50 | RocksDB p99 | TidesDB p99 |
|---|---|---|---|---|
| get | 122.37 us | 26.75 us | 700.42 us | 117.25 us |
| del | 17.28 us | 6.94 us | 15.40 ms | 39.68 us |
| range | 864.26 us | 577.54 us | 4.23 ms | 2.51 ms |
| put | 27.78 us | 86.53 us | 15.66 ms | 29.75 ms |
Reads and deletes are in TidesDB’s favour, by 4.6x on get p50 and by 388x on del p99, where RocksDB’s 15.40 ms is the write stall reaching the delete path. A delete writes a tombstone into the key log, which is the roughly 18 byte entry measured above, and the separated value it shadows is left where it is for the value log’s reclamation to deal with later rather than being rewritten.
Put is the exception and it needs care. In that table TidesDB’s put p50 and p99 are worse than RocksDB’s, but TidesDB performed 585,004 puts in the window against RocksDB’s 252,778, so it is absorbing 2.3x the write load. A separate work bounded run, where both engines execute an identical number of operations from the same seed, inverts it. Put p99.9 comes out at 11.86 ms for RocksDB and 1.06 ms for TidesDB. That run is not in the archives below, so take it as a pointer to the right experiment and not as a result you can check here. So TidesDB’s put path degrades under its own higher throughput rather than being slower at the same load. Time bounded runs cannot separate those, which is a limitation of this article’s method and not of either engine.
Memory
Peak resident set size of the benchmark process on the small server.
| workload | RocksDB | TidesDB |
|---|---|---|
| mixed | 538 MB | 2,180 MB |
| cart | 511 MB | 2,255 MB |
| scan | 296 MB | 717 MB |
| valsize | 4,343 MB | 3,413 MB |
Read on its own that says TidesDB uses three to five times more memory on three of four workloads. That reading does not survive normalising for work, since TidesDB completes far more operations in the same 60 seconds and carries more in flight as a result.
| workload | RSS ratio | operations ratio | RocksDB MB per Mops | TidesDB |
|---|---|---|---|---|
| mixed | 4.05x | 2.79x | 65.1 | 94.5 |
| cart | 4.42x | 4.86x | 91.8 | 83.4 |
| scan | 2.42x | 1.50x | 336.7 | 544.2 |
| valsize | 0.79x | 3.15x | 27.4 | 6.8 |
Per operation TidesDB uses less memory than RocksDB on cart and considerably less on valsize, and about 1.5x more on mixed and scan. The raw peaks are mostly a consequence of doing more work, not of being hungrier per unit of it. What the raw numbers do tell you is what to provision, since a process that reaches 2.2 GB needs 2.2 GB whatever the reason. Both are bounded rather than growing, stepping up and plateauing within a run, so neither is leaking.
Variance, and a result that reverses
Both engines ran three times per cell on both machines, so this can be compared instead of asserted. It is where the two machines disagree most, and where the small server misled me.
On the small server TidesDB is the tighter of the two on the typical cell, median spread 1.12x against RocksDB’s 1.23x, with both keeping 22 of 30 cells inside 1.5x. But five TidesDB cells spread more than 3x and no RocksDB cell does. The worst is batch with 64 key calls at one thread, where three identical repeats produced 5, 25 and 132 wu/s.
On the large server neither engine exceeds 1.5x across 50 cells, and TidesDB’s worst is 1.1x against RocksDB’s 1.5x. The offending cells come back stable.
| cell | small server | large server |
|---|---|---|
| batch, 64 key calls, 1 thread | 5..132 wu/s, 26.4x | 2,182..2,227, 1.0x |
| valsize 64 KB, top of sweep | 4,968..76,549, 15.4x | 16,663..16,702, 1.0x |
It is tempting to conclude from that the instability was the environment and not the engine. I do not think the data supports the conclusion that cleanly.
The large server is not simply faster hardware. It is a host configured to remove
variance. It boots with transparent_hugepage=never, intel_idle.max_cstate=1
and processor.max_cstate=1, isolcpus=0-15 with nohz_full and rcu_nocbs
over the same range, and nosmt. The governor is performance with turbo on. The
benchmark disk is the un-RAIDed NVMe described earlier, separate from the OS disk.
Between the two machines that removes scheduler
migration, deep C-state transitions, transparent huge page stalls, timer ticks and
RCU callbacks on the benchmark cores, SMT contention, and OS IO landing on the same
device as the benchmark.
So more than a dozen variables move at once. The honest reading is that the instability does not survive a host tuned this way, which is consistent with it being environmental but does not identify which variable mattered, and does not prove the engine has no latent sensitivity that a noisier machine provokes. Those are different claims and only the first is supported here.
The pinning difference between the two runs is not a designed contrast. cat /sys/devices/system/cpu/isolated returns nothing on the
small server, so the scheduler balances threads there by itself and pinning would
only remove migration noise. It returns 0-15 on the large server, where an
unpinned sweep is fiction. Each host used the setting it required, which is correct
practice and also means pinning cannot be isolated as the cause by comparing these
two runs.
Separating the candidates would take changing one variable at a time on a single host, across storage, huge pages, C-states and the rest. That has not been done. So what I can say is that TidesDB is the steadier of the two on the tuned host, that the small server produced five cells the tuned host does not reproduce, and that I do not know which difference is responsible.
Running both machines is why either of those is knowable. The small server on its own supports two conclusions the large server does not, a batch advantage of 77x that is really a device dependent RocksDB stall, and a variance problem in TidesDB that may be the engine or may be the host. Neither reproduces. A single machine cannot tell you which of its results are about the software, which is the reason for running two.
What this does not measure
- Compression, on either engine.
- Datasets larger than memory. At 10 GiB on machines with 47 and 125 GiB both engines keep the working set in page cache, so the device read path is barely exercised. RocksDB read between 0.3 and 83 bytes from the device per operation on the small server against a 4110 byte record, so almost every read was served from memory. Read amplification is not meaningfully measured here.
- Steady state. Cells run 60 seconds and the timeline shows both engines still decaying at the end of one.
- Durability settings. Both run with their default sync behaviour and neither is fsyncing per commit.
- Recovery time and compaction debt after a run.
- Anything tuned, apart from the one BlobDB arm on the value size sweep. By design the only setting touched elsewhere is compression, so nothing here speaks to how either engine performs configured well.
Repro
Every result directory carries a replay.cnf.
./keybench --config <dir>/replay.cnfFigures are regenerated from the tsv artifacts.
python3 scripts/plot.py <dirs...> --out comparisonWhat it comes to
TidesDB is faster than RocksDB at their respective defaults across almost everything measured here, and the shape of the win is consistent enough to describe. It loads a 10 GiB dataset in a fraction of the time, between 2x and 10x depending on the machine. It wins 29 of 30 cells on the small server and 48 of 50 on the large one. It writes between 2.5x and 3.8x fewer bytes to the device for every byte of user data, and by 5.4x on the value size sweep, which is an endurance argument as much as a speed one. Its reads and deletes are quicker at both the median and the tail.
Much of that traces to one decision. TidesDB separates values above 1024 bytes into a shared log by default, so its tree holds 17.6 bytes per key against RocksDB’s 4110, and its compaction moves 0.38 GB where RocksDB’s moves the dataset repeatedly. RocksDB can do the same through BlobDB and does not unless asked.
Asking it, on the value size sweep, cuts its write amplification by 1.52x and leaves the throughput gap open. BlobDB helps RocksDB at 4 KB and 64 KB, hurts it at 256 KB, and TidesDB finishes ahead at every point in the sweep either way. So the defaults difference is real and it is not the whole explanation.
The two machines disagreed, and the disagreements are the most useful part. A 77x batch result on SATA became 2.7x on NVMe once RocksDB stopped stalling. Five TidesDB cells that swung wildly on the small server were rock steady on the large one, though the hosts differ in enough ways that I cannot say which difference mattered. Both of those would have been reported as facts about an engine had only one machine been run.
The costs are real too and worth stating. TidesDB holds roughly twice its live data in the value log while it runs, so provision for the peak. It reaches higher peak memory, mostly because it is doing more work but not entirely. And 60 seconds per cell is not steady state on either engine.
Run your analysis where you’re curious. I hope you found this helpful.
—
You can find raw and all extensive plots for both servers below:
- smallserver.zip (sha256 5ab8502d6e7de47802cf261062036a5be07ba7f2573584ee658548c86ff40092)
- largeserver.zip (sha256 4880532e618b61ac5119c079fe426def24ecdeb96627228bc578362e6daaca80)