
Benchmark Analysis with HammerDB TPROC-C(TPC-C) on TideSQL v5.1.0, InnoDB in MariaDB v11.4.13

published on October 2nd, 2026
In this article I will be going over data from a recent HammerDB 6 TPROC-C performance test. TPROC-C is a derivative of the TPC-C benchmark. For this analysis I used MariaDB v11.4.13 with TideSQL v5.1.0, using jemalloc as my allocator for the server and both engines. TideSQL is a plugin engine that comes with MariaDB server, and it’s built on the TidesDB storage engine library. It’s primarily write and space optimized, though reads are highly efficient. I built 3000 warehouses for both engines and did a VU sweep from 4 to 128. 3000 warehouses is roughly 258 gigabytes of data. Both engines were configured based on configurations for MariaDB I discussed with Steve at HammerDB and Jonathan Miller at MariaDB Foundation.
The results are quite fascinating in that an LSM based engine can keep up with InnoDB, a highly optimized B+tree, in this workload. To add to that, TidesDB is completely optimistic, and with a large warehouse configuration contention does not cause a need for retrying.
The server environment looks like this:
- Intel i9-13900, 24 threads online, 8 P-core (5.3-5.6 GHz) + 16 E-core (4.2 GHz)
- the 8 P-cores isolated for the run
- Ubuntu 24.04.4 LTS (6.8.0-136-generic)
- 125.5 GiB DDR5, no ECC
- NVMe Micron 7450, xfs, separate from the OS disk
- gcc 13.3.0
- jemalloc
- MariaDB v11.4.13, TidesDB v10.1.0, TideSQL v5.1.0
So let’s wade into the details.
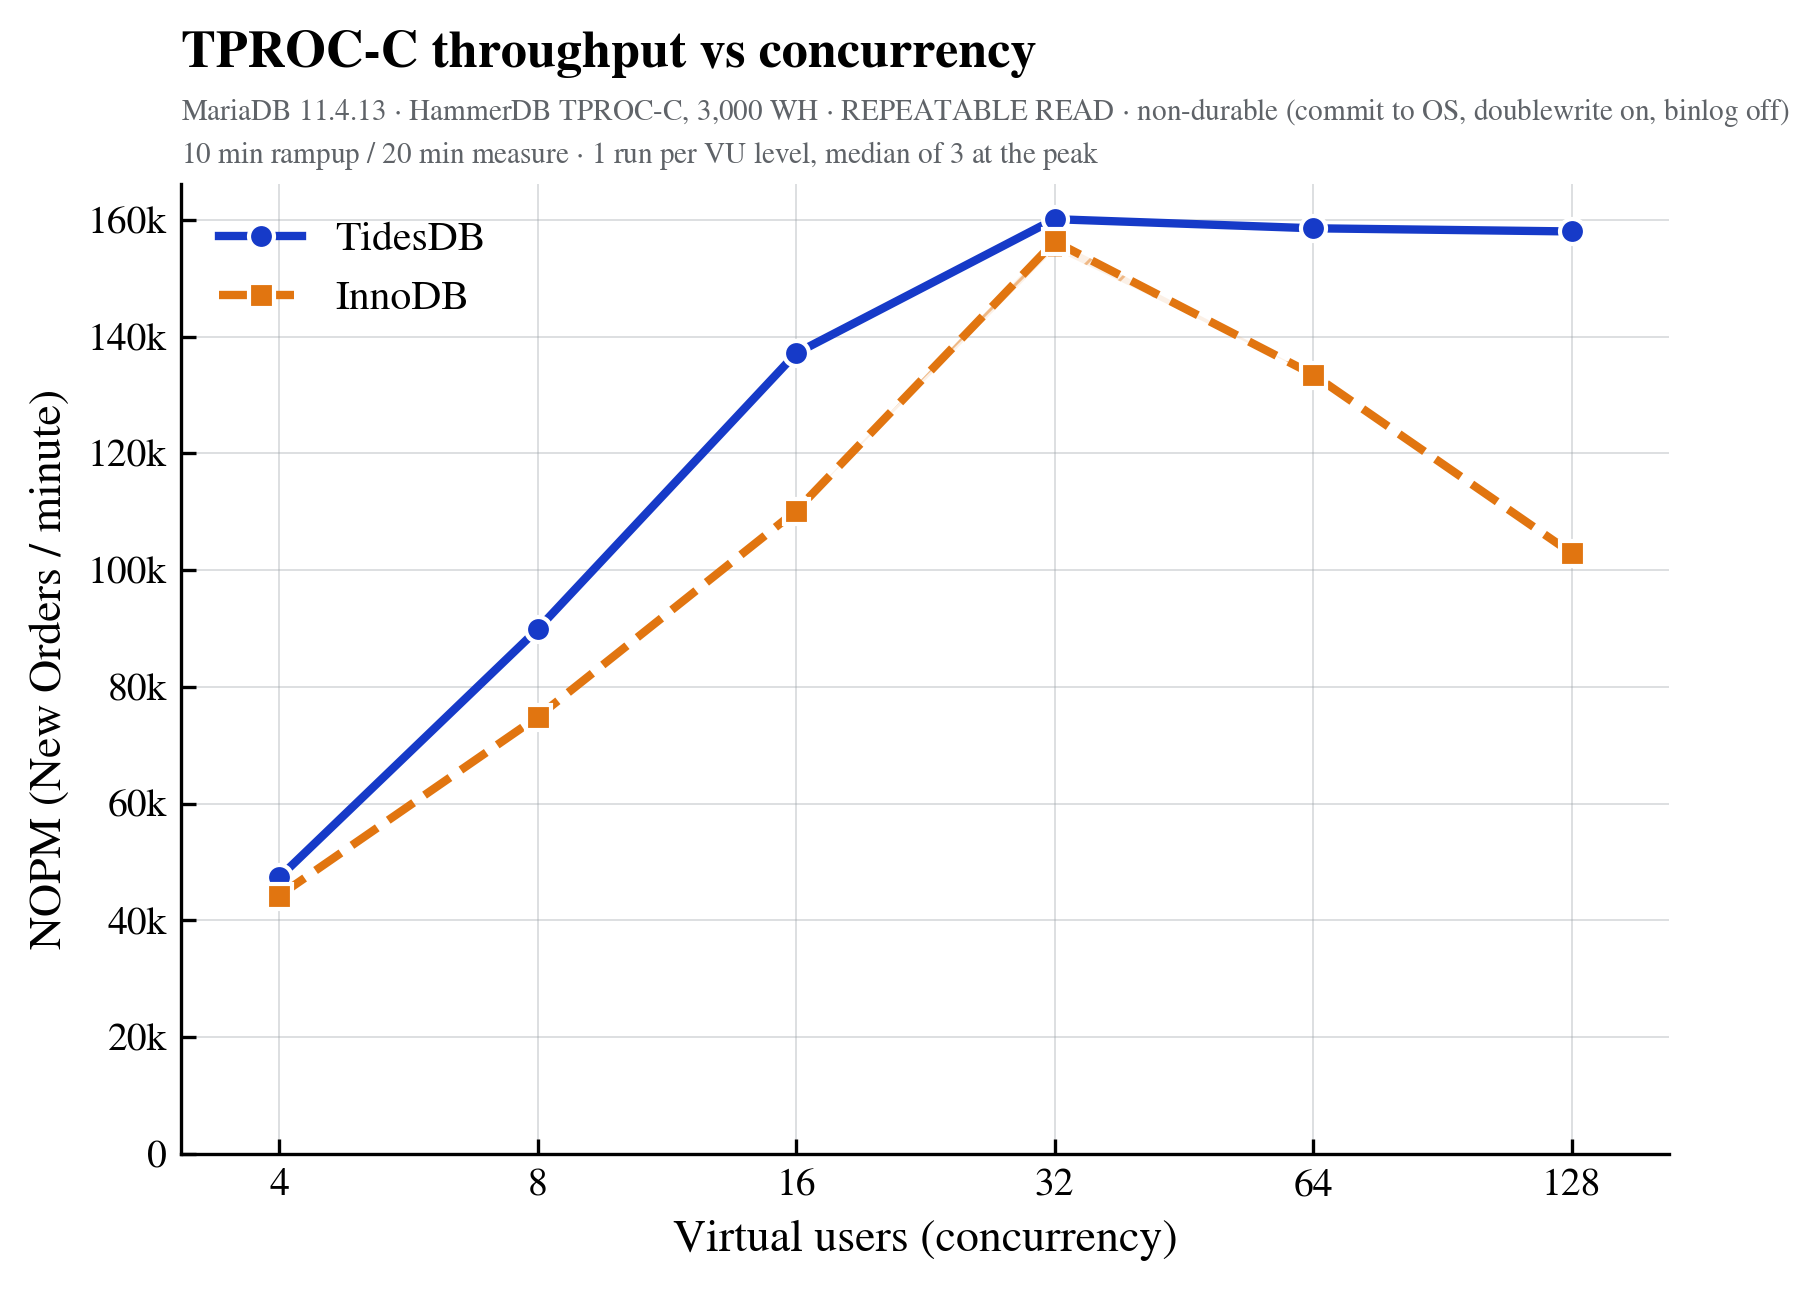
- TidesDB had more throughput than InnoDB at every concurrency level I tested: +7% at 4 virtual users, +24% at 16, +2% at the peak (32), and +54% at 128.
- Both peaked at 32 virtual users. Past the peak InnoDB lost 34% of its throughput by 128 VU; TidesDB lost 1.5%.
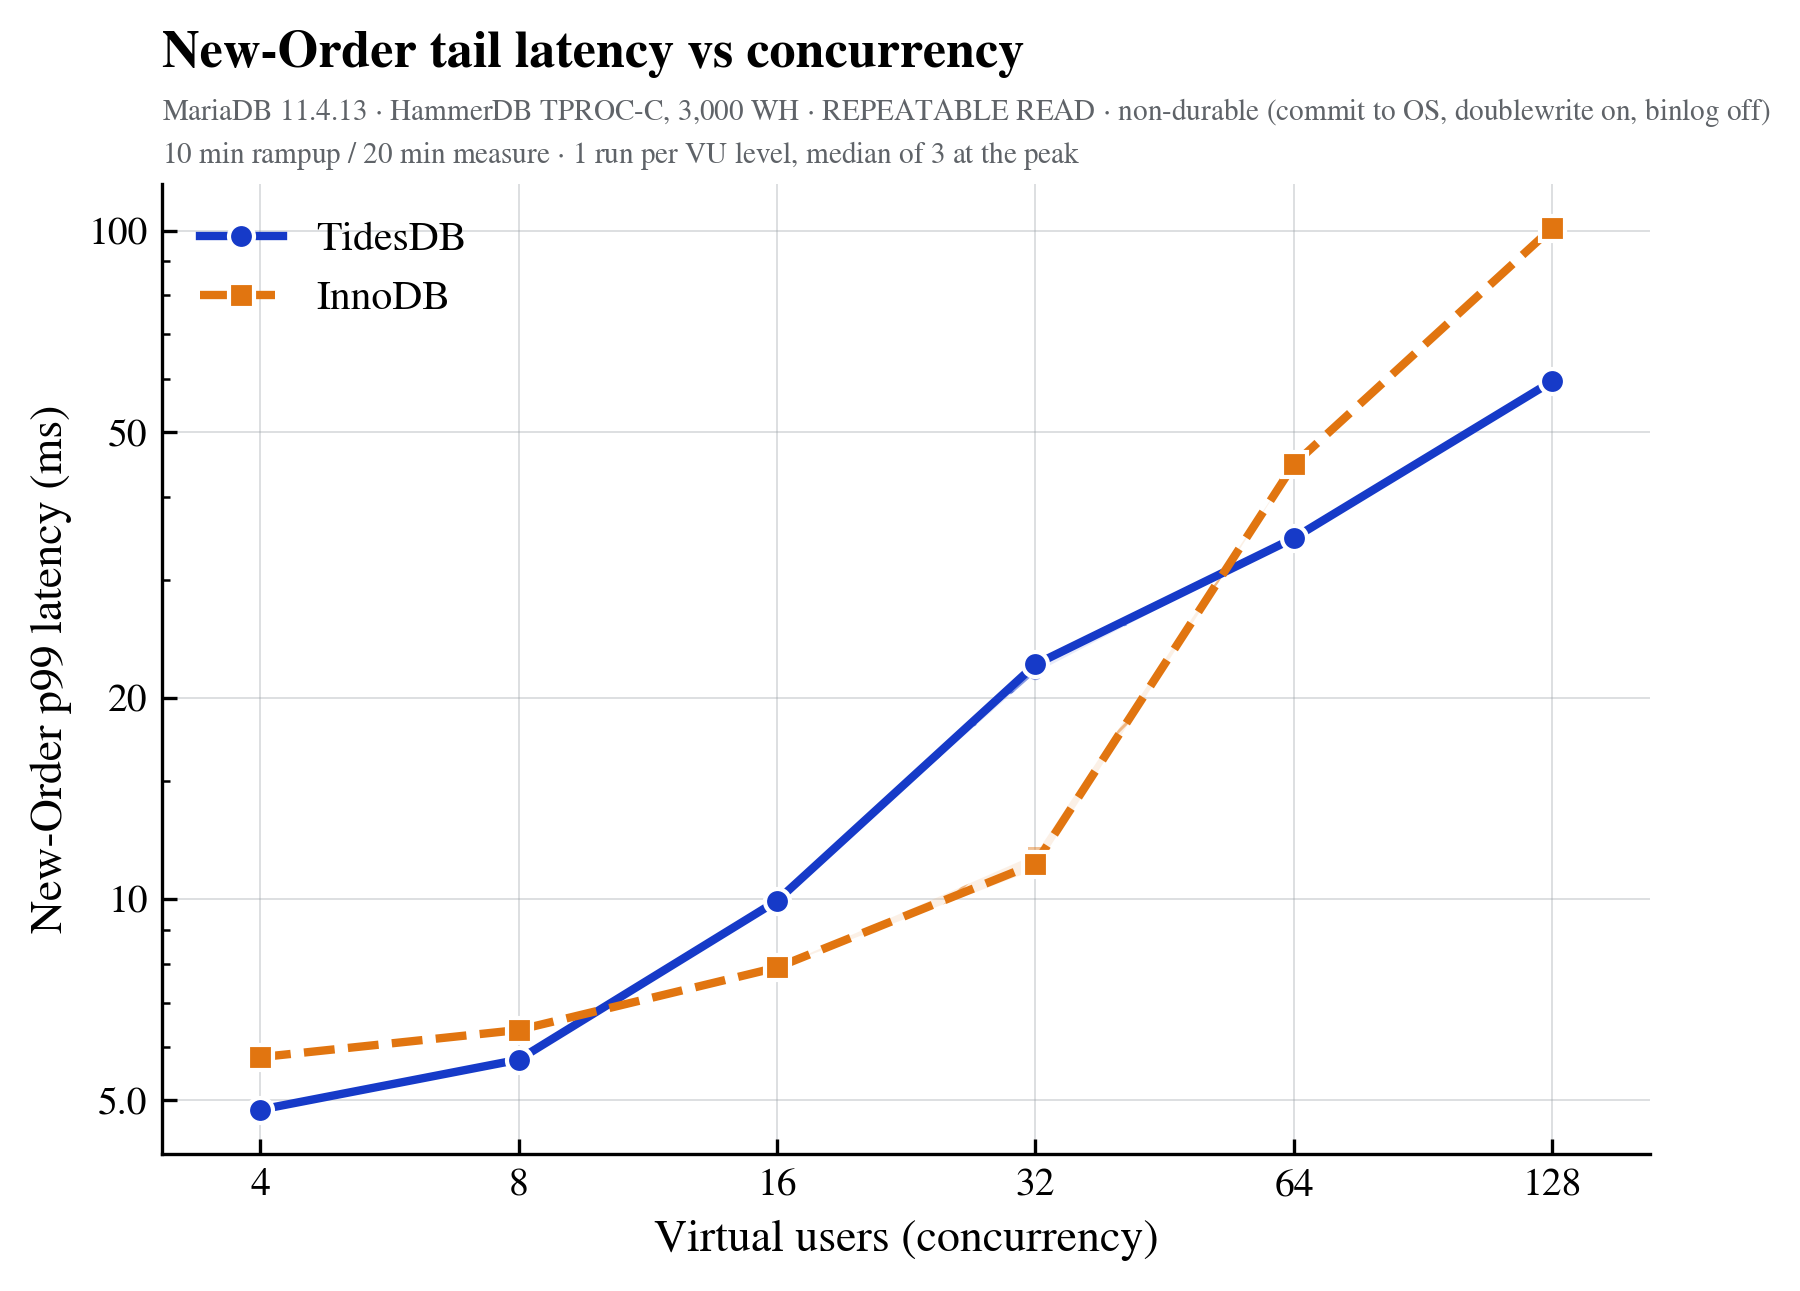
- InnoDB had better response time where it mattered to it. p99 was 11.3 ms vs 22.4 ms at the peak. At 64 and 128 VU that reverses, and at 128 VU TidesDB’s p99 is 41% lower.
- TidesDB wrote 6.5x fewer bytes per New-Order (53 KB vs 348 KB) and used 11% less space, but see
the heads-up about
innodb_max_dirty_pages_pct. - This is one host, one workload, and the dataset (258 GB) is ~4x the memory given to each engine.
This is not the usual LSM-versus-B-tree comparison, and I have tried not to write it as one. Both engines search B+tree nodes on the read path. What differs is transient read amplification, how writes land and how space is reclaimed (memtable, flush and compaction on one side, in-place page updates with a redo log and purge on the other), and how concurrency is controlled, where TidesDB is optimistic MVCC with no row locks and InnoDB takes pessimistic row locks.
Both engines share one server-layer configuration, derived from HammerDB’s CI config (mariaio.cnf). 27 settings are identical between my two configuration files. What differs is the engine section, where each TidesDB setting answers a specific InnoDB one.
| setting | InnoDB | TidesDB |
|---|---|---|
| commit flush | innodb_flush_log_at_trx_commit=0 | tidesdb_memtable_sync_mode=NONE |
| torn-write protection | innodb_doublewrite=1 | structural, cannot be disabled |
| binary log | off | off |
Both survive process death and neither survives machine death. Both detect torn writes.
HammerDB’s MySQL/MariaDB best-practice guide uses innodb_doublewrite=0 for peak numbers, and
I did not. TidesDB frames every block with size + XXH3 + size + magic and offers no switch to
turn that off, so disabling InnoDB’s doublewrite would hand InnoDB a saving TidesDB cannot
take. The InnoDB number here is therefore lower than a tuned-for-the-leaderboard InnoDB number,
on purpose.
InnoDB’s buffer pool is read cache and write buffer in one. TidesDB splits them, and with
max_open_sstables effectively unlimited it has a third resident consumer the cache budget does
not cover. Each open sstable keeps a routing directory (every partition’s offset and its whole
first key) as heap memory outside block_cache_size.
So the budgets line up. InnoDB got a 64G buffer pool across 16 instances. TidesDB got a 32G block cache plus an 8G memtable write buffer, and I allowed roughly 24G on top for routing directories at 3000 warehouses, which brings it to about 64G as well.
At the peak run, resident memory came to 55.8 GB for TidesDB (32G cache + 8G memtable + ~16G of routing directories for 1,468 open sstables) against 68.2 GB for InnoDB (its 64G pool plus server overhead). So TidesDB ran with about 18% less resident memory than InnoDB.
On file handles, innodb_open_files=500005 against tidesdb_max_open_sstables=65536. For
background work, tidesdb_flush_threads=4 and tidesdb_compaction_threads=4 against InnoDB’s
innodb_purge_threads=4 plus 16/16 io threads and 8 page cleaners. Compression is off on both.
| test parameter | value |
|---|---|
| warehouses | 3,000 (~258 GB, ~4x the 64 GB given to each engine) |
| virtual users | 4, 8, 16, 32, 64, 128 |
| rampup / measure | 10 / 20 minutes |
| iterations | one run per VU level, then 3 runs at the peak, median reported |
| use all warehouses | on |
| keying and thinking time | off |
| isolation | REPEATABLE READ |
| driver | stored procedures, raiseerror off |
By default each virtual user picks one home warehouse and keeps it, so a 3000-warehouse schema driven by 32 users would only touch 32 warehouses. I turned use all warehouses on so the drivers spread across the full 3,000 instead.
Every run restores the same copy of the built database, drops the OS page cache, and starts a fresh server. Without that, run N measures whatever run N-1 left behind, whether that is grown tables, accumulated undo or compaction debt, or a warm cache.
The client runs on the same machine as the server.
Do know NOPM (new orders per minute) is the headline, not TPM. MariaDB’s TPM counts commits plus rollbacks, so an engine that aborts and retries transactions scores TPM it did not earn. NOPM counts completed New-Order transactions.
Also reported per run are New-Order p50 and p99 from HammerDB’s time profiler, transaction errors per minute, failed virtual users, and whether the run completed at all. A run that timed out or lost virtual users is listed as excluded rather than quietly dropped.
| VU | TidesDB NOPM | p99 ms | InnoDB NOPM | p99 ms | TidesDB vs InnoDB |
|---|---|---|---|---|---|
| 4 | 47,346 | 4.8 | 44,234 | 5.8 | +7% |
| 8 | 89,876 | 5.8 | 74,847 | 6.4 | +20% |
| 16 | 137,137 | 9.9 | 110,158 | 7.9 | +24% |
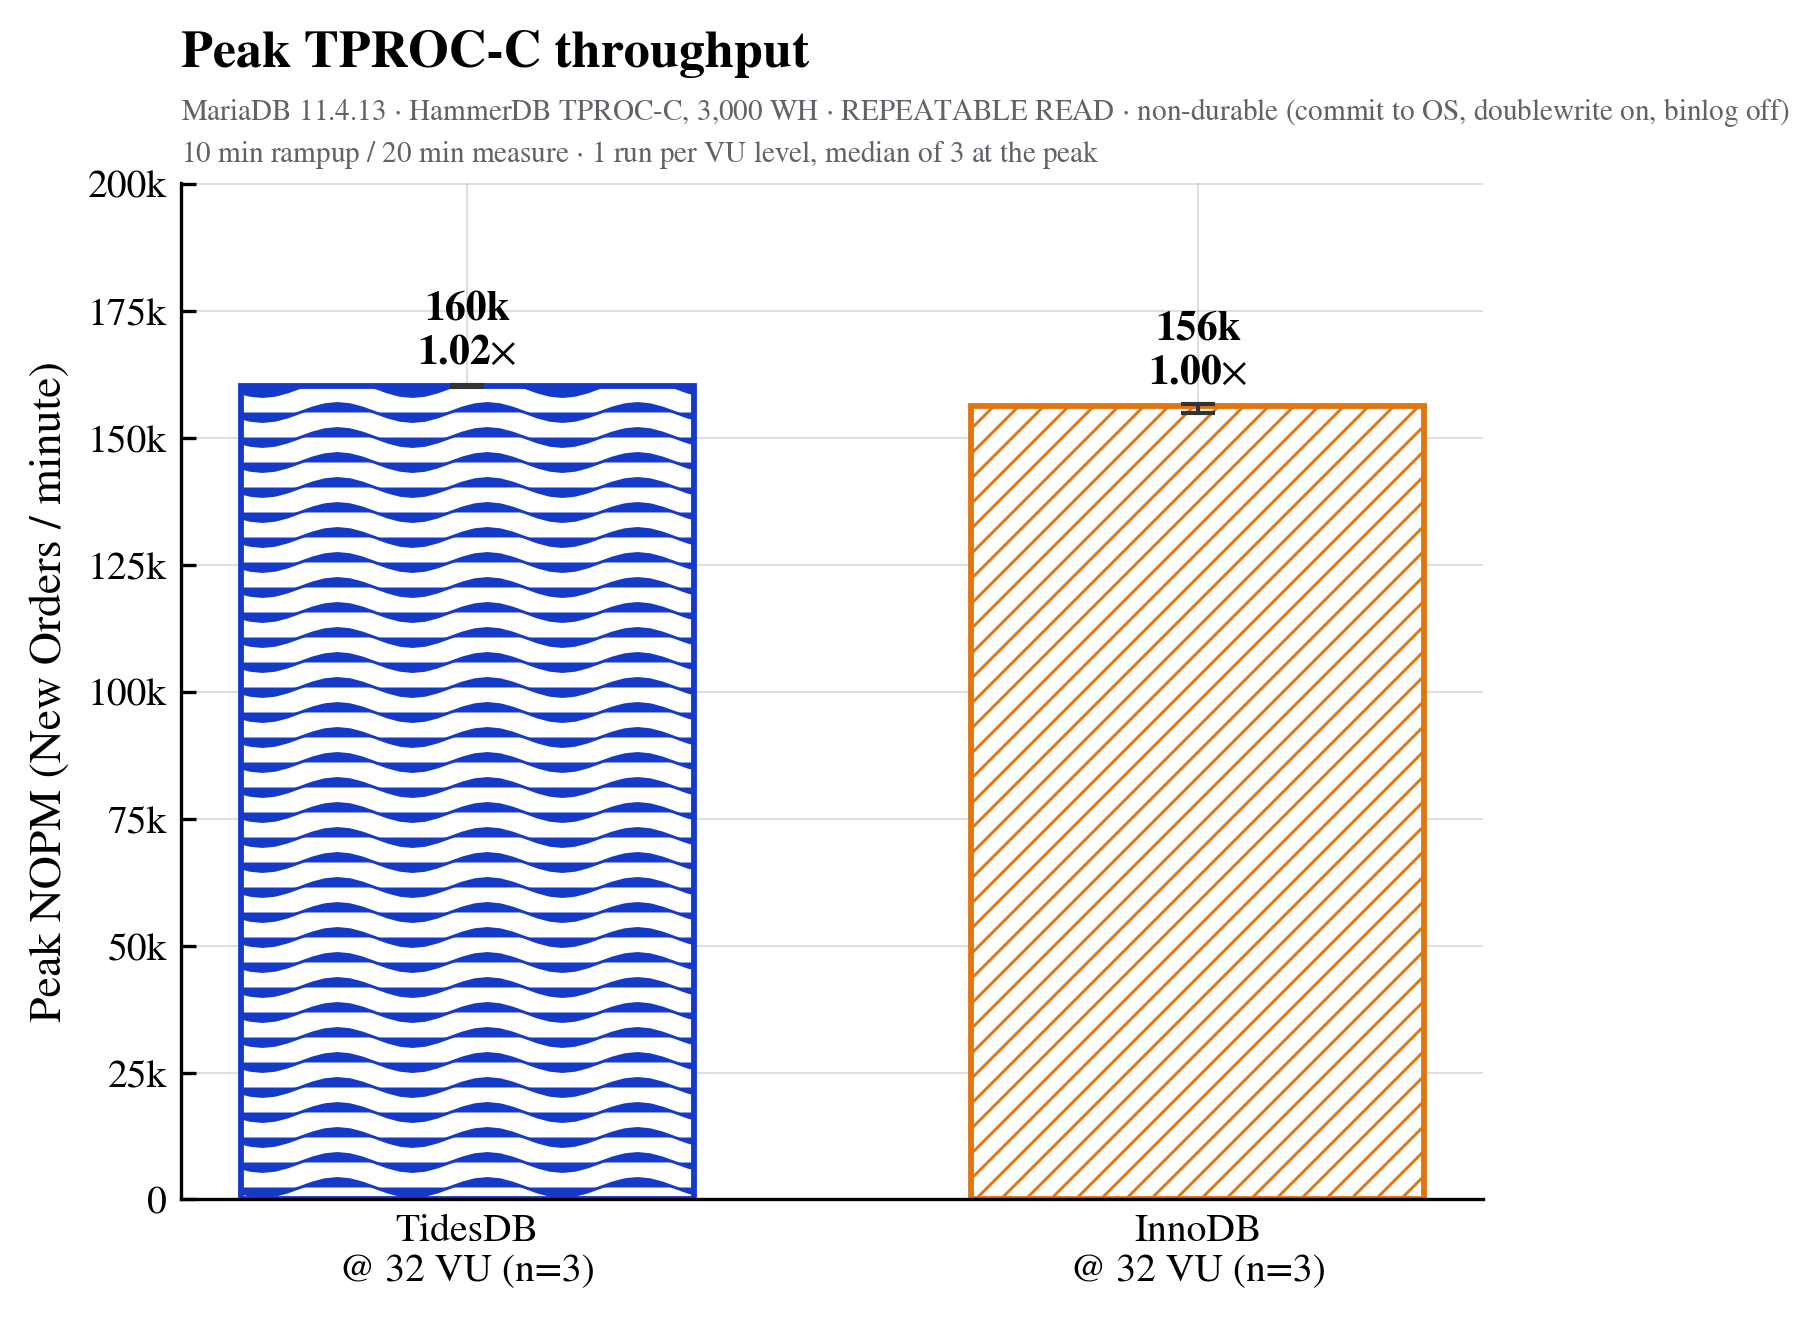
| 32 | 160,106 (n=3) | 22.4 | 156,282 (n=3) | 11.3 | +2% |
| 64 | 158,544 | 34.7 | 133,489 | 44.7 | +19% |
| 128 | 158,003 | 59.5 | 102,899 | 101.0 | +54% |
Three runs at the peak spanned 0.21% for TidesDB (160,055 / 160,106 / 160,389) and 1.1% for InnoDB (154,879 / 156,282 / 156,589). Every run started from the same restored copy with the page cache dropped, so these are independent measurements rather than a server warming up.
Both engines peak at 32 virtual users on a 24-thread host, which is where the driver and the server together saturate the CPU. What differs is the far side of the peak. From 32 to 128 VU in the sweep runs InnoDB falls from 156,502 to 102,899 (-34%); TidesDB goes from 160,327 to 158,003 (-1.5%).
I did not expect the gap at 8 and 16 VU (+20%, +24%), where neither engine is saturated. The write-efficiency numbers below are the likely explanation. At a dataset this far beyond memory, InnoDB spends device bandwidth on page writes that TidesDB does not spend.
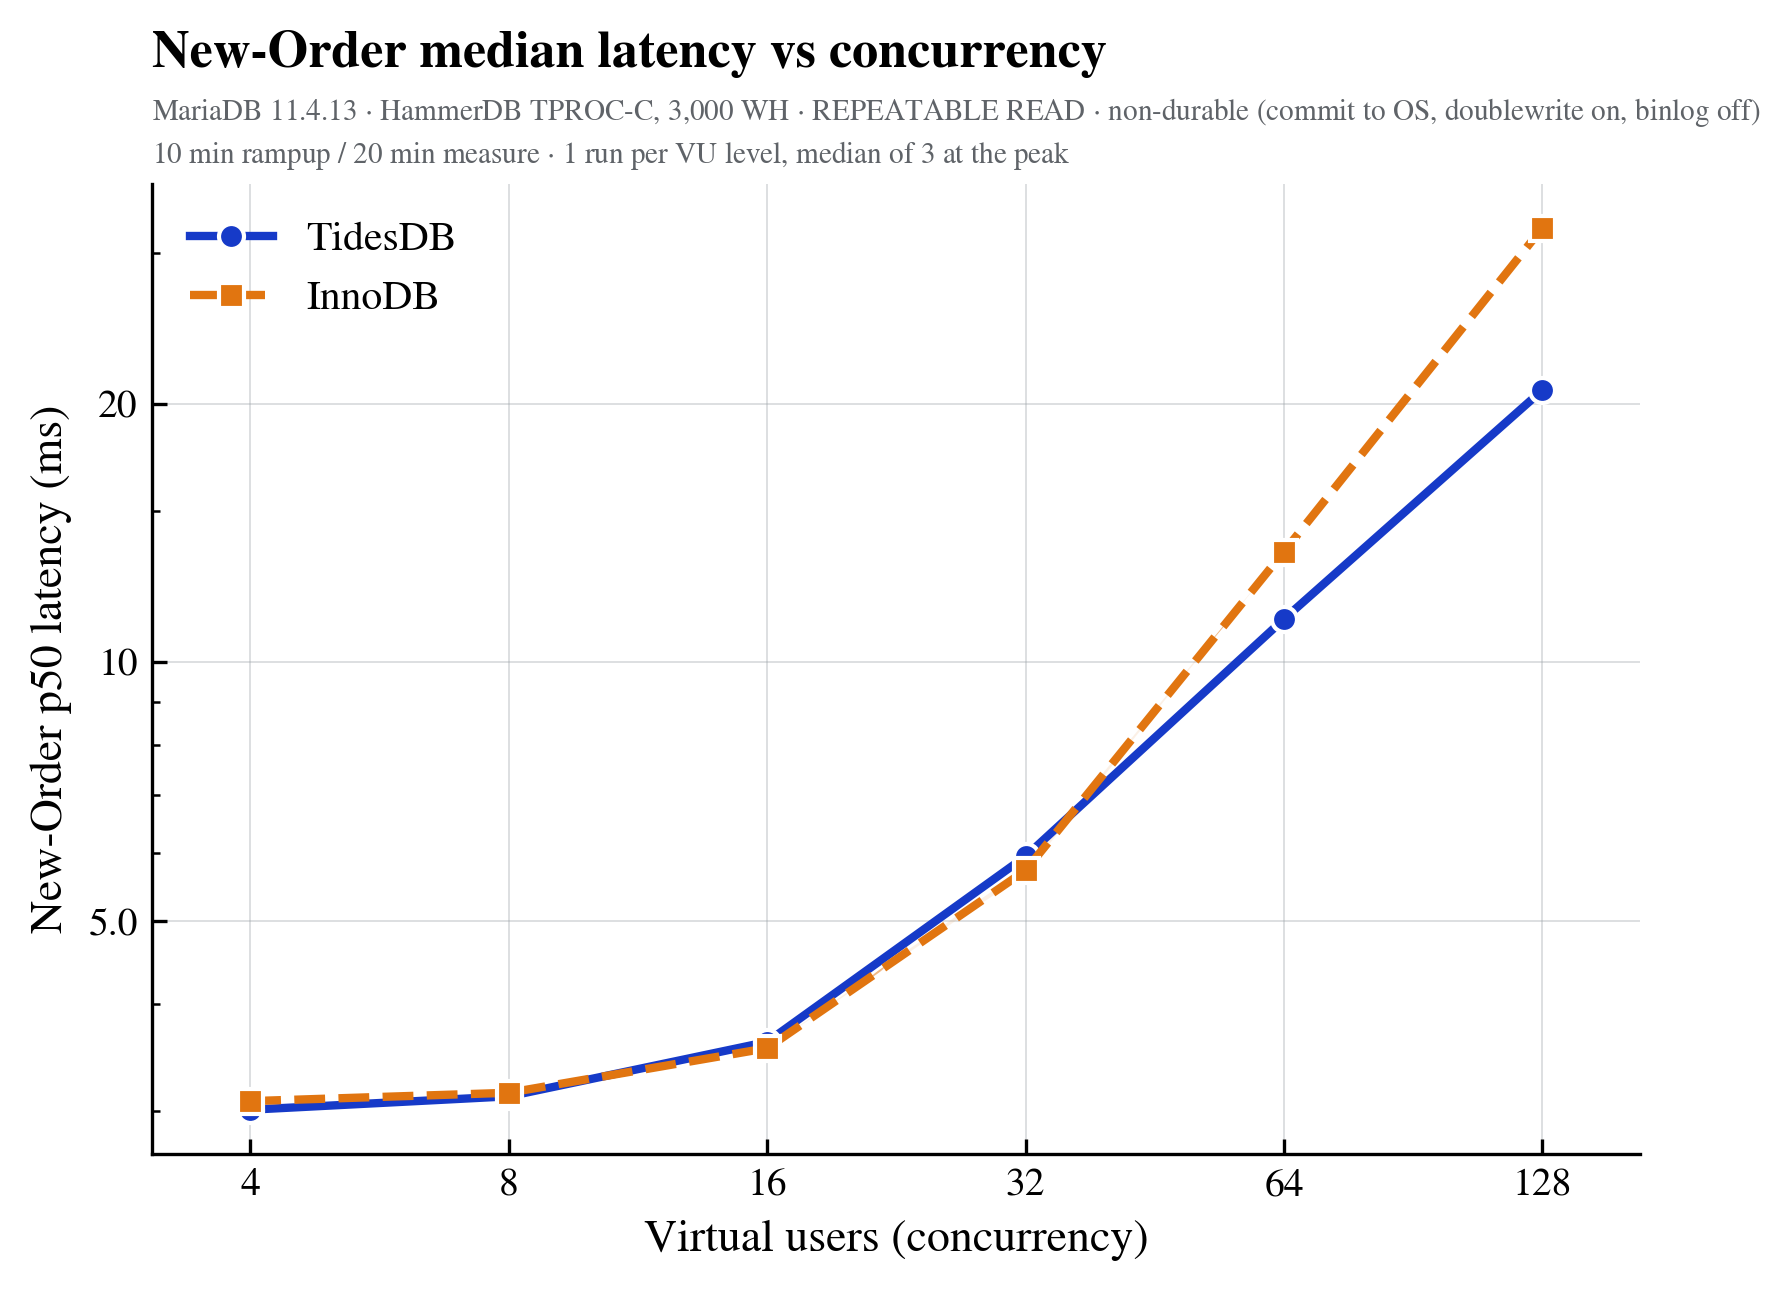
InnoDB has the better tail at 16 and 32 VU (7.9 ms vs 9.9 ms, 11.3 ms vs 22.4 ms), around its peak, where it is working efficiently and TidesDB has already saturated. At 64 and 128 VU the ordering reverses (34.7 vs 44.7 ms, 59.5 vs 101.0 ms).
At the peak (32 VU), over the 20-minute measured window, sampled once per second:
| engine | median TPM | 5th percentile | samples below half the median |
|---|---|---|---|
| TidesDB | 419,580 | 180,720 | 9.5% |
| InnoDB | 379,800 | 215,700 | 3.3% |
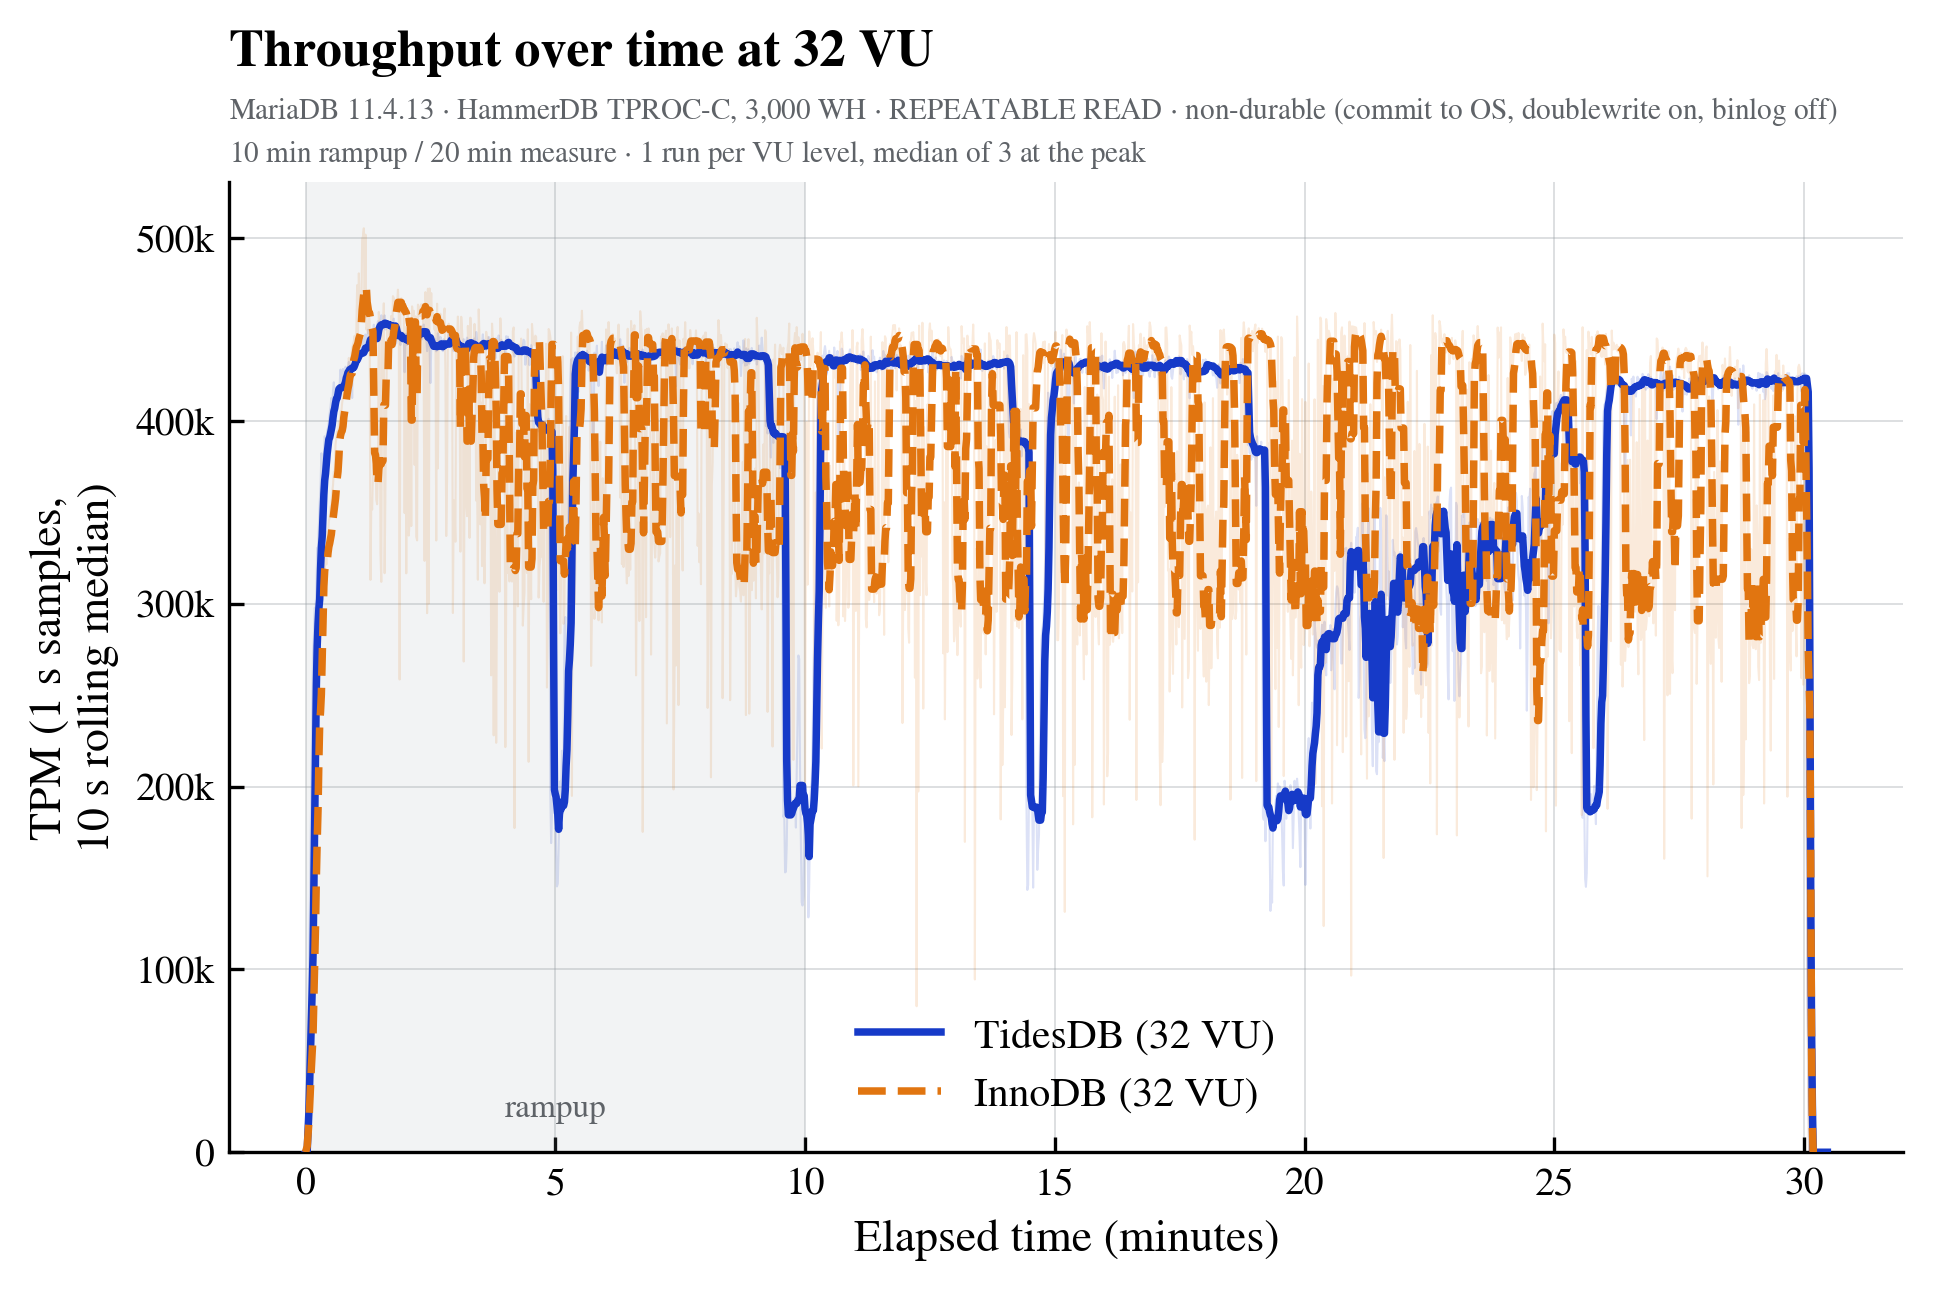
TidesDB runs at a higher median but varies more from second to second, spending about three times
as many samples in a deep dip. That is within a single window and not across the sweep, where
TidesDB is the engine that holds its throughput. Neither engine decays over the window, so this is
periodic stalling rather than a trend, and both engines show it. I have not attributed the dips to specific causes. For TidesDB
the obvious suspect is memtable swaps, drains, and compaction, for InnoDB checkpoint flushing,
and the per-second counters in logs/sample-*.csv are published so the attribution can be done.
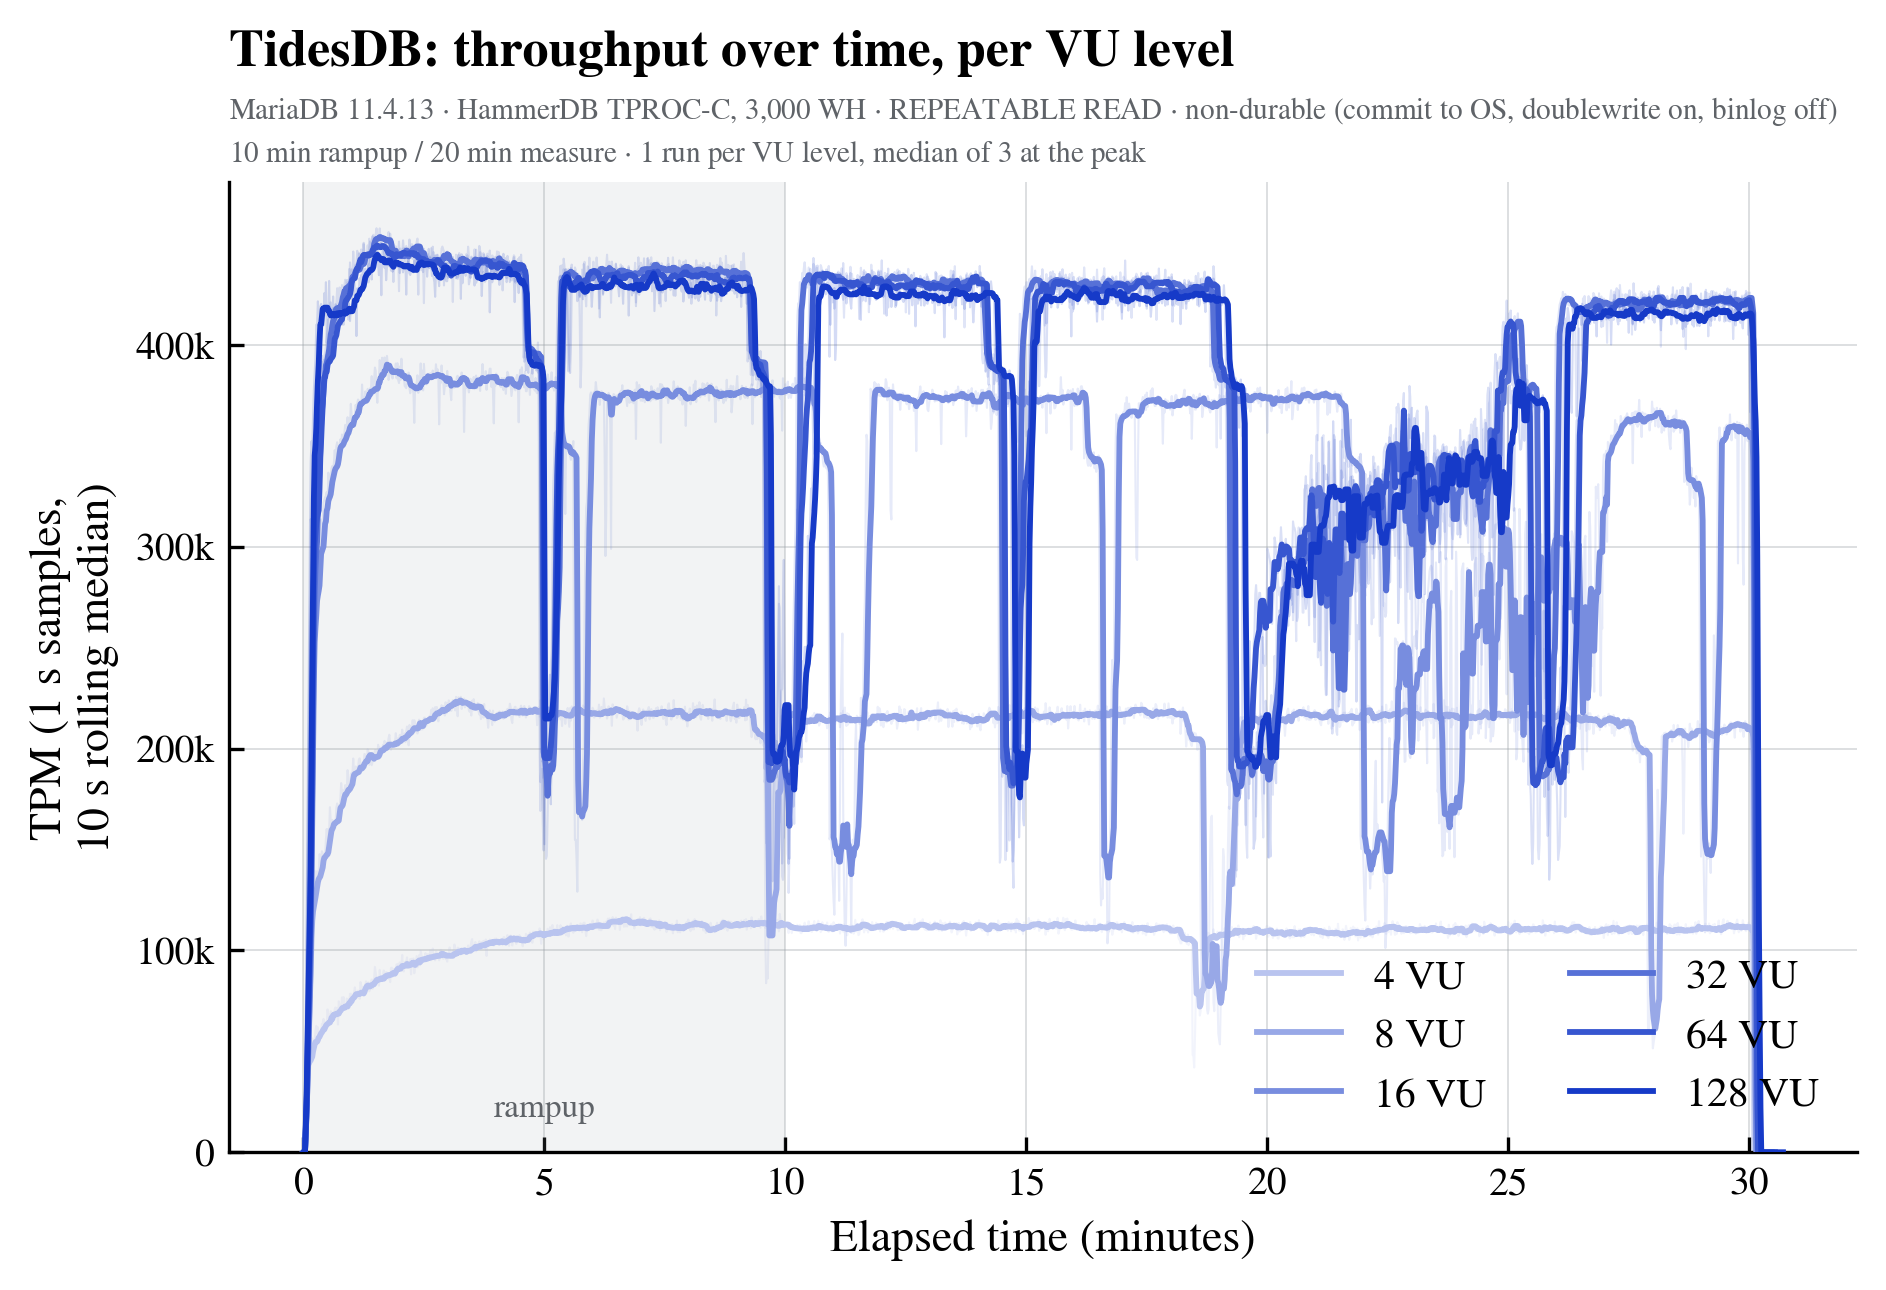
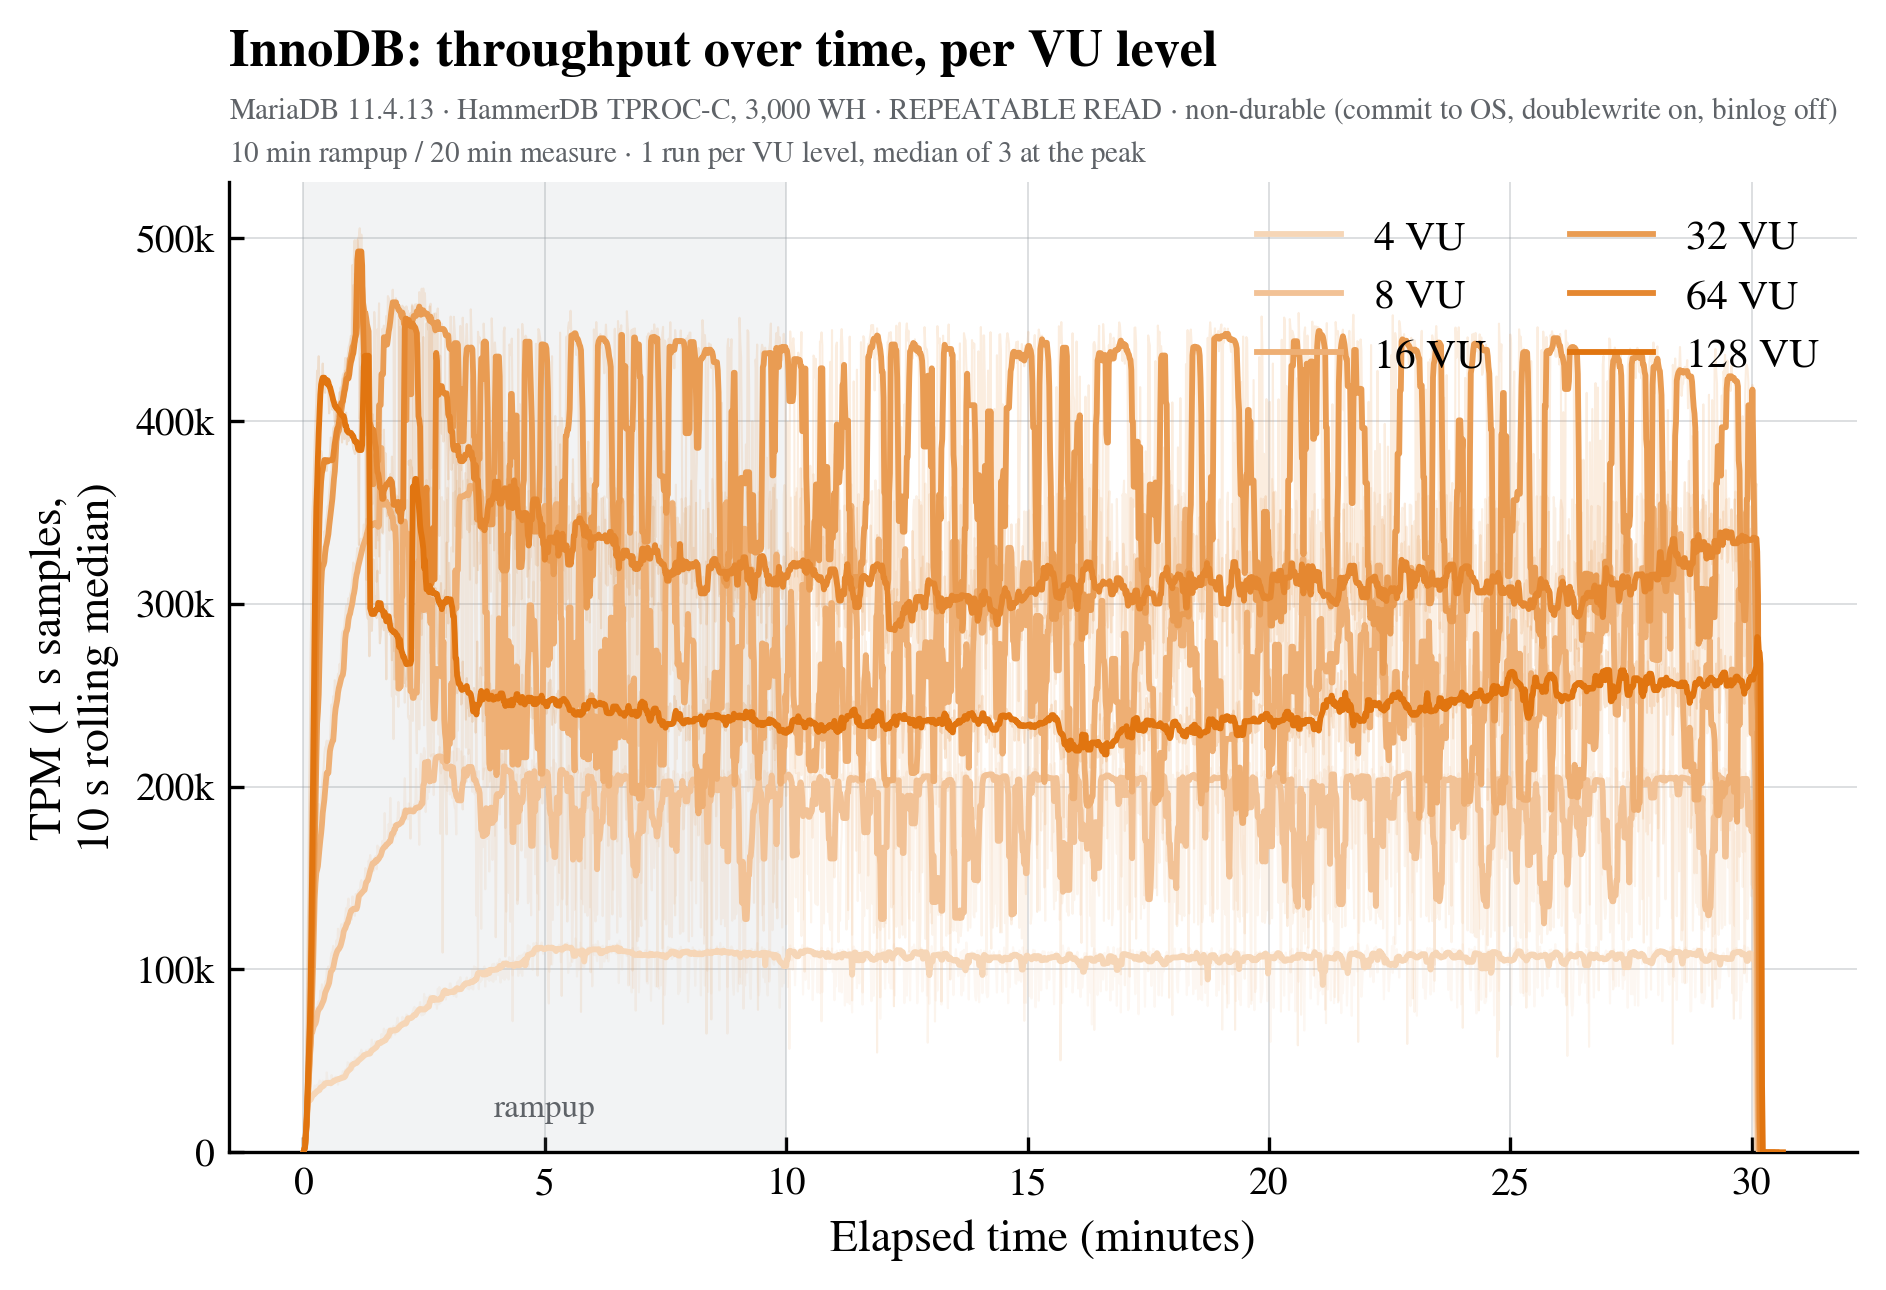
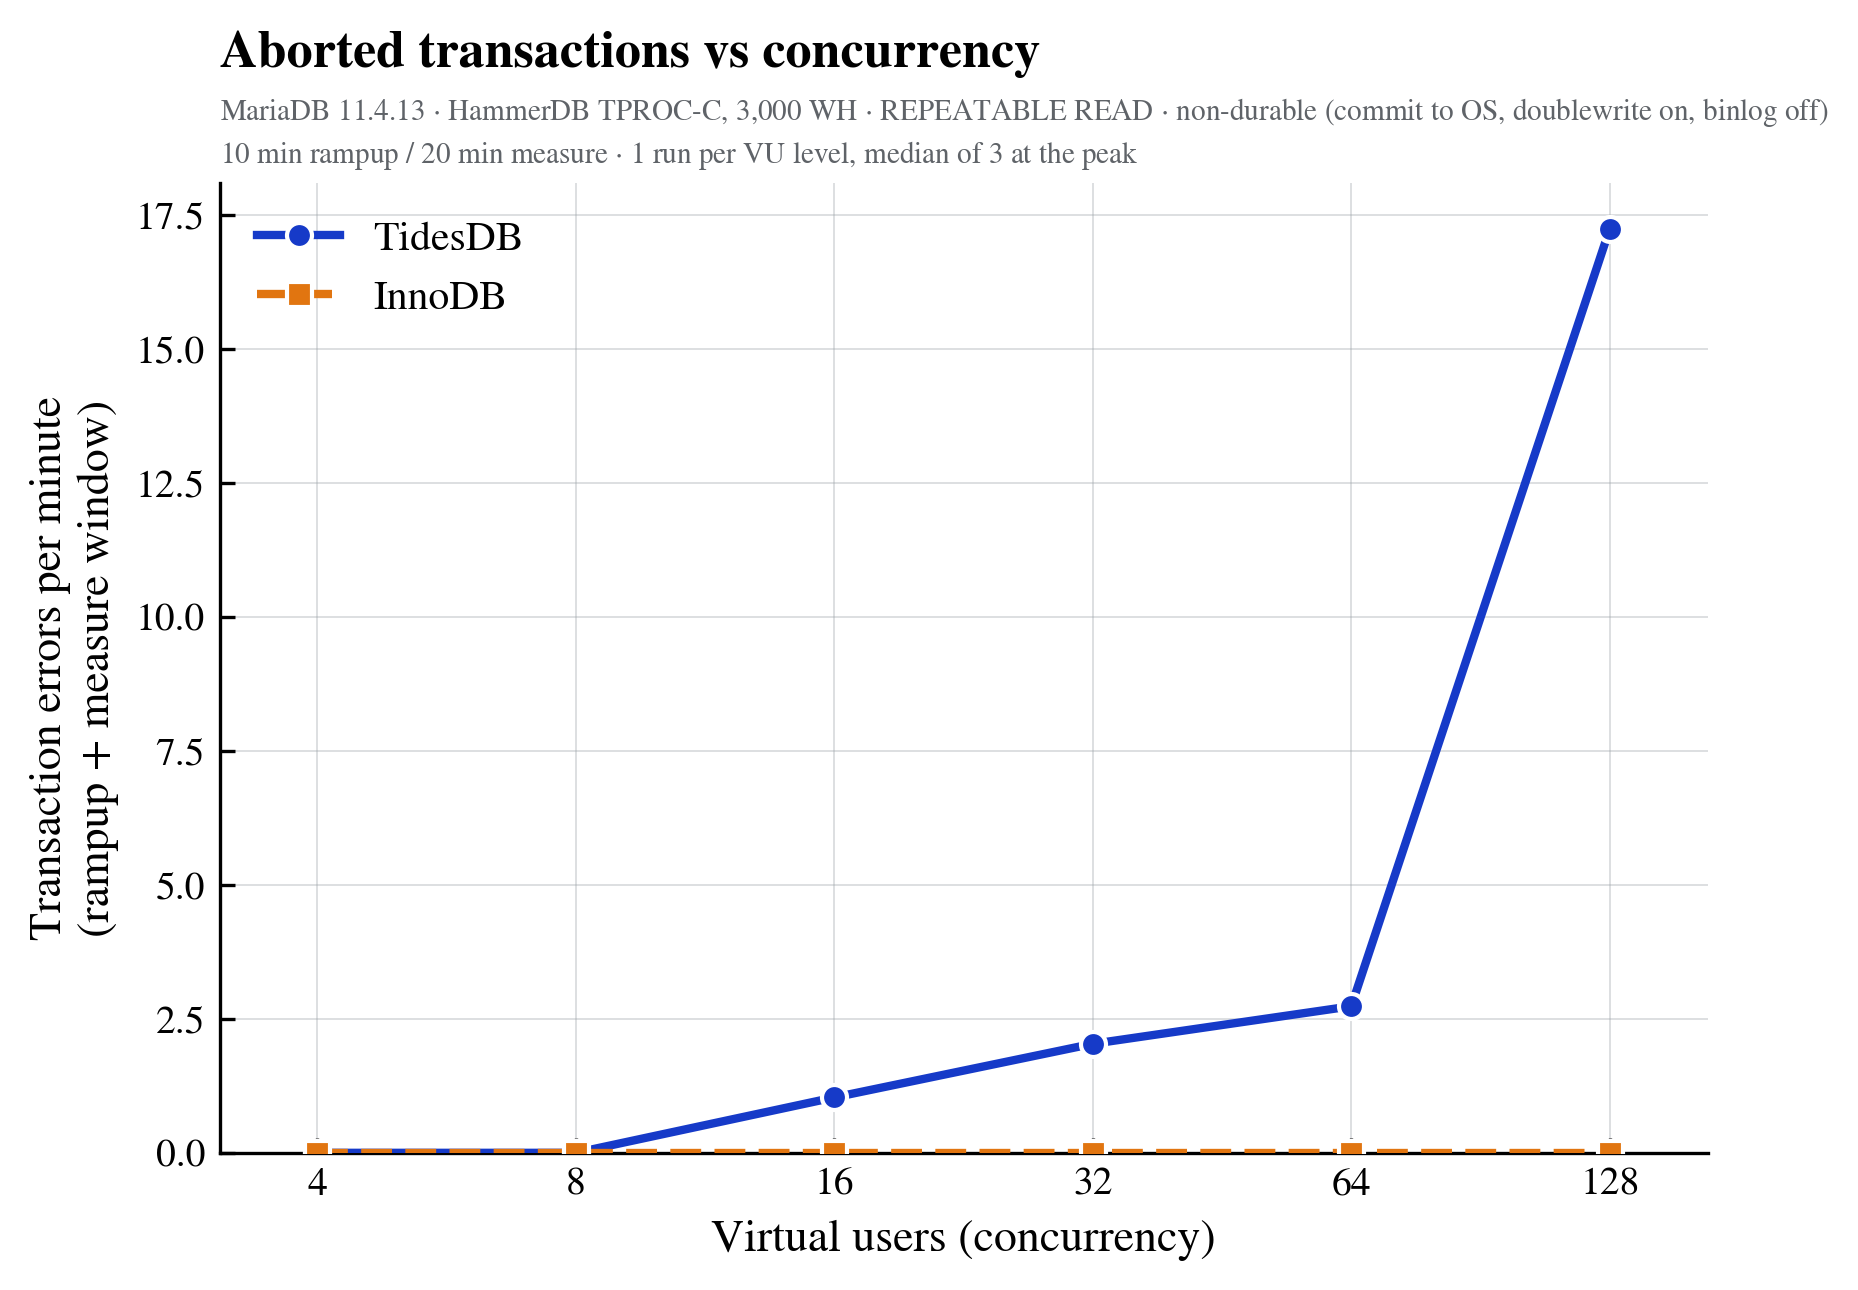
TidesDB recorded no errors at 4 and 8 VU, then 1/min at 16, 2/min at 32, 2.7/min at 64, and 17/min at 128, counted over the full rampup plus measure window. InnoDB recorded zero throughout. These are commit-time write-write conflicts, as TidesDB is optimistic and aborts the loser rather than making it wait, and at 3,000 warehouses they are negligible, under 0.02% of transactions even at 128 VU.
Throughput says how much work got done. This says what it cost. Bytes written to the device per
completed New-Order, taken from each engine’s own accounting before and after every run:
TidesDB’s IO Device Writes (sstable + WAL + value log), InnoDB’s log sequence number delta
plus pages written x 16 KB, counted twice because every page also passes through doublewrite.
| engine | peak NOPM @ 32 VU | GB written in the run | bytes per New-Order |
|---|---|---|---|
| TidesDB | 160,106 | 256 | 53,262 |
| InnoDB | 156,589 | 1,636 | 348,243 |
TidesDB writes about 6.5x fewer bytes per transaction for the same work. Some of that is structural, since InnoDB writes whole 16 KB pages and every one goes through doublewrite while TidesDB appends to a WAL and writes sstables in bulk. Some of it is a configuration choice, which is the caveat below.
innodb_max_dirty_pages_pct=1 comes from HammerDB’s CI config, which I used as the InnoDB base.
It holds dirty pages to 1% of the 64 GB pool, so a page
updated repeatedly is flushed to disk repeatedly instead of being written once at checkpoint.
HammerDB’s own MySQL/MariaDB best-practice guide uses 90 for throughput runs. So InnoDB’s write
volume here is inflated by a setting I did not tune, and a differently configured InnoDB would
write less. I have not measured how much less. It barely affected throughput (InnoDB still
peaked within 2.4% of TidesDB), so the NOPM comparison is unaffected, but the efficiency ratio is
not a clean engine-to-engine result.
The ratio also moves with concurrency. TidesDB costs 16.8 KB per New-Order at 4 VU, rising to ~53 KB at 32 VU and above, as compaction catches up with the write rate. InnoDB sits between 300 and 400 KB throughout.
On disk after the build, TidesDB held the 3,000 warehouses in 245.5 GB. InnoDB held 307.0 GB, of which 32 GB is the preallocated redo log, so 275.0 GB of table and index data. Excluding that redo log, TidesDB holds the same 3,000 warehouses in about 11% less space. Neither engine is compressed.
That’s all for this analysis, thank you!
You can download raw data and reproducible scripts here (sha256: 14e8683ea60a05dbea32f66f34075569cf0e474f7eac64d190bcf103d9b833af)